. 2016 May 5;165(4):976-89.
doi: 10.1016/j.cell.2016.04.034.

Dynamics of Translation of Single mRNA Molecules In Vivo

Affiliations

Dynamics of Translation of Single mRNA Molecules In Vivo

Xiaowei Yan et al. Cell. .

Abstract

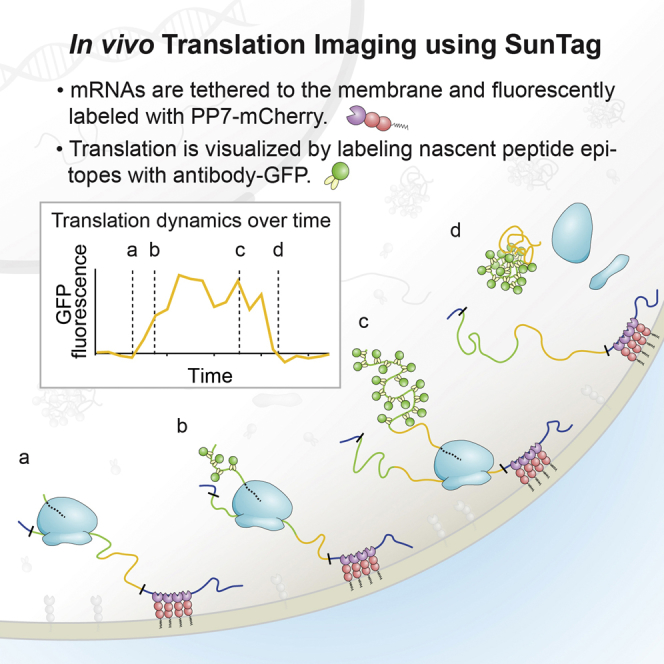
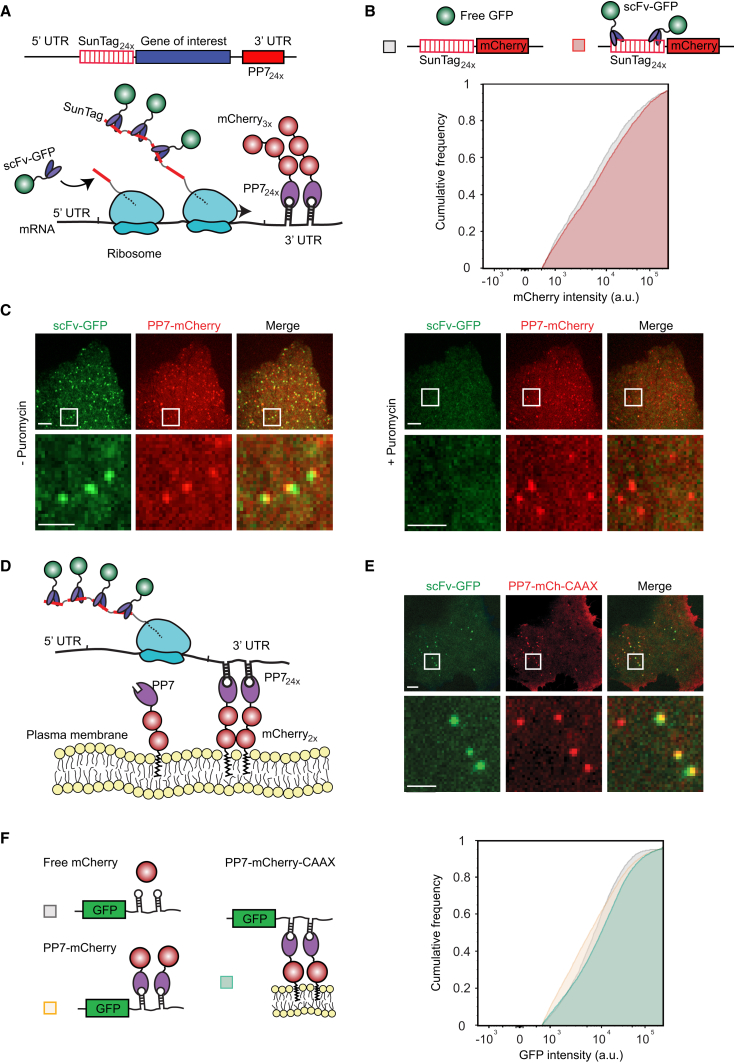
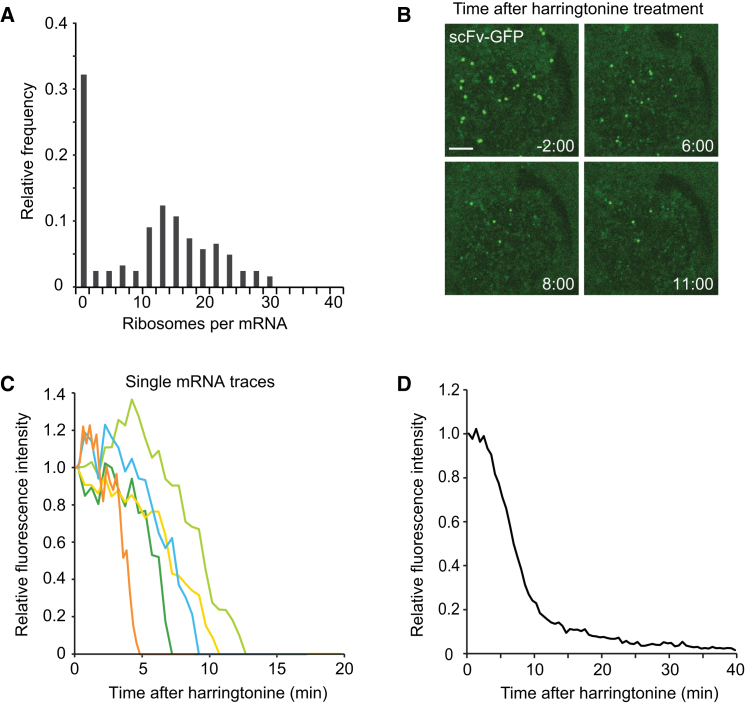
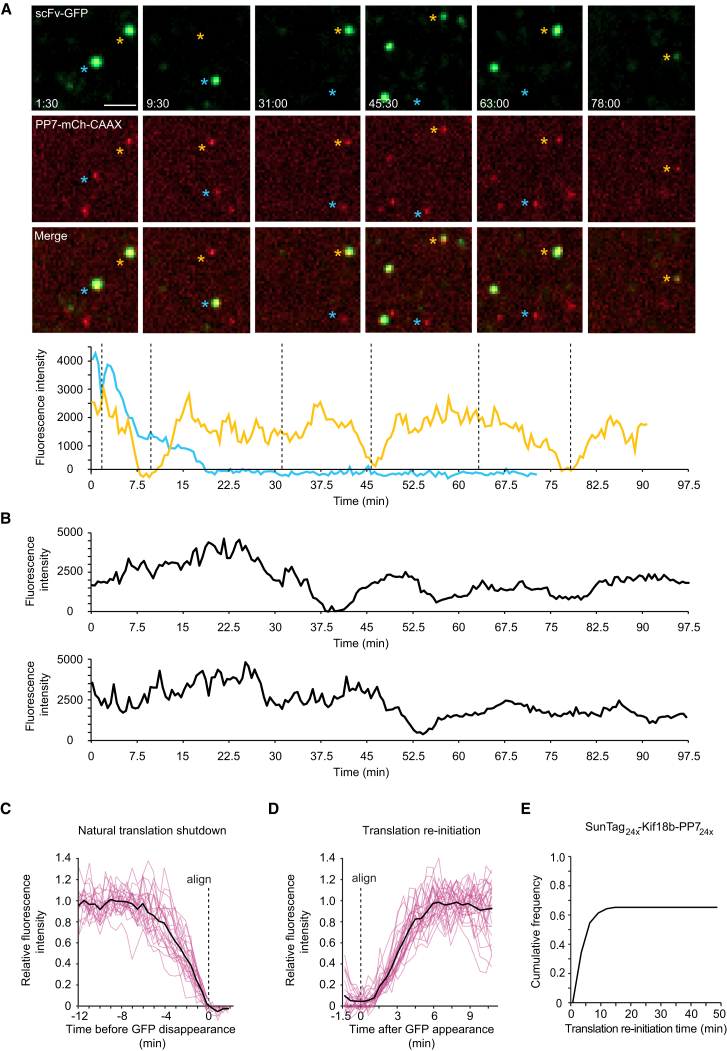
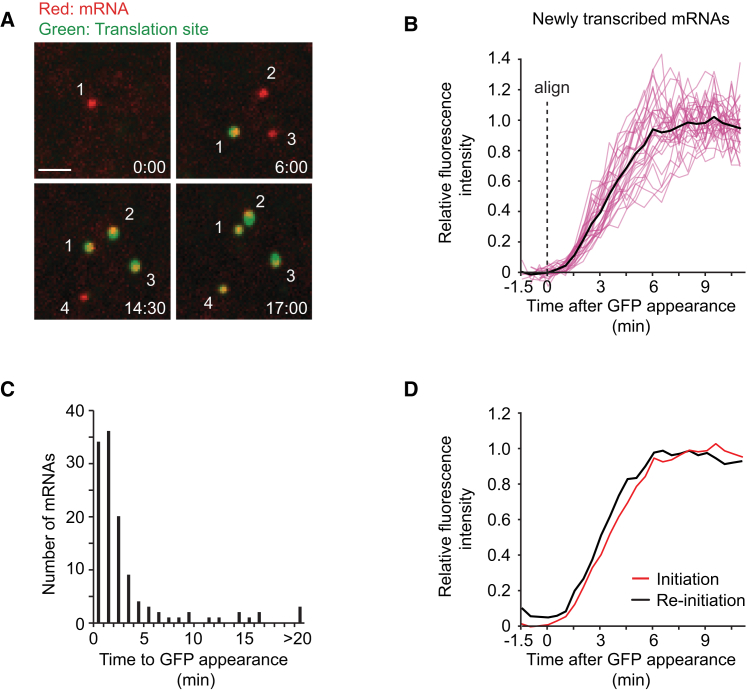
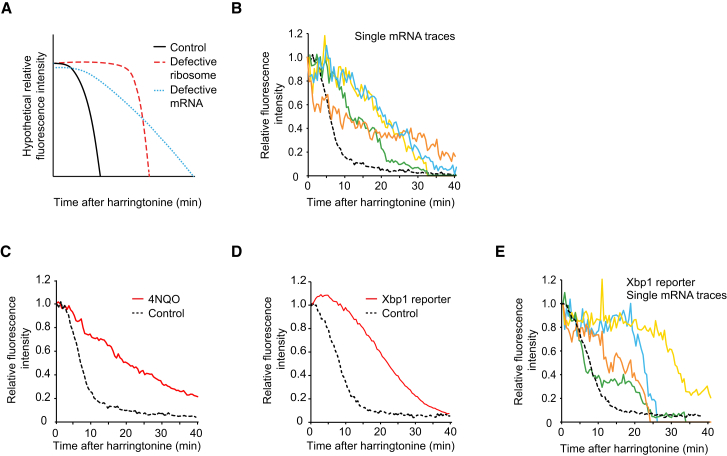
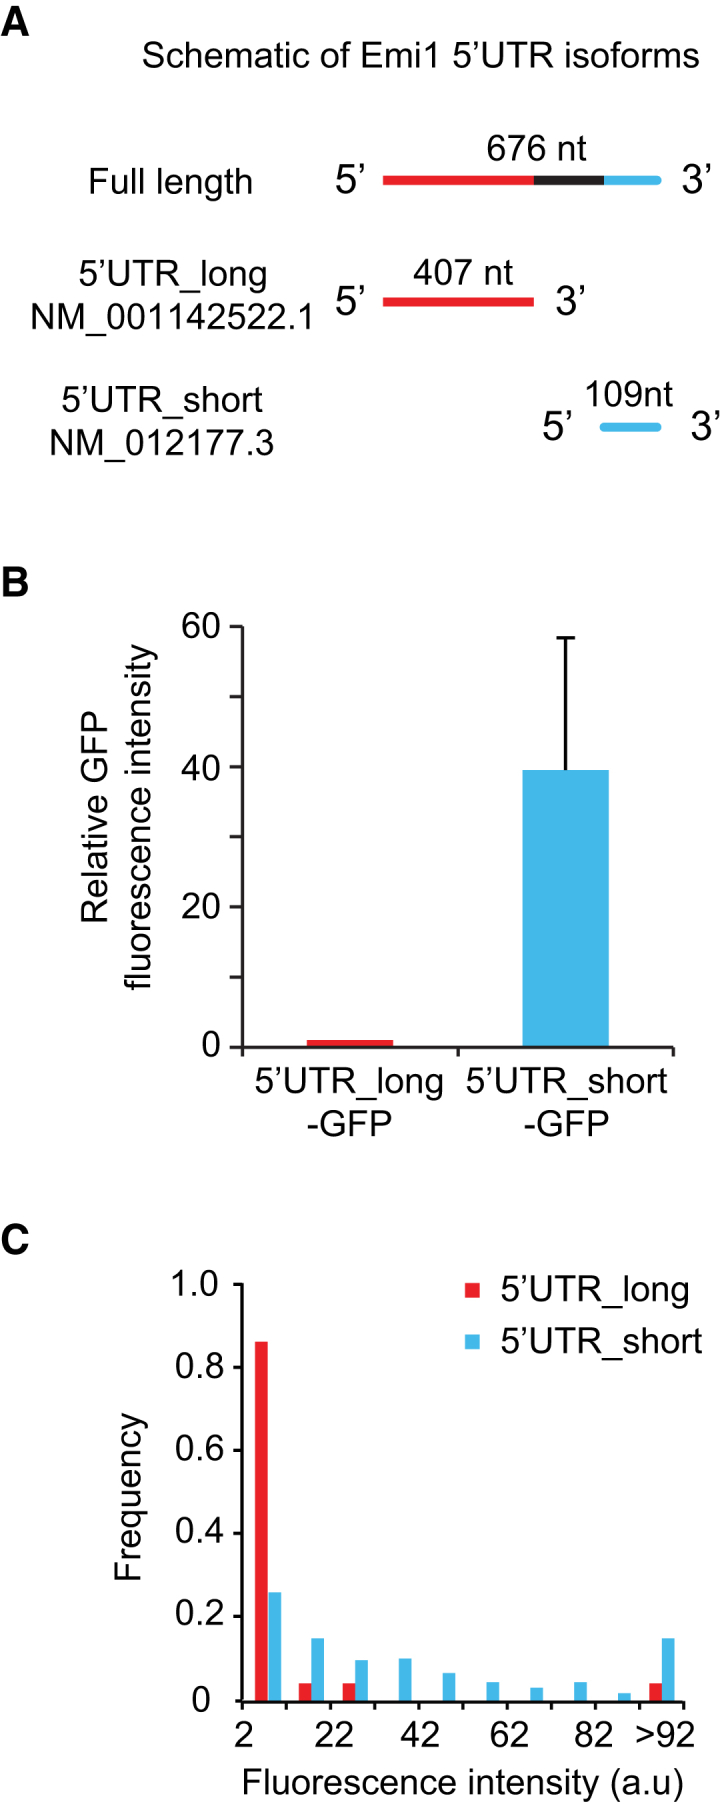
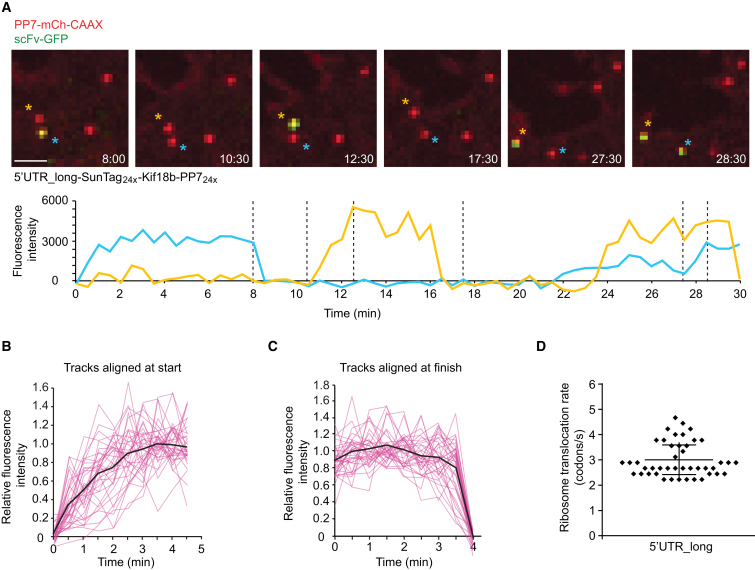
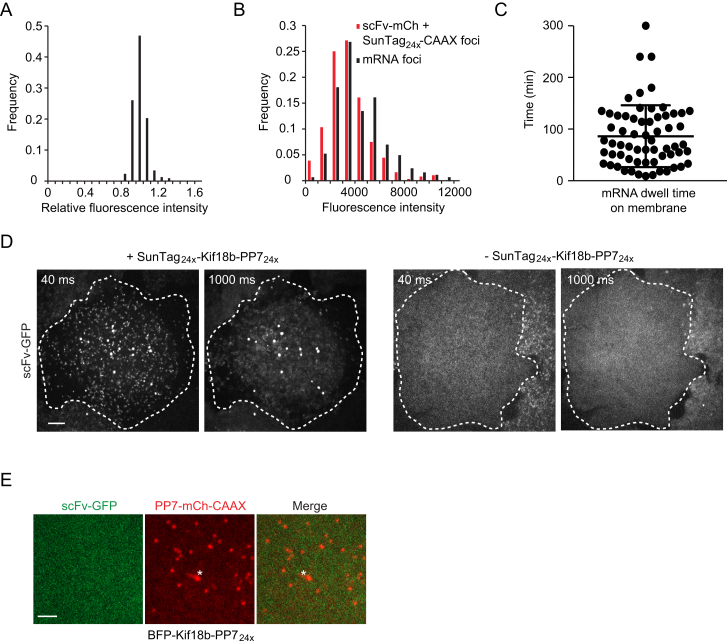
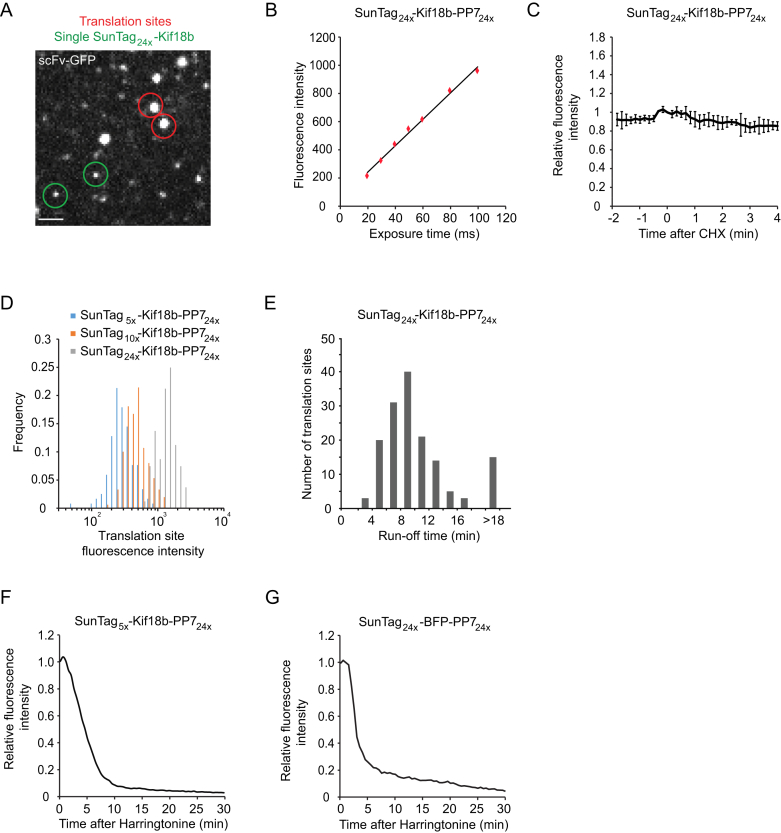
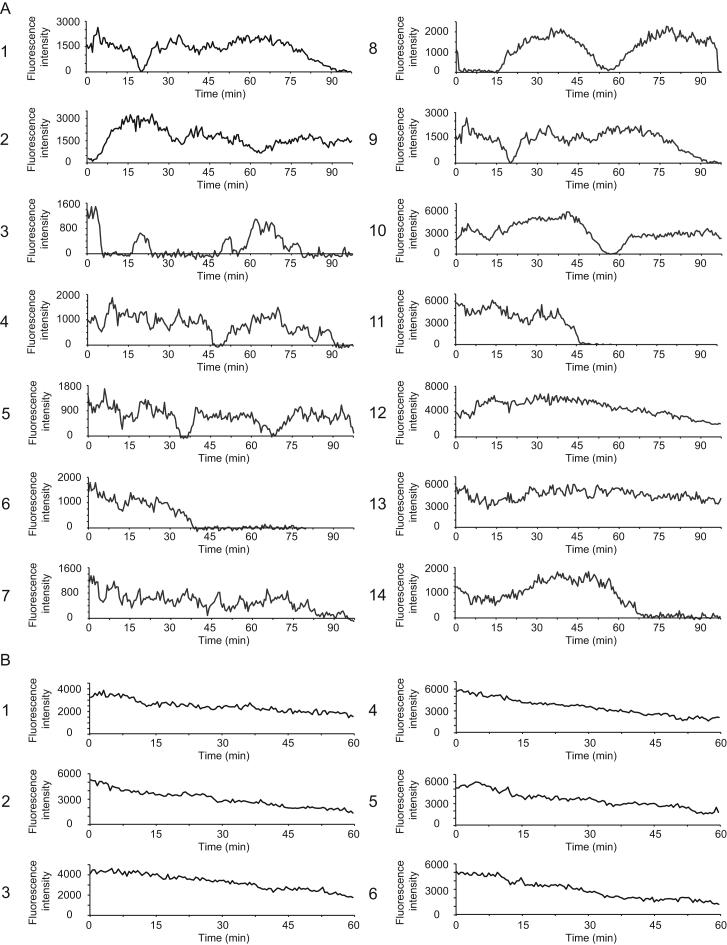
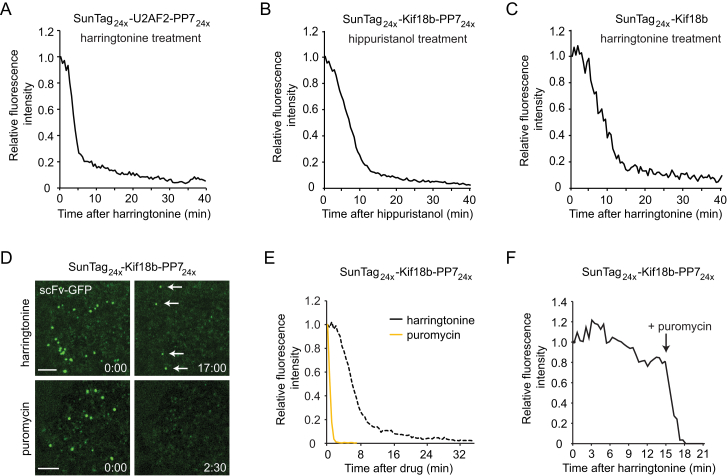
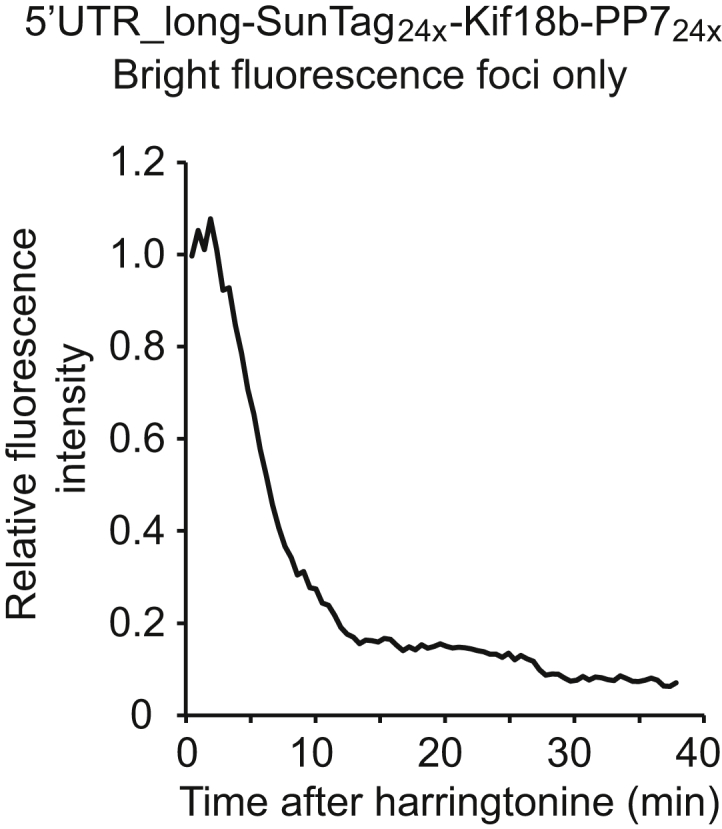
Regulation of mRNA translation, the process by which ribosomes decode mRNAs into polypeptides, is used to tune cellular protein levels. Currently, methods for observing the complete process of translation from single mRNAs in vivo are unavailable. Here, we report the long-term (>1 hr) imaging of single mRNAs undergoing hundreds of rounds of translation in live cells, enabling quantitative measurements of ribosome initiation, elongation, and stalling. This approach reveals a surprising heterogeneity in the translation of individual mRNAs within the same cell, including rapid and reversible transitions between a translating and non-translating state. Applying this method to the cell-cycle gene Emi1, we find strong overall repression of translation initiation by specific 5' UTR sequences, but individual mRNA molecules in the same cell can exhibit dramatically different translational efficiencies. The ability to observe translation of single mRNA molecules in live cells provides a powerful tool to study translation regulation.


Figures

None
Graphical abstract
Figure 1
Figure 1
Fluorescence Labeling of Nascent Chains to Visualize Translation of Single mRNA Molecules (A) Schematic of nascent polypeptide labeling using the SunTag system and mRNA labeling (A) and membrane tethering (D) using the PP7 system. (B) A mCherry-SunTag24x reporter gene was co-transfected with either GFP or scFv-GFP, and the expression of the SunTag24x-mCherry reporter was determined by FACS (Experimental Procedures). Binding of the scFv-GFP to the SunTag nascent chain did not detectably alter protein expression. (C) A representative U2OS cell is shown expressing scFv-GFP, PP7-3xmCherry, and the translation reporter (SunTag24x-Kif18b-PP724x). Cytosolic translation sites (scFv-GFP) co-localize with mRNAs (PP7-3xmCherry). Ribosomes were dissociated from mRNA by addition of puromycin (right panel). Note that translation sites and mRNA do not perfectly overlap because of the brief time difference in acquiring GFP and mCherry images. (D) Schematic of nascent polypeptide labeling and membrane tethering of the mRNA using the PP7 system. (E) U2OS cells expressing scFv-GFP (green), PP7-2xmCherry-CAAX (red), and the translation reporter (SunTag24x-Kif18b-PP724x). A single time point of the cell (top panel) and a zoomed-in view from the white-boxed area containing a few mRNAs (lower) are shown. (F) U2OS cells were transfected with mCherry, PP7-mCherry, or PP7-mCherry-CAAX together with a GFP reporter transcript with 24 PP7 binding sites in the 3′ UTR, and GFP expression was analyzed by FACS (Experimental Procedures). Cumulative distribution of GFP expression levels from GFP-mCherry double positive cells are shown in (B) and (F) (n = 3 independent experiments). Scale bars, 5 μm (upper) and 2 μm (lower). See also Figure S1 and Movie S1. Visualizing Translation of Single mRNAs in Live Cells, Related to Figure 1, Movie S2. GFP Foci Represent Sites of Translation, Related to Figure 1, Movie S3. Visualizing Translation of Membrane-Tethered mRNAs, Related to Figure 1.
Figure 2
Figure 2
Measurements of Ribosome Initiation and Elongation Rates on Single mRNA Molecules U2OS cells expressing scFv-GFP, PP7-2xmCherry-CAAX, and the translation reporter (SunTag24x-Kif18b-PP724x). (A) Distribution of the number of ribosomes bound to single mRNAs of the translation reporter (SunTag24x-Kif18b-PP724x) (n = 2 independent experiments, 16 cells, 124 mRNAs), see Supplemental Experimental Procedures. (B–D) U2OS cells expressing the translation reporter (SunTag24x-Kif18b-PP724x) were treated with harringtonine at t = 0. (B) Representative images from a time-lapse movie. (C) Five representative traces of fluorescence decay on single mRNAs (of >100 analyzed). (D) Normalized quantification of the decrease in fluorescence over time from many translation sites (n = 4 independent experiments, 37 cells, 536 mRNAs). Scale bars, 5 μm. See also Figure S2 and Movie S4.
Figure 3
Figure 3
Long-Term Dynamics of Translation of Single mRNA Molecules U2OS cells expressing scFv-GFP, PP7-2xmCherry-CAAX, and the translation reporter (SunTag24x-Kif18b-PP724x). (A) U2OS cell expressing the SunTag24x-Kif18b-PP724x reporter was imaged by time-lapse microscopy. Blue and yellow asterisks mark two different mRNAs undergoing changes in translation over time (upper). Intensity of scFv-GFP was measured over time for the two mRNAs (lower). Colors of lines correspond to scFv-GFP intensity of translation sites marked by asterisk with the same color. (B) ScFv-GFP intensity traces of two additional mRNA molecules. (C) mRNAs undergoing permanent translation shutdown. Fluorescence intensity quantification is shown (n = 24 mRNAs). Average (black line) and single traces (pink lines) are shown. (D) mRNAs undergoing translation re-activation after shutdown. Average (black line) and single traces (pink lines) are shown (n = 30 mRNAs). (E) Time to reappearance of the first scFv-GFP fluorescence from translation sites that underwent complete translational shutdown. ∼60% of the mRNAs re-initiated translation after complete shutdown and did so within 10 min (n = 104 translational sites analyzed). Scale bar, 2 μm. See also Figure S3 and Movie S5.
Figure 4
Figure 4
Analysis of Polysome Build Up on Newly Transcribed mRNAs U2OS cells expressing scFv-GFP, PP7-2xmCherry-CAAX, and the translation reporter (SunTag24x-Kif18b-PP724x). (A) Images from a time-lapse movie of newly transcribed mRNAs undergoing the first rounds of translation. (B) Quantification of the fluorescence intensity increase, aligned at the first time point at which scFv-GFP signal was detected (n = 30 individual mRNAs [pink lines], and average [black line] is shown). (C) Quantification of the time between mRNA appearance and the first detection of translation by scFv-GFP fluorescence. (D) Comparison of scFv-GFP fluorescence buildup on either new transcripts (red line) or on re-initiating mRNAs (black line). Data are re-plotted from Figures 3D and 4B. Scale bar, 2 μm. See also Movie S6.
Figure 5
Figure 5
Dynamics of Ribosome Stalling U2OS cells expressing scFv-GFP, PP7-2xmCherry-CAAX, and the SunTag24x-Kif18b-PP724x translation reporter (A–C) or the Xbp1 translation reporter (D–E). (A and B) Ribosome stalling likely results from mRNA defects, model (A) and experiment (B). (B) Fluorescence intensity over time is shown for four representative stalled translation sites (colors; of 20 analyzed). Since intensity values of single mRNAs were derived from the experiments presented in Figure 2D, the average fluorescence decay presented in Figure 2D is re-plotted here for comparison (dashed black line). (C) Nucleic acid damage through 4NQO treatment (red line) induces ribosome stalling (n = 3 independent experiments, 40 cells, 455 mRNAs). For comparison, the harringtonine runoff from control cells with the SunTag24x-Kif18b-PP724x reporter from Figure 2D is re-plotted, as these experiments were performed in parallel. (D and E) Harringtonine runoff for the Xbp1 pause site (red line, n = 3 independent experiments, 31 cells, 990 mRNAs) (D) and control reporter (black dashed lines, n = 3 independent experiments, 27 cells, 437 mRNAs) (E). See also Figure S4.
Figure 6
Figure 6
Differential Control of Translation Initiation by Two Emi1 Splicing Isoforms (A) Schematic of the 5′ UTR of two Emi1 splicing isoforms. (B) Fluorescence intensity of a GFP reporter under control of the two Emi1 isoforms (5′ UTR_long and 5′ UTR_short) expressed in HEK293 cells was measured by microscopy for single cells. Mean intensities were determined, which was corrected for background fluorescence in untransfected cells. At least 20 cells were measured per experiment per condition. Error bars, SD between experiments. (C) Fluorescence intensity distributions of single translation sites of indicated reporters, n = 3 independent experiments, 283 mRNAs, 14 cells (5′ UTR_long) and n = 3 independent experiments, 433 mRNAs, 16 cells (5′ UTR_short). Background from adjacent regions was subtracted. Only mRNAs are plotted that had translation signal above background (with an intensity value >2; 16% and 53% of mRNAs for 5′ UTR_long and 5′ UTR_short, respectively). See also Figure S5.
Figure 7
Figure 7
Visualizing Single Ribosomes Decoding an mRNA Molecule (A–D) Analysis of single ribosomes on the Emi1 5′UTR_long reporter mRNA. (A) Representative images of multiple single ribosome translation events of individual mRNAs (upper). ScFv-GFP intensity was quantified over time for the two mRNAs marked by asterisks with the same color (lower). (B) Increase in scFv-GFP fluorescence from single ribosome translation events aligned at the first detectable scFv-GFP signal (n = 35 individual mRNAs in pink and average in black). (C) Steady-state and then abrupt decrease in scFv-GFP fluorescence from single translating ribosomes (n = 35 individual mRNAs [pink] and average [black]). (D) Single ribosome elongation rates (n = 44) (Supplemental Experimental Procedures). Mean ± SD is shown in (D). Scale bar, 2 μm. See also Figure S6 and Movie S7.
Figure S1
Figure S1
Validation of Single Molecule Translation Visualization Assay, Related to Figure 1 (A–C) U2OS cells expressing scFv-GFP, PP7-2xmCherry-CAAX and the SunTag24x-Kif18b-PP724x translation reporter. (A) Fluorescence intensity of mRNA foci was measured and was corrected for background fluorescence. The average corrected mRNA fluorescence intensity was set to 1 for each separate cell (n = 3 experiments, 14 cells, 278 mRNAs). (B) Intensity of single mRNA foci was measured and corrected for background, but intensity was not normalized as in (A) to allow comparison of absolute intensities (Black bars, n = 3 independent experiments, 22 cells, 377 mRNAs). In parallel, U2OS cells co-expressing SunTag24x–CAAX and scFv-mCherry were imaged and the intensities of single membrane bound scFv-mCherry-SunTag24x foci was measured (Red bars, n = 4 independent experiments, 24 cells, 162 mRNAs). (C) Dwell time of tethered mRNAs on the membrane. The time between mRNA appearance at the focal plane of the membrane and its disappearance was scored. mRNA disappearance was due to mRNA detachment or degradation, not photobleaching. Mean and SD are indicated. (D) Cells expressing scFv-GFP with (left two images) or without (right two images) the SunTag24x-Kif18b-PP724x reporter were imaged with indicated exposure time. Dotted line shows outline of the cell. (E) U2OS cells expressing scFv-GFP, PP7-2xmCherry-CAAX and the BFP-Kif18b-PP724x translation reporter. Representative image is shown. Asterisk indicates lysosome. Scale bars are 5 μm (D) and 2 μm (E).
Figure S2
Figure S2
Quantification of Ribosome Number and Elongation Speed on Single mRNAs, Related to Figure 2 U2OS cells expressing scFv-GFP, PP7-2xmCherry-CAAX and indicated translation reporters. (A) Images were acquired using short exposure times (40 ms), limiting motion blurring of fast moving particles, so both translation sites (red circle) and single, fully synthesized, freely diffusing SunTag proteins (green circles) could be observed as distinct foci. Fluorescence intensity of single SunTag24x-Kif18b foci and single translation site was quantified in the same cell using a ROI with fixed size. (n = 45 translation sites, 15 cells, 3 experiments). (B) To determine whether the exposure time of 40 ms used in (A) was sufficiently short to prevent a reduction in fluorescence intensity of foci due to motion blurring, we measured the intensity of single fully synthesized SunTag24x-Kif18b foci at different exposure times. Fluorescence intensities of the ∼25 brightest foci per image were measured. Results show a linear relationship between exposure time and fluorescence intensity at short exposure times, indicating that exposure times where short enough to prevent reduction in fluorescence intensity of foci due to motion blurring (n = 3 independent experiments, 18 cells and 400-500 spots). (C) Cells were treated with 200 μg/mL CHX at t = 0 and fluorescence intensities of translation sites were measured over time. Note that fluorescence does not increase upon CHX treatment (n = 3 independent experiments, 31 cells, 209 mRNAs). Error bars indicate SD. (D) scFv-GFP fluorescence intensity of translation sites using reporters with varying numbers of SunTag peptides (5×, 10× and 24×). (n = 117, 149, 80 translation sites for the 5×, 10× and 24× reporters, respectively). (E–G) Cells were treated with harringtonine at t = 0 and translation-site intensity was quantified over time. (E) Histogram of the total run-off time, measured from the time of harringtonine treatment to the final disappearance of the scFv-GFP signal. 60 s was subtracted from all times to correct for the time required for harringtonine to enter the cell. (F and G) ScFv-GFP fluorescence intensity was measured over time after harringtonine addition (F, n = 3 independent experiments, 39 cells, 1883 mRNAs) (G, n = 3 independent experiments, 30 cells, 378 mRNAs). Scale bar, 2 μm.
Figure S3
Figure S3
Translation Dynamics of Single mRNA Molecules, Related to Figure 3 U2OS cells expressing scFv-GFP, PP7-2xmCherry-CAAX and the translation reporter (SunTag24x-Kif18b-PP724x) were imaged by time-lapse microscopy for 2 hr (A) or 1 hr (B) and the fluorescence intensity of single translation sites was tracked over time. 14 traces of untreated cells (A) or 6 traces of CHX treated cells (B) are shown. Note that the intensity of translation sites in CHX-treated cells slowly decreases over time, which is likely due to a decrease in the ribosome number per mRNA after prolonged CHX treatment.
Figure S4
Figure S4
Validation of the Ribosome Stalling Phenotype, Related to Figure 5 (A) U2OS cells expressing scFv-GFP, PP7-2xmCherry-CAAX and indicated translation reporters were treated with harringtonine at t = 0 and translation-site intensity was quantified over time. Reporter containing a codon optimized version of the U2AF2 coding sequence (n = 3 independent experiments, 29 cells, 512 mRNAs). (B) U2OS cells expressing the translation reporter (SunTag24x-Kif18b-PP724x) were treated with another translation initiation inhibitor (hippuristanol) and translation-site intensity was quantified over time (n = 2 independent experiments, 14 cells, 515 mRNAs). (C) U2OS cells expressing scFv-GFP, PP7-2xmCherry-CAAX and indicated translation reporters were treated with harringtonine at t = 0 and translation-site intensity was quantified over time. Harringtonine run-off experiments were also performed on a translation reporter lacking PP7 binding sites (SunTag24x-Kif18b) (n = 2 independent experiments, 19 cells, 248 mRNAs). (D) U2OS cells expressing scFv-GFP, PP7-2xmCherry-CAAX and indicated translation reporters were treated with harringtonine at t = 0 and translation-site intensity was quantified over time. Representative images in which stalled ribosome can be observed after harringtonine treatment (arrows). No ribosome stalling is observed after puromycin treatment (lower panel). (E) U2OS cells expressing scFv-GFP, PP7-2xmCherry-CAAX and indicated translation reporters were treated with harringtonine at t = 0 and translation-site intensity was quantified over time. At t = 0, either harringtonine (re-plotted from Figure 2D) or puromycin (n = 3 independent experiments, 22 cells, 403 mRNAs) was added and translation-site intensity was quantified over time. (F) U2OS cells expressing scFv-GFP, PP7-2xmCherry-CAAX and indicated translation reporters were treated with harringtonine at t = 0 and translation-site intensity was quantified over time. Sequential addition of harringtonine and then puromycin (n = 7 mRNAs). Scale bar, 5 μm.
Figure S5
Figure S5
Ribosome Elongation Rates on Emi1 5′UTR_Long Containing mRNAs, Related to Figure 6 U2OS cells expressing scFv-GFP, PP7-2xmCherry-CAAX and the Emi1 5′UTR_long translation reporter were treated with harringtonine at t = 0. The fluorescence intensity of very bright translation sites was quantified over time (n = 3 independent experiments, 29 cells, 39 mRNAs).
Figure S6
Figure S6
Single Ribosomes Translate the Emi1 5′UTR_Long mRNA, Related to Figure 7 U2OS cells expressing scFv-GFP, PP7-2xmCherry-CAAX and the Emi1 5′UTR_long translation reporter were imaged using a very short (30 ms) exposure time, so fully synthesized, freely diffusing mature SunTag-Kif18b molecules can be observed together with translation sites. Translation sites could be distinguished from fully synthesized SunTag molecules, as they co-migrated with mRNAs for multiple (> 5) consecutive time points. (A) Representative image of a single translation site (arrow) surrounded by multiple mature SunTag molecules. (B) Quantification of fluorescence intensities of translation sites and mature protein. The fluorescence intensity of a single translation sites was compared to the average fluorescence intensity of 5 nearby mature SunTag molecules.
Figure S7
Figure S7
Modeling of Translation-Site Intensity, Related to Experimental Procedures (A) Intensity from a single ribosome mainly depends on ribosome location on the mRNA. Due to the synthesis of SunTag peptides, ribosome intensity will increase initially as the ribosome moves toward the 3′ end until SunTag peptides are fully synthesized and exposed. A typical curve for intensity function f(x) is shown. For simplicity, a linear function was used to simulate the intensity increase. (B) Ribosome density changes during ribosome run-off. When there are no new initiation events, already bound ribosomes will runoff the mRNA from 5′ to 3′ end. Examples of the ribosome density function at t = 0 and t = t1 are shown. (C) Translation-site intensity is dependent on both intensity from single ribosomes as well as ribosome density throughout the mRNA. A formula describing translation-site intensity is shown on top. A typical curve of intensity change during ribosome run-off process is shown at the bottom with three clear stages labeled using numbers. Intensity decreases linearly during the second stage, whose first order derivative could be used to derive elongation rate. (D) Example results of simulations of harringtonine run-off from the Kif18b reporter (SunTag24x-Kif18b), which were run using different elongation rates (2, 3, 4, 5 codons/s). Run-off starts at t = 0.

Comment in

References

    1. Aakalu G., Smith W.B., Nguyen N., Jiang C., Schuman E.M. Dynamic visualization of local protein synthesis in hippocampal neurons. Neuron. 2001;30:489–502. - PubMed
    1. Babendure J.R., Babendure J.L., Ding J.H., Tsien R.Y. Control of mammalian translation by mRNA structure near caps. RNA. 2006;12:851–861. - PMC - PubMed
    1. Blanchard S.C. Single-molecule observations of ribosome function. Curr. Opin. Struct. Biol. 2009;19:103–109. - PMC - PubMed
    1. Bordeleau M.E., Mori A., Oberer M., Lindqvist L., Chard L.S., Higa T., Belsham G.J., Wagner G., Tanaka J., Pelletier J. Functional characterization of IRESes by an inhibitor of the RNA helicase eIF4A. Nat. Chem. Biol. 2006;2:213–220. - PubMed
    1. Brar G.A., Yassour M., Friedman N., Regev A., Ingolia N.T., Weissman J.S. High-resolution view of the yeast meiotic program revealed by ribosome profiling. Science. 2012;335:552–557. - PMC - PubMed

Publication types