. 2016 May 5;165(4):990-1001.
doi: 10.1016/j.cell.2016.04.040.

Real-Time Imaging of Translation on Single mRNA Transcripts in Live Cells

Affiliations

Real-Time Imaging of Translation on Single mRNA Transcripts in Live Cells

Chong Wang et al. Cell. .

Abstract

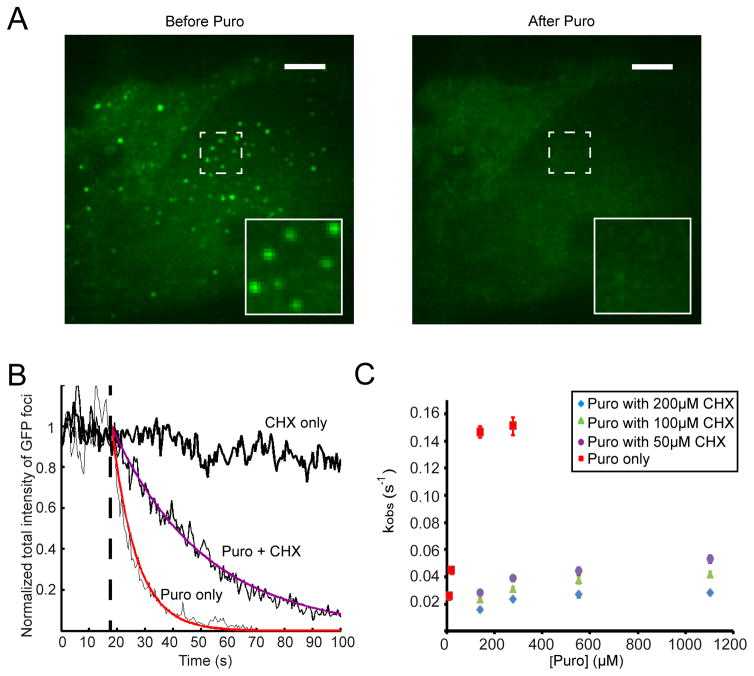
Translation is under tight spatial and temporal controls to ensure protein production in the right time and place in cells. Methods that allow real-time, high-resolution visualization of translation in live cells are essential for understanding the spatiotemporal dynamics of translation regulation. Based on multivalent fluorescence amplification of the nascent polypeptide signal, we develop a method to image translation on individual mRNA molecules in real time in live cells, allowing direct visualization of translation events at the translation sites. Using this approach, we monitor transient changes of translation dynamics in responses to environmental stresses, capture distinct mobilities of individual polysomes in different subcellular compartments, and detect 3' UTR-dependent local translation and active transport of polysomes in dendrites of primary neurons.


Figures

Figure 1
Figure 1. Visualization of translation on individual mRNA molecules in live HeLa cells
(A) Top: An mRNA construct map used for the detection of translation in live cells. Bottom: Scheme showing translation on an mRNA transcript (black) by multiple ribosomes (yellow). The tandem array of V4 peptides in the translation product are shown in orange, scFv-GFP molecules are shown in green, and tdPCP-tdTomato molecules are shown in magenta. Binding of scFv-GFP to the V4 peptide array allows detection of translation and binding of tdPCP-tdtomato to the PP7 hairpin array at the 3’UTR of the mRNA allows the detection of the mRNA. (B) Image of individual translation complexes (polysomes) labeled by GFP (left), image of individual mRNA molecules labeled by tdTomato (middle) and their overlay (right). Scale Bars: 5 μm. Insets: Enlarged view of the boxed region. Some mRNA (tdTomato) foci do not have colocalizing GFP signal because not all mRNA molecules are simultaneously translated. See also Figure S1
Figure 2
Figure 2. Probing translation sites with translation inhibitors
(A) Images of translation foci in the same field of view before and after treatment of 275 μM puromycin (Puro) at 37 °C. Insets show the zoom-in of the boxed region. Scale Bars: 5 μm. The full time course is shown in Movie S1. (B) Time courses of the normalized total intensities of the GFP foci in individual cells under different drug treatments. Thin black line: upon 275 μM Puro treatment. Thick black line: upon 200 μM Cycloheximide (CHX) treatment. Medium black line: upon 275 μM Puro treatment in the presence of 50 μM CHX. The curves are normalized to the average of the first 5 data points. Puro was added at the time indicated by the dashed line. The translation signal shows a decay after the Puro or Puro + CHX treatment. A single-exponential fit of the decay region for Puro treatment (red line) and for Puro + CHX treatment (purple line) gives the observed rate constant (kobs) of the foci disappearance after drug treatment. (C) Plot of kobs vs. [Puro] under conditions of Puro treatment only (red) or Puro treatment in the presence of three different concentrations of CHX (purple, green and blue). Error bars are S.E.M. (n = 5–10 cells for each condition, in each cell the number of polysomes before drug treatment is 30 -100) See also Figures S2, S3 and Movie S1.
Figure 3
Figure 3. Imaging translational responses to unfolded protein and oxidative stresses
(A) Images of translation foci in the same field of view before and after treatment of 1mM DTT at 37 °C. The full time course is shown in Movie S2. (B) and (C) Typical time courses of the translation activity measured in single cells in response to DTT treatment (B) and NaAsO2 treatment (C). Each cell contains 50–100 polysomes at time zero. The translational activity is measured as the total intensity of the translation foci in the cell normalized to the average value of the first 80s. (D) and (E) Averaged time courses of translation activity changes in response to DTT (D) and NaAsO2 (E) under different conditions. The curves are average over 20–30 cells each and the shades represent S.E.M. For each cell, the translation activity is normalized as described (B) and (C). Red lines are average time courses in response to DTT (1 mM ) or NaAsO2 (0.5 mM) treatment alone. Black, blue, magenta lines are average DTT or NaAsO2 time courses in the presence of translation inhibitor CHX (200 μM), kinase inhibitor GSK2606414 (1 μM), and integrated stress response inhibitor ISRIB (400 nM), respectively. See also Figure S4 and Movie S2.
Figure 4
Figure 4. Transient up-regulation of translation for construct harboring ATF4 uORFs in responses to unfolded protein and oxidative stresses
(A) The translation reporter construct regulated by ATF4 uORFs. The construct contains two upstream open reading frames (uORF1 and uORF2) before the open reading frame 3 (ORF3). The stop codon of uORF2 located downstream of the start codon of ORF3 is frame-shifted from ORF3 and thus does not affect translation the V4 peptide array and ODC contained in ORF3. (B) and (D) Snapshots of the translation activity of the ATF4 reporter construct in a cell under DTT-induced stress (B) or NaAsO2-induced stress (D) at indicated time points. The full time course of the cell shown in (B) is shown in Movie S3. Scale Bars: 5 μm. (C) and (E) Corresponding time course of the translation activity of the cell shown in (B) and (D), respectively. The translational activity is measured as the total intensity of the translation foci in the cell normalized to the initial value (average of the first 80s). 20–30 cells were measured for each treatment (NaAsO2 or DTT), and the ensemble-averaged time courses are shown in Figure S5. See also Figure S5 and Movie S3.
Figure 5
Figure 5. Tracking the movements of individual polysomes in live cells
(A) Left panel: A single snapshot of individual polysomes in a region of a cell. Three specific foci are marked and their time trajectories are shown on the right. Scale bar: 5 μm. Right panels: mobility analysis of the three marked polysomes in the left image. The top panels show movement trajectories of polysomes. Scale bars: 320 nm. The bottom panels show mean squared displacement (MSD) vs. time for the corresponding polysomes. Polysomes 1, 2 and 3 are representative examples of stationary, sub-diffusive and diffusive movement, respectively. (B) and (C) Distributions of MSD of individual polysomes for the indicated constructs. The MSD value is determined at the 0.5 s time delay. The two histograms in (B) are for cytosolic proteins and the two in (C) are for a secreted protein (sBFP, upper) and a transmembrane protein (SMOTM, lower). A P2A sequence that undergoes co-translational cleavage is inserted between the sBFP or SMOTM coding region and the V4 peptide array to avoid i) secretion of the V4 peptide array facilitated by sBFP, which prevents binding of scFv-GFP and ii) detection of the fully translated SMOTM-V4 protein products, which would also be anchored to ER and thus not rapidly diffusing. Although cleavage at P2A prevents observation of the protein products, in a polysome where multiple ribosomes are translating the mRNA simultaneously, the ribosomes that are translating the sBFP/SMOTM portion can mediate anchorage to ER, while other ribosomes that are translating the V4 peptide array portion allow visualization of the polysome through scFv-GFP binding. The observed fluorescent foci disappear after Puro treatment (Figure S6A, B), confirming their identity as translating polysomes. As a control, P2A is also inserted between the cytosolic BFP and the V4 peptide array (B, lower panel). For each construct, 40–50 cells are analyzed. See also Figure S6
Figure 6
Figure 6. Polysomes translating cytosolic proteins display a lower mobility in the perinuclear region
(A) Trajectories of polysomes of the cytosolic protein construct in a typical cell. The movies showing the movement of these polysomes are shown in Movie S4. The contour of the nucleus is shown by red dashed line. The trajectories are color-coded according to their mobility values, quantified by MSD at the 0.5 s time delay, with higher mobility shown in red and lower mobility shown in blue. Scale bar, 5 μm. (B) Distributions of the MSD values at 0.5 s time delay for polysomes in the perinuclear region (magenta) and for polysomes not in the perinuclear region (blue). See supplemental experimental procedures for the operational definition of perinuclear and non-perinuclear regions. (C) Average diffusion coefficients of perinuclear polysomes (left) and non-perinuclear polysomes (right). P-value is calculated from unpaired t test (n = 40 cells). See also Movie S4.
Figure 7
Figure 7. Imaging local translation in the dendrites of live hippocampal neurons
(A) Individual fluorescence loci observed inside neurons disappear after Puro treatment, confirming their identity as translating polysomes. The construct without the Arc 3’UTR is used here. (B) Translating polysomes observed in a dendrite (corresponding to the boxed region of the neuron image in the inset) using the construct with the Arc 3’UTR. (C) Average number of translation foci observed in 10 μm segments of dendrites at varying distance from the cell body using constructs with (blue) and without (red) the Arc 3’UTR. Error bars represent S.E.M. (n = 26 cells for construct with the Arc 3’UTR, n = 21 cells for construct without the Arc 3’UTR). (D) (Left two panels) Image snapshots of a dendritic region showing a polysome undergoing directed movement (indicated by arrow). (Right panel) Kymograph of the boxed region in the left showing the directed movement of the arrow-indicated polysome. The full time course of the movement of this polysome is shown in Movie S5. (E) Histogram of the movement speeds of 41 polysomes showing directed movement. The neurons used in this figure are in DIV 14–16. Scale bar: 5μm for (A), (B) and (D). See also Movie S5.

Comment in

References

    1. Aakalu G, Smith WB, Nguyen N, Jiang C, Schuman EM. Dynamic visualization of local protein synthesis in hippocampal neurons. Neuron. 2001;30:489–502. - PubMed
    1. Andreev DE, O'Connor PB, Fahey C, Kenny EM, Terenin IM, Dmitriev SE, Cormican P, Morris DW, Shatsky IN, Baranov PV. Translation of 5' leaders is pervasive in genes resistant to eIF2 repression. eLife. 2015;4:e03971. - PMC - PubMed
    1. Arava Y, Wang Y, Storey JD, Liu CL, Brown PO, Herschlag D. Genome-wide analysis of mRNA translation profiles in Saccharomyces cerevisiae. Proceedings of the National Academy of Sciences of the United States of America. 2003;100:3889–3894. - PMC - PubMed
    1. Axten JM, Medina JR, Feng Y, Shu A, Romeril SP, Grant SW, Li WH, Heerding DA, Minthorn E, Mencken T, et al. Discovery of 7-methyl-5-(1-{[3-(trifluoromethyl)phenyl]acetyl}-2,3-dihydro-1H-indol-5-yl)-7H-p yrrolo[2,3-d]pyrimidin-4-amine (GSK2606414), a potent and selective first-in-class inhibitor of protein kinase R (PKR)-like endoplasmic reticulum kinase (PERK) Journal of medicinal chemistry. 2012;55:7193–7207. - PubMed
    1. Bates M, Huang B, Dempsey GT, Zhuang X. Multicolor super-resolution imaging with photo-switchable fluorescent probes. Science. 2007;317:1749–1753. - PMC - PubMed

Publication types

Substances