. 2016 Jul 15;32(14):2089-95.
doi: 10.1093/bioinformatics/btw069. Epub 2016 Mar 16.

Integrated genome browser: visual analytics platform for genomics

Affiliations

Integrated genome browser: visual analytics platform for genomics

Nowlan H Freese et al. Bioinformatics. .

Abstract

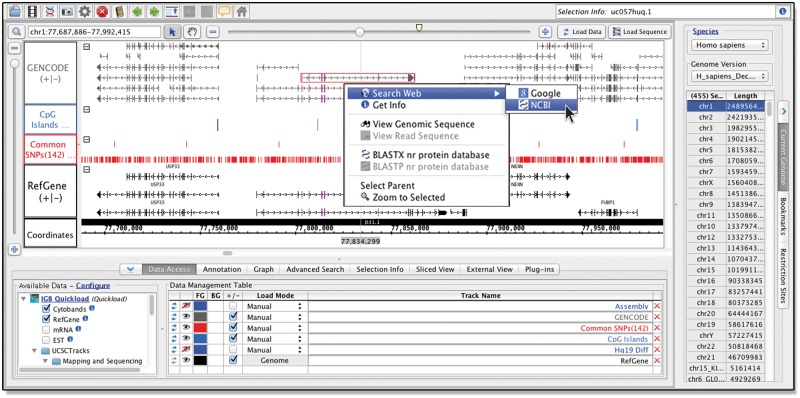
Motivation: Genome browsers that support fast navigation through vast datasets and provide interactive visual analytics functions can help scientists achieve deeper insight into biological systems. Toward this end, we developed Integrated Genome Browser (IGB), a highly configurable, interactive and fast open source desktop genome browser.

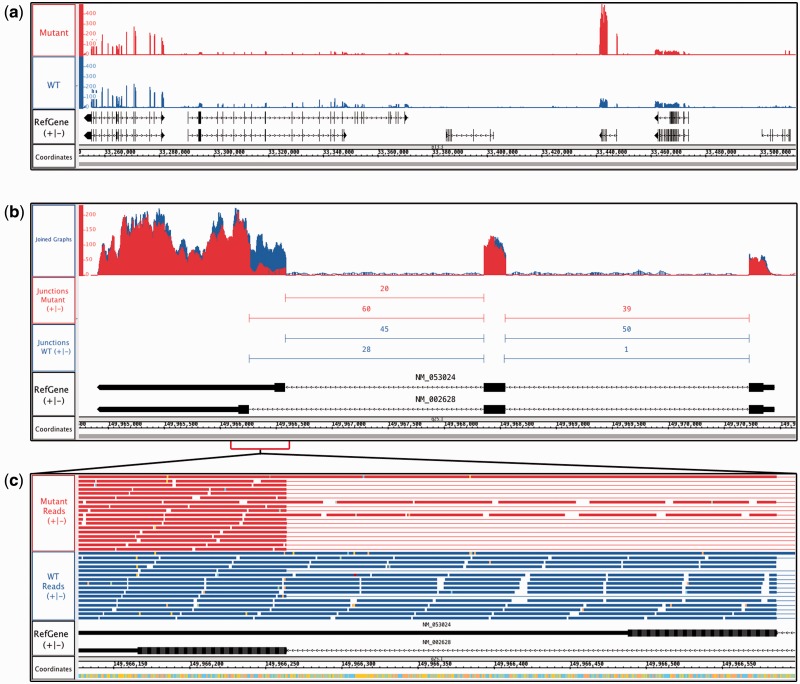
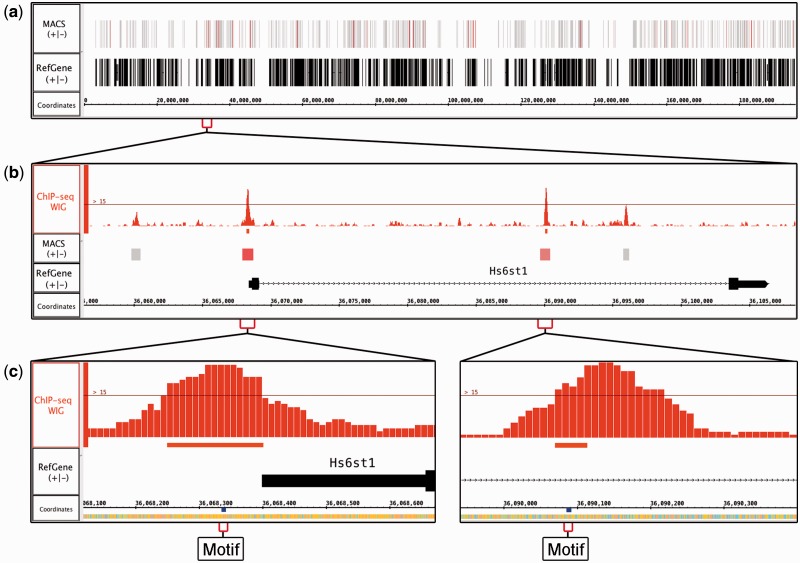
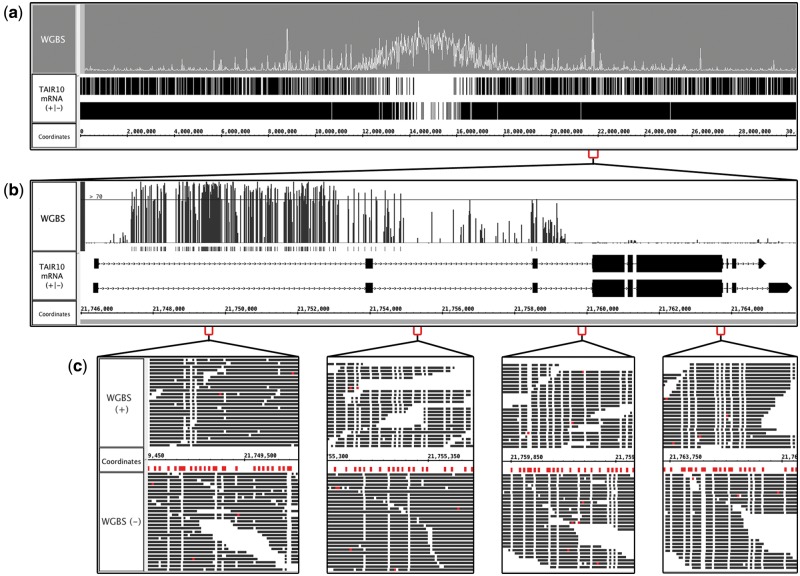
Results: Here we describe multiple updates to IGB, including all-new capabilities to display and interact with data from high-throughput sequencing experiments. To demonstrate, we describe example visualizations and analyses of datasets from RNA-Seq, ChIP-Seq and bisulfite sequencing experiments. Understanding results from genome-scale experiments requires viewing the data in the context of reference genome annotations and other related datasets. To facilitate this, we enhanced IGB's ability to consume data from diverse sources, including Galaxy, Distributed Annotation and IGB-specific Quickload servers. To support future visualization needs as new genome-scale assays enter wide use, we transformed the IGB codebase into a modular, extensible platform for developers to create and deploy all-new visualizations of genomic data.

Availability and implementation: IGB is open source and is freely available from http://bioviz.org/igb

Contact: aloraine@uncc.edu.


Figures

Fig. 1.
Fig. 1.
Viewing multiple human genome datasets in IGB. IGB screen showing human genome build 38, released in December 2013. Gene annotations load by default, with additional, data available in the section labeled Available Data (lower left). Each dataset occupies a separate track within the main window, and can be colored according to user preference. Right-clicking items in the main window activates a context menu with options to search Google, run BLAST or view the underlying genomic sequence
Fig. 2.
Fig. 2.
RNA-Seq data from human lung adenocarcinomas bearing mutant or wild-type (WT) alleles of the KRAS oncogene. (a) Coverage depth graphs show transcript abundance across a 250 kb region. Mutant samples contain a peak indicating higher expression in the mutant sample. (b) Overlaid depth graphs showing a discontinuity in coverage indicating differential splicing in PFN2. Quantification of split reads by FindJunctions further supports differential splicing. (c) Zoomed in view of (b), showing aligned reads
Fig. 3.
Fig. 3.
Visualizing ChIP-Seq data. (a) MACS BED file with peak regions from mouse ChIP-Seq data investigating binding sites for transcription factor SOX9. Peak regions in the track labeled ‘MACS’ are colored by score, making the higher-scoring regions more noticeable. (b) Zoomed in view of (a). MACS identified four significant peaks, of which two exceeded a user-defined coverage threshold, visible as a thin horizontal line in the ChIP-Seq WIG track (top). (c) Zoomed in view of (b). Searching for the motif AGCCGYG identified sites under the most significant peaks in (b)
Fig. 4.
Fig. 4.
Visualizing bisulfite sequencing data. (a) Bismark output file from an Arabidopsis bisulfite sequence experiment. Peaks indicate regions containing many methylated cytosine residues. (b) Zoomed in view of (a). A user-defined threshold shows that most cytosines in the first intron are methylated. (c) Zoomed in view of (b), showing the positive and negative strand aligned reads. Thymines are colored white, and cytosines red. Unmethylated cytosines that were converted to thymines appear as white columns occupying the same base pair position as a mark below the sequence axis, which indicate cytosines in the reference sequence. The highly-methylated region on the left contains many marks and few white columns

References

    1. Bederson B.B, Boltman A. (1999) Does animation help users build mental maps of spatial information? In: Information Visualization. (Info Vis '99) Proceedings. IEEE Symposium, pp. 28–35.
    1. Céol A., Müller H. (2015) The MI bundle: enabling network and structural biology in genome visualization tools. Bioinformatics, 31, 3679–3681. - PMC - PubMed
    1. Cockburn A. et al. (2009) A review of overview+detail, zooming, and focus+context interfaces. ACM Comput. Surv., 41, 1–31.
    1. Durbin R, Thierry-Mieg J. (1991) A C. elegans database. In: Documentation, code and data available from anonymous FTP servers at lirmm.lirmm.fr, cele.mrc-lmb.cam.ac.uk and ncbi.nlm.nih.gov.
    1. Fielding R.T., Taylor R.N. (2002) Principled design of the modern Web architecture. ACM Trans. Internet Technol., 2, 115–150.