. 2016 Dec;27(12):3690-3705.
doi: 10.1681/ASN.2015091014. Epub 2016 May 6.

Stat3 Controls Tubulointerstitial Communication during CKD

Affiliations

Stat3 Controls Tubulointerstitial Communication during CKD

Frank Bienaimé et al. J Am Soc Nephrol. 2016 Dec.

Abstract

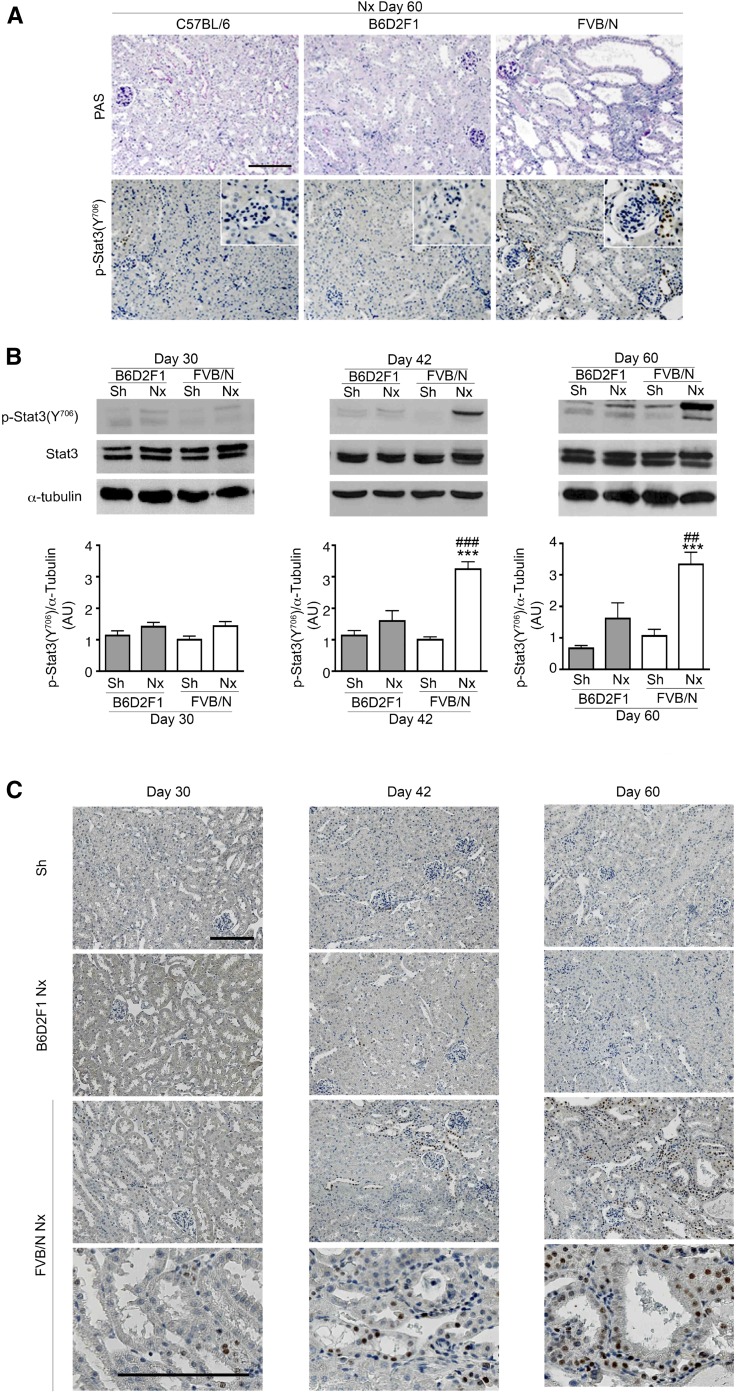
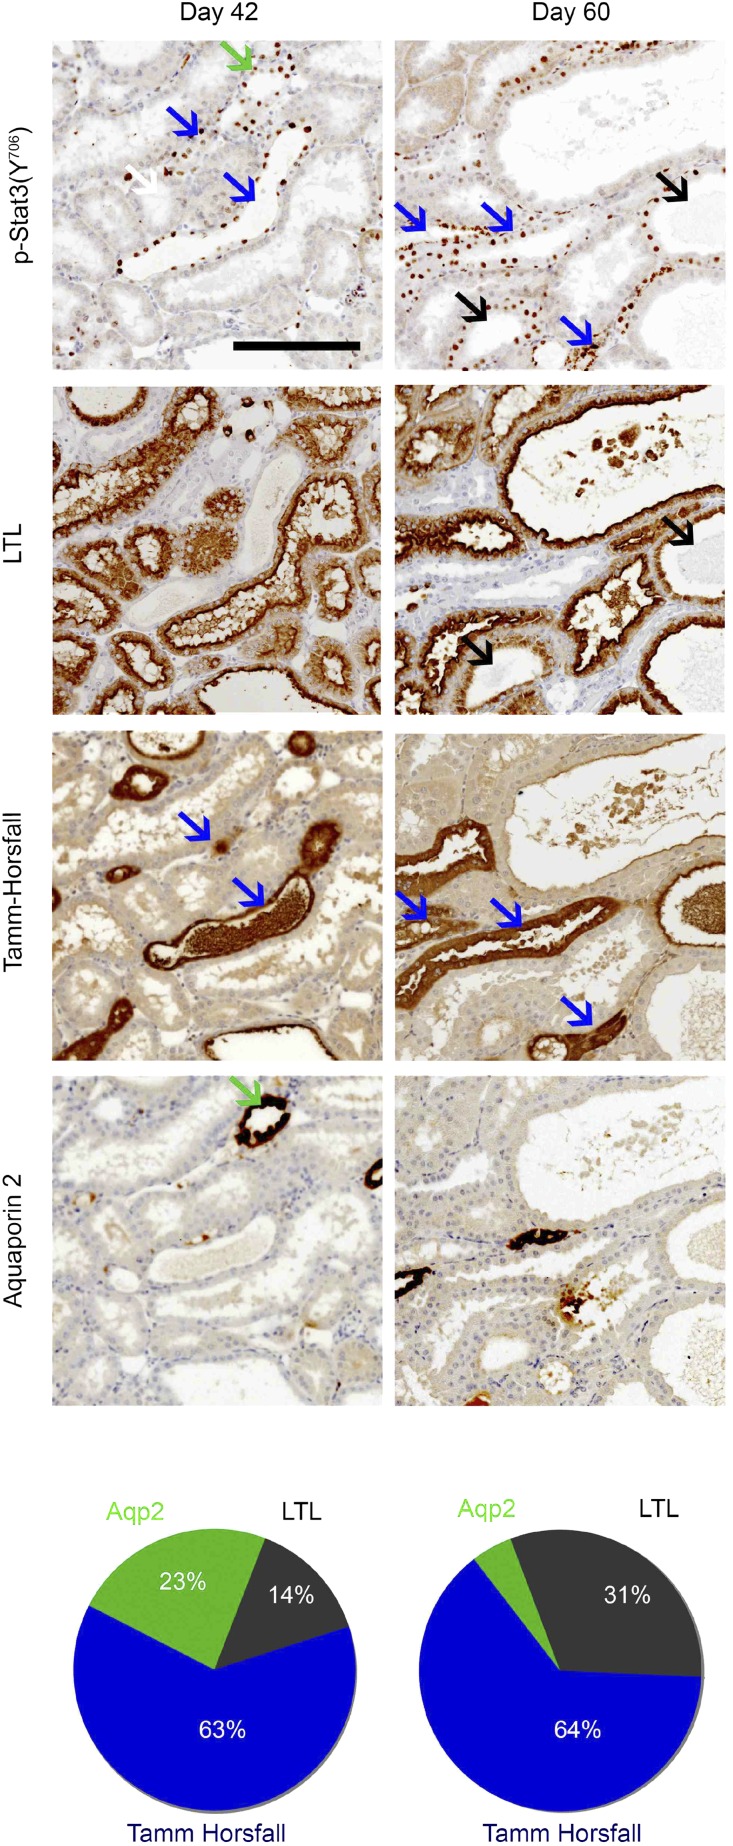
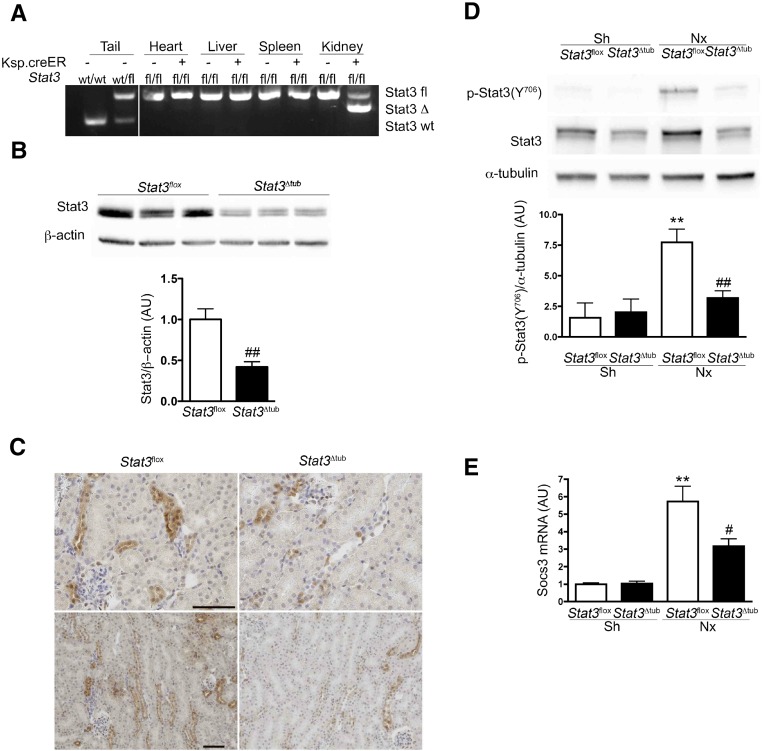
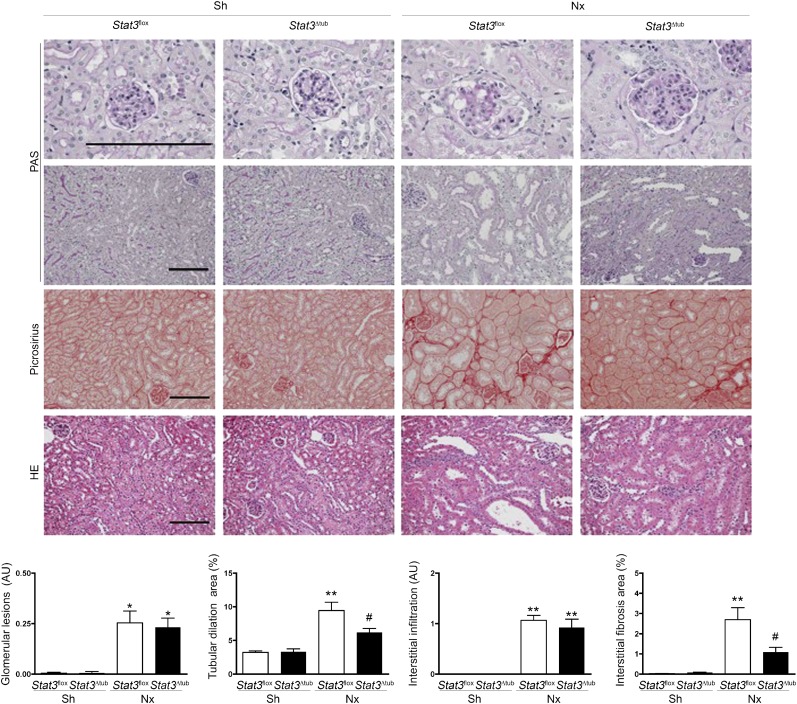
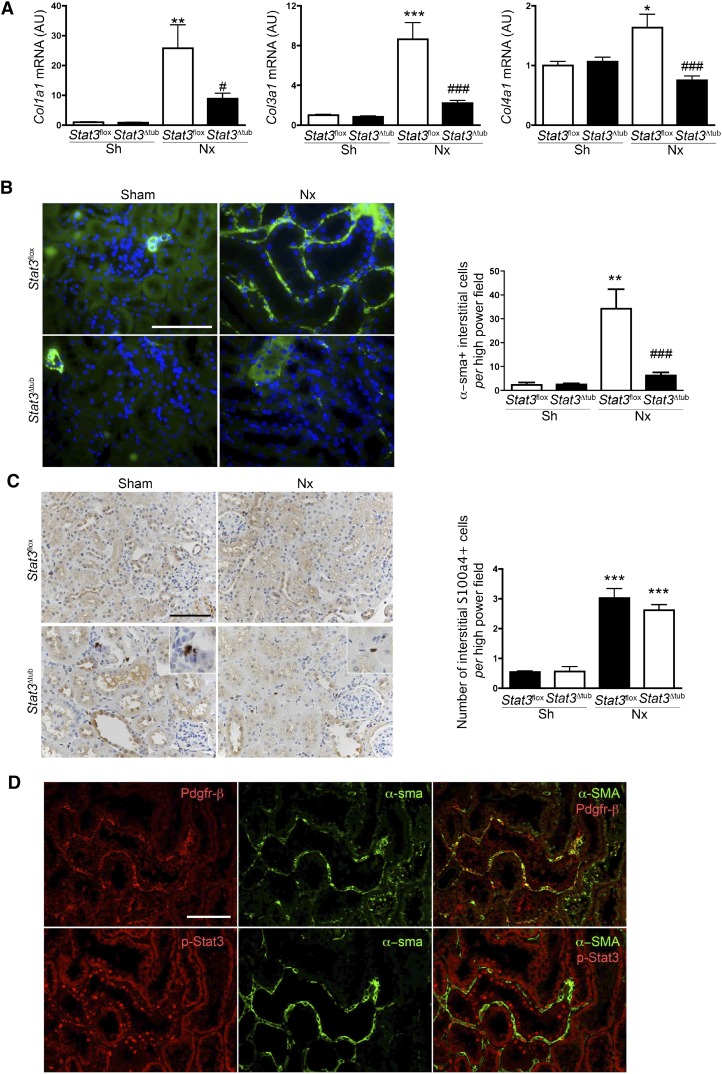
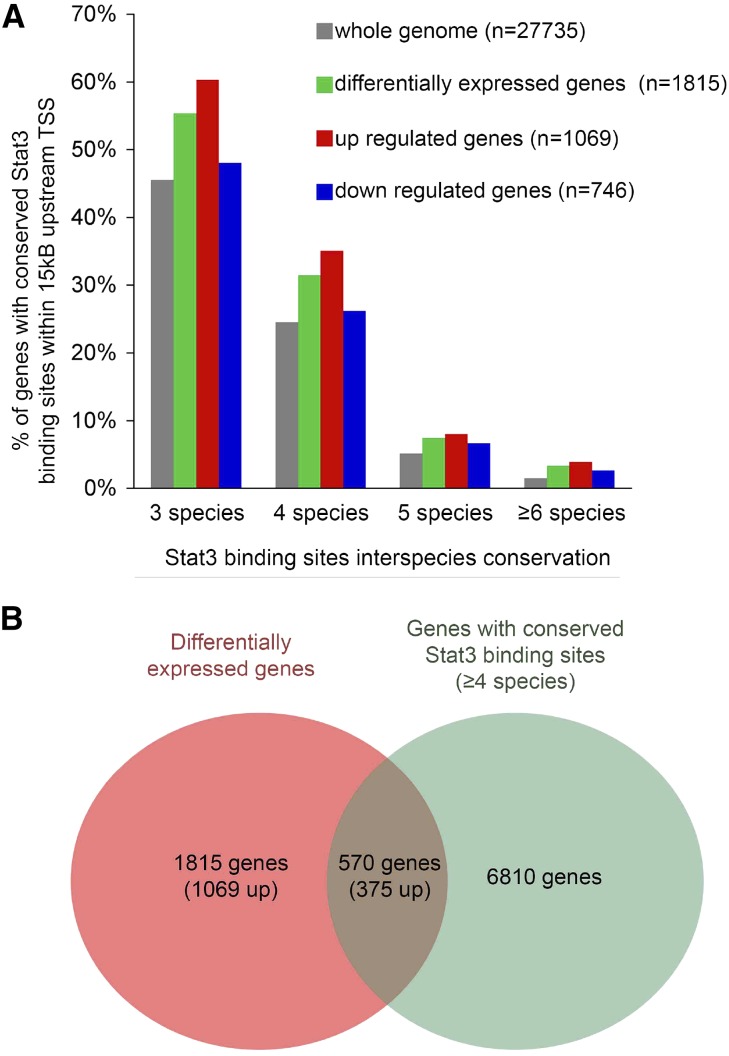
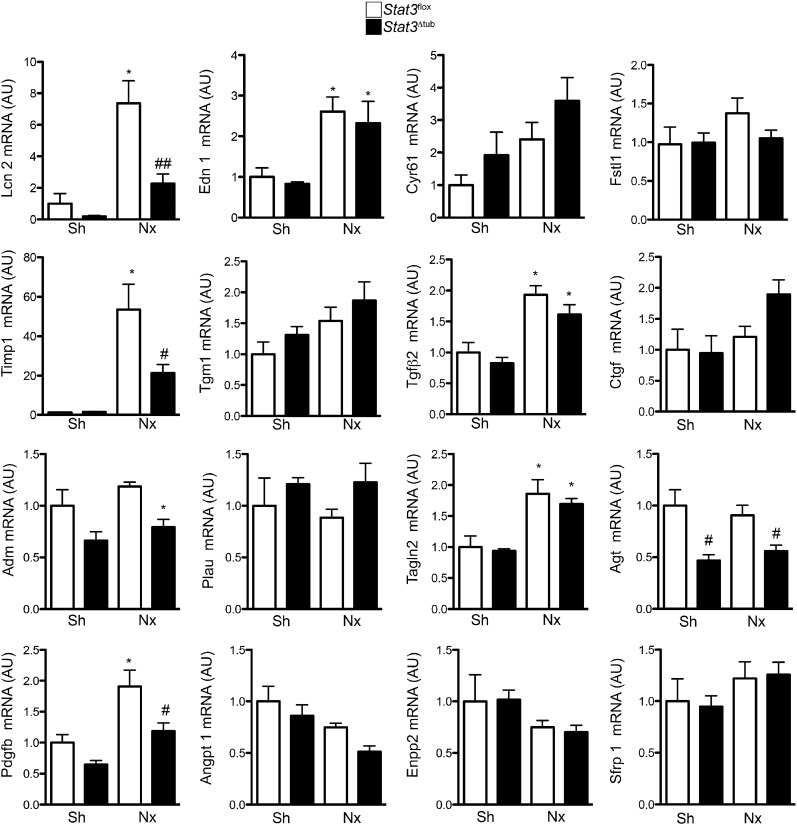
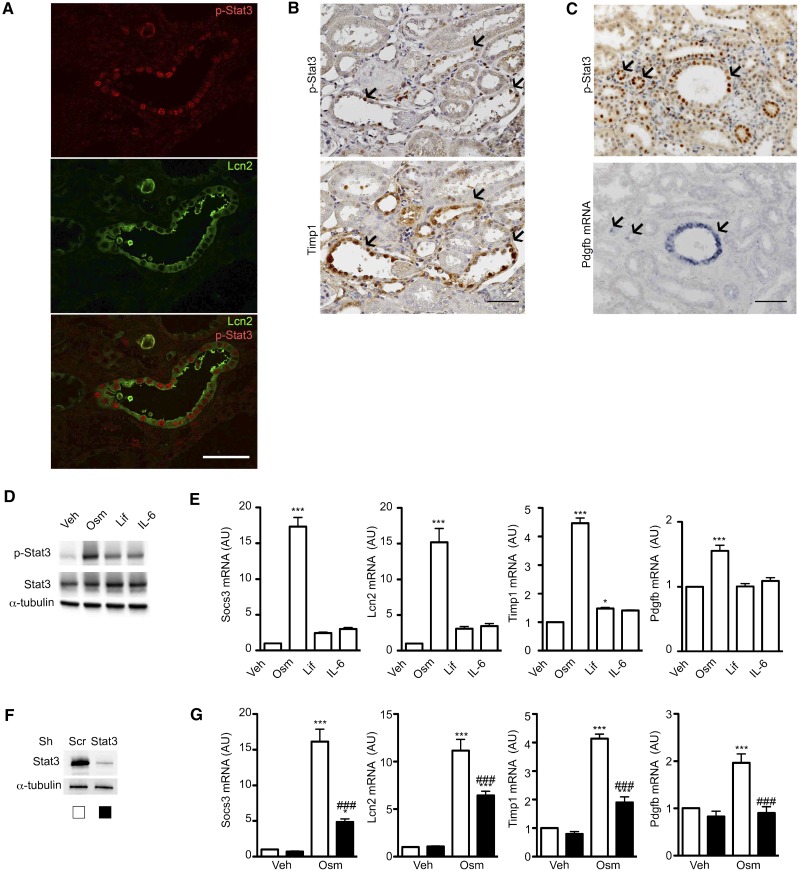
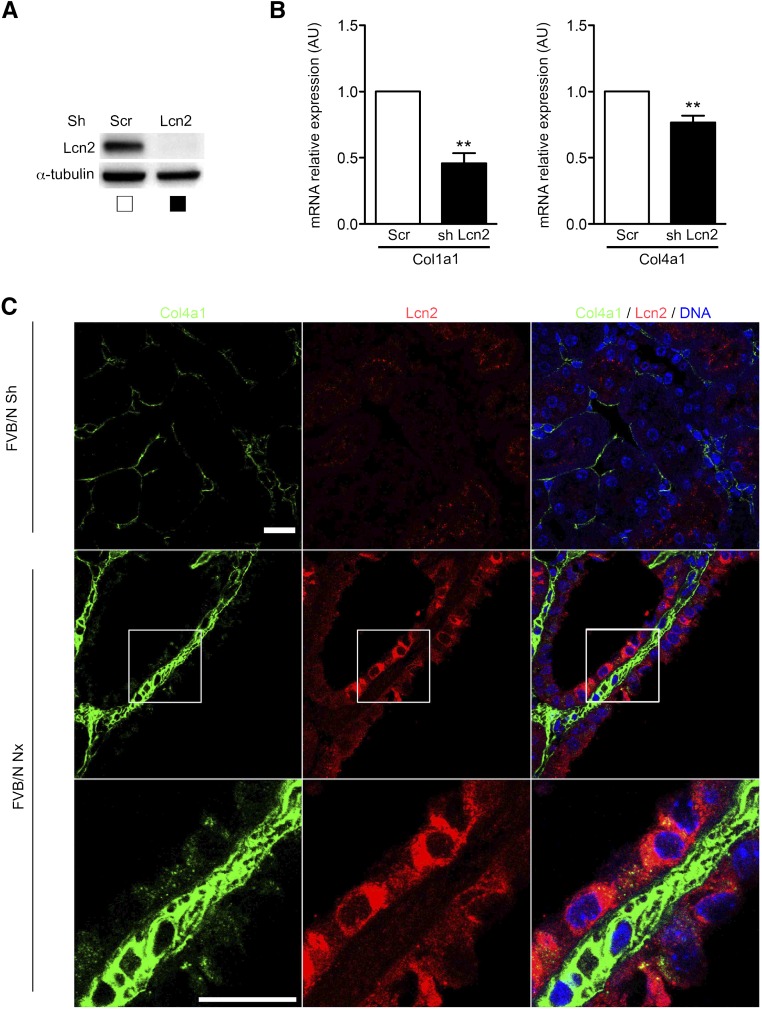
In CKD, tubular cells may be involved in the induction of interstitial fibrosis, which in turn, leads to loss of renal function. However, the molecular mechanisms that link tubular cells to the interstitial compartment are not clear. Activation of the Stat3 transcription factor has been reported in tubular cells after renal damage, and Stat3 has been implicated in CKD progression. Here, we combined an experimental model of nephron reduction in mice from different genetic backgrounds and genetically modified animals with in silico and in vitro experiments to determine whether the selective activation of Stat3 in tubular cells is involved in the development of interstitial fibrosis. Nephron reduction caused Stat3 phosphorylation in tubular cells of lesion-prone mice but not in resistant mice. Furthermore, specific deletion of Stat3 in tubular cells significantly reduced the extent of interstitial fibrosis, which correlated with reduced fibroblast proliferation and matrix synthesis, after nephron reduction. Mechanistically, in vitro tubular Stat3 activation triggered the expression of a specific subset of paracrine profibrotic factors, including Lcn2, Pdgfb, and Timp1. Together, our results provide a molecular link between tubular and interstitial cells during CKD progression and identify Stat3 as a central regulator of this link and a promising therapeutic target.

Keywords: Cell Signaling; Pathophysiology of Renal Disease and Progression; chronic kidney disease; renal fibrosis; renal tubular epithelial cells; transcriptional profiling.


Figures

Figure 1.
Figure 1.
Stat3 activation after nephron reduction in kidneys from lesion-resistant and lesion-prone mice. (A) Periodic acid–Schiff (PAS) staining of remnant kidneys from C57BL/6, B6D2F1, and FVB/N mice 60 days after 75% Nx (upper panel). Representative p-Stat3 (Y706) immunostaining in the same animals (lower panel). Scale bar, 100 μm (n=6 per group). (B) Western blot of Stat3 (Y706) phosphorylation of whole-kidney lysates of Sh and 75% Nx B6D2F1 and FVB/N mice 30 (n=6 in each group), 42 (n=5 in each group), and 60 days (n=6 in each group) after surgery. Data are means±SEMs. ANOVA was followed by the Tukey–Kramer test. Sh versus Nx mice: ***P<0.001. B6D2F1 versus FVB/N mice: ##P<0.01; ###P<0.001. (C) Representative p-Stat3 (Y706) immunostaining of kidneys from the same animals. Because kidneys from Sh B6D2F1 and Sh FVB/N mice were indistinguishable, only a single Sh control is shown. These are representative images of at least five mice in each group. Scale bar, 100 μm.
Figure 2.
Figure 2.
Localization of Stat3 activation during renal lesion development. Representative coimmunostaining experiments and quantification of p-Stat3 (Y706) and specific tubular markers, Tamm–Horsfall (ascending loop of Henle and the distal convoluted tubule; blue arrows), Lotus Tetragonolobus Lectin (LTL; proximal tubules; black arrows), and aquaporin 2 (collecting tubule; green arrows) in FVB/N remnant kidneys 42 and 60 days after 75% subtotal Nx (n=3 in each group; upper panel). Scale bar, 100 μm. Quantification of the percentage of p-Stat3–positive tubules marked with each of the markers (lower panel).
Figure 3.
Figure 3.
Conditional inducible deletion of Stat3 in renal tubules of adult mice. (A) Detection of Stat3 wild–type (wt), floxed (fl), and deleted (Δ) alleles on genomic DNA from the indicated tissue of wt, Stat3fl/+, Stat3fl/fl (Stat3fl), and Stat3fl/fl Ksp.creERT2 (Stat3Δtub) mice 2 weeks after tamoxifen treatment. (B and C) Analysis of renal Stat3 expression by (B) Western blot and (C) immunohistochemistry in Stat3fl (n=3) and Stat3Δtub (n=4) mice 2 weeks after tamoxifen treatment. (D and E) Western blot analysis and quantification of (D) Stat3 (Y706) phosphorylation and (E) Socs3 mRNA expression in Sh Stat3fl (n=3), Sh Stat3Δtub (n=4), 75% Nx Stat3fl (n=9), and Nx Stat3Δtub (n=10) mice 90 days after surgery. Data are means±SEMs; (B) t test or (D and E) ANOVA was followed by the Tukey–Kramer test. Scale bar, 50 μm. Sh versus Nx mice: **P<0.01. Stat3fl versus Stat3Δtub mice: #P<0.05; ##P<0.01.
Figure 4.
Figure 4.
Tubular Stat3 inactivation reduces tubulointerstitial lesions after nephron reduction. Morphology and lesion scores of kidneys from Sh Stat3flox (n=3) and Stat3Δtub (n=4) mice and 75% Nx Stat3flox (n=9) and Stat3Δtub (n=13) mice 90 days after surgery. Data are means±SEMs. ANOVA followed by Tukey–Kramer test. HE, Hematoxylin Eosin; PAS, Periodic acid–Schiff. Scale bar, 100 μm. Sh versus Nx mice: *P<0.05; **P<0.01. Stat3flox versus Stat3Δtub mice: #P<0.05.
Figure 5.
Figure 5.
Tubular Stat3 inactivation reduces interstitial collagen content and α-sma+ fibroblasts density after nephron reduction. (A) Quantitative RT-PCR of renal collagen mRNA content in kidneys from Sh Stat3flox (n=3) and Stat3Δtub (n=4) mice and 75% Nx Stat3flox (n=9) and Stat3Δtub (n=13) mice 90 days after surgery. (B) Representative α-sma immunostaining and quantification of α−sma+ cell density in Sh Stat3flox (n=3) and Stat3Δtub (n=4) mice and 75% Nx Stat3flox (n=9) and Stat3Δtub (n=13) mice 90 days after surgery. (C) Representative S100a4 immunostaining and quantification of S100a4+ cell density of the same animals. (D) Representative colocalization between Pdgfr-β and α-sma (upper panel) and p-Stat3 (Y706) and α-sma (lower panel) on serial sections of remnant kidneys of FVB/N mice 60 days after Nx. Data are means±SEMs. ANOVA was followed by the Tukey–Kramer test. Scale bar, 50 μm. Sh versus Nx mice: *P<0.05; **P<0.01; ***P<0.001. Stat3flox versus Stat3Δtub mice: #P<0.05; ###P<0.001.
Figure 6.
Figure 6.
Potential Stat3 target genes during renal lesion development. (A) Comparison of the frequency of predicted Stat3 binding sites in whole-mouse genome (gray) and the genes differentially expressed by C57BL/6 (n=4) and FVB/N (n=4) remnant kidneys 60 days after 75% Nx. The green bars show all of the differentially expressed genes (either up- or downregulated in FVB/N mice compared with C57BL/6 animals), whereas the red and blue bars concern only the genes up- and downregulated, respectively, in FVB/N compared with C57BL/6 mice. (B) Schematic representation of the intersection between the genes with Stat3 binding sites conserved at least in four species and the genes differentially expressed between C57BL/6 and FVB/N remnant kidneys 60 days after Nx.
Figure 7.
Figure 7.
Tubular Stat3 inactivation affects the expression of specific paracrine fibrogenic factors after nephron reduction. Quantitative RT-PCR of the 16 potential paracrine profibrotic Stat3 targets in Sh Stat3flox (n=3) and Stat3Δtub (n=4) mice and 75% Nx Stat3flox (n=9) and Stat3Δtub (n=13) mice 90 days after surgery. All relative expressions are normalized to Rpl13. Data are means±SEMs. ANOVA was followed by Tukey–Kramer test. Sh versus Nx mice: *P<0.05. Stat3flox versus Stat3Δtub mice: #P<0.05.
Figure 8.
Figure 8.
Stat3 regulates the expression of Lcn2, Timp1, and Pdgfb in renal tubular cells. (A) Colocalization between p-Stat3 (Y706) and Lcn2 in the remnant kidney of FVB/N mice 60 days after 75% Nx. Scale bar, 50 μm. (B) Immunostaining of p-Stat3 (Y706; upper panel) and Timp1 (lower panel) on serial kidney sections from FVB/N mice 60 days after Nx. Scale bar, 100 μm. (C) Immunostaining of p-Stat3 (Y706; upper panel) and in situ hybridization of Pdgfb mRNA (lower panel) on kidney serial sections from FVB/N mice 60 days after Nx. Scale bar, 100 μm. (D and E) Western blot of (D) Stat3 (Y706) phosphorylation and (E) quantitative RT-PCR of Socs3, Lcn2, Timp1, and Pdgfb mRNA from mIMCD3 cells treated with Osm, Leukemia-inhibiting factor (Lif), IL-6, or vehicle (Veh). (F) Western blot of Stat3 from mIMCD-3 transduced with a short hairpin RNA targeting Stat3 or a scramble control (Scr). (G) Quantitative RT-PCR of Socs3, Lcn2, Timp1, and Pdgfb mRNA expression in mIMCD-3 cells transducted with a short hairpin RNA targeting Stat3 or an Scr and treated with Osm or Veh. All relative expression are normalized to Rpl13. Data are means±SEMs. ANOVA was followed by the Tukey–Kramer test. Veh versus Osm-, Lif-, or IL-6–treated cells: *P<0.05; ***P<0.001. Cells transduced with an Stat3 Sh RNA versus an Scr Sh RNA: ###P<0.001.
Figure 9.
Figure 9.
Lcn2 promotes collagen expression in renal tubular cells. (A) Western blot analysis of Lcn2 expression in mIMCD-3 cells transduced with either a short hairpin RNA targeting Lcn2 or a scramble control (Scr). (B) Quantitative RT-PCR of Col1a1 and Col4a1 mRNA expression in mIMCD-3 cells transduced with either a short hairpin RNA targeting Lcn2 or an Scr. Data are means±SEMs. Paired t test. **P<0.01. (C) Representative confocal images of kidney sections from Sh (n=4) or 75% Nx (n=6) FVB/N mice 60 days after surgery stained with Lcn2 and Col4a1 chain–specific antibodies. Scale bar, 20 μm.

Comment in

References

    1. Zhang QL, Rothenbacher D: Prevalence of chronic kidney disease in population-based studies: Systematic review. BMC Public Health 8: 117, 2008 - PMC - PubMed
    1. Go AS, Chertow GM, Fan D, McCulloch CE, Hsu CY: Chronic kidney disease and the risks of death, cardiovascular events, and hospitalization. N Engl J Med 351: 1296–1305, 2004 - PubMed
    1. Wen CP, Cheng TY, Tsai MK, Chang YC, Chan HT, Tsai SP, Chiang PH, Hsu CC, Sung PK, Hsu YH, Wen SF: All-cause mortality attributable to chronic kidney disease: A prospective cohort study based on 462 293 adults in Taiwan. Lancet 371: 2173–2182, 2008 - PubMed
    1. Risdon RA, Sloper JC, De Wardener HE: Relationship between renal function and histological changes found in renal-biopsy specimens from patients with persistent glomerular nephritis. Lancet 2: 363–366, 1968 - PubMed
    1. Coppo R, D’Amico G: Factors predicting progression of IgA nephropathies. J Nephrol 18: 503–512, 2005 - PubMed

Substances