. 2016 Jul;6(7):770-83.
doi: 10.1158/2159-8290.CD-16-0058. Epub 2016 May 6.

ASH1L Links Histone H3 Lysine 36 Dimethylation to MLL Leukemia

Affiliations

ASH1L Links Histone H3 Lysine 36 Dimethylation to MLL Leukemia

Li Zhu et al. Cancer Discov. 2016 Jul.

Abstract

Numerous studies in multiple systems support that histone H3 lysine 36 dimethylation (H3K36me2) is associated with transcriptional activation; however, the underlying mechanisms are not well defined. Here, we show that the H3K36me2 chromatin mark written by the ASH1L histone methyltransferase is preferentially bound in vivo by LEDGF, a mixed-lineage leukemia (MLL)-associated protein that colocalizes with MLL, ASH1L, and H3K36me2 on chromatin genome wide. Furthermore, ASH1L facilitates recruitment of LEDGF and wild-type MLL proteins to chromatin at key leukemia target genes and is a crucial regulator of MLL-dependent transcription and leukemic transformation. Conversely, KDM2A, an H3K36me2 demethylase and Polycomb group silencing protein, antagonizes MLL-associated leukemogenesis. Our studies are the first to provide a basic mechanistic insight into epigenetic interactions wherein placement, interpretation, and removal of H3K36me2 contribute to the regulation of gene expression and MLL leukemia, and suggest ASH1L as a novel target for therapeutic intervention.

Significance: Epigenetic regulators play vital roles in cancer pathogenesis and represent a new frontier in therapeutic targeting. Our studies provide basic mechanistic insight into the role of H3K36me2 in transcription activation and MLL leukemia pathogenesis and implicate ASH1L histone methyltransferase as a promising target for novel molecular therapy. Cancer Discov; 6(7); 770-83. ©2016 AACR.See related commentary by Balbach and Orkin, p. 700This article is highlighted in the In This Issue feature, p. 681.


Conflict of interest statement

Conflict of interest: The authors have no conflicts of interest to declare.

Figures

Figure 1
Figure 1. Nucleosome-specific H3K36me2 recognition by LEDGF
(A) The PWWP domain of LEDGF recognizes H3K36me2/3 peptide. Superimposed 1H,15N HSQC spectra of 0.1 mM PWWP collected in the absence (black) and presence (red) of the indicated histone peptides. The protein-peptide ratio is 1:10. (B) The ability of WT LEDGF or PWWP domain mutants to bind nucleosomes purified from Hela cells was assessed by western blot analysis for histone H3 in a GST pull-down assay. (C) Western blot analysis for histone H3 was performed on a GST-LEDGF pull down assay of nucleosomes isolated from various wildtype and mutant S. cerevisiae strains (indicated at top). Input nucleosomes are shown in lower panel. The detail information for yeast strains can be found in Table S1. (D) THP-1 cells expressing Flag-tagged LEDGF (WT or W21A mutant) were subjected to protein-protein ChIP. Chromatin pulled-down with anti-Flag antibody was analyzed by western blot using antibodies indicated on the left.
Figure 2
Figure 2. LEDGF regulates MLL occupancy at target genes
(A) A ChIP-seq density heat map representation of promoter region occupancies (3 kb flanking transcriptional start sites (TSS)) for the indicated proteins and histone marks. Gene promoters are rank-ordered by the level of MLL enrichment at the TSS. (B) Average genome-wide occupancies are shown for LEDGF, MLL, H3K36me2 and H3K36me3 along the transcription unit. The gene body length is aligned by percentage from the TSS to TTS. Five kb upstream of TSS and 5 kb downstream of TTS are also included. (C) Average genome-wide MLL occupancies are shown for genes enriched with LEDGF, or genes with no LEDGF enrichment. (D) Genome browser representation of ChIP-seq peaks for the indicated proteins and histone marks displaying calculated ChIP-Seq enrichment values at the MEIS1 and CDK6 loci in MV4–11 leukemia cells. Relative positions of genes are shown at the top and CpG islands are shown at the bottom. (E) Mouse MLL-AF9 leukemia cells were transduced with lentiviral vectors expressing control or LEDGF shRNAs. Relative transcript and protein levels were quantified by qRT-PCR and western blot analysis, respectively. (F) MLL-AF9 transformed HSPCs transduced with either LEDGF or control shRNAs were subjected to ChIP assays using the indicated antibodies. Promoter regions amplified by qPCR are indicated below the respective panels. (G) Mouse MLL-AF9 leukemia cells were transduced with lentiviral vectors expressing control or MLL shRNAs. Relative transcript levels were quantified by qRT-PCR. (H) MLL-AF9 transformed HSPCs transduced with either MLL or control shRNAs were subjected to ChIP assays using the indicated antibodies. The regions amplified by qPCR are indicated below the respective panels.
Figure 3
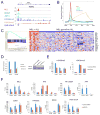
Figure 3. ASH1L, an H3K36me2 methyltransferase, controls LEDGF and MLL occupancy at target genes
(A) Genome browser representation of ChIP-seq peaks for the indicated proteins and histone marks displaying calculated ChIP-Seq enrichment values at the RUNX2 locus in human MV4–11 leukemia cells. Relative positions of RUNX2 are shown at the top and CpG islands are shown at the bottom. (B) Average genome-wide occupancies are shown for ASH1L, LEDGF, MLL, H3K36me2 and H3K36me3 along the transcription unit in MV4–11 cells. (C) GSEA plot shows enrichment profile of the genes co-occupied by MLL, LEDGF and ASH1L in MV4–11 cells in genes differentially expressed in MLL-rearranged (20 cases) versus MLL-germline ALL (112 cases) (49). Heat map shows expression in ALLs for the top 25 differentially expressed genes identified from GSEA. Normalized enrichment score (NES) = 0.508; p <0.01. (D) Mouse MLL-AF9 leukemia cells were transduced with lentiviral vectors expressing the indicated shRNAs. Transcript and protein levels were quantified by qRT-PCR and western blot analysis after three days of selection with puromycin. (E–F) MLL-AF9 transformed HSPCs transduced with ASH1L or control shRNAs were subjected to ChIP assays using the indicated antibodies. Promoter regions amplified by qPCR are indicated below the respective panels.
Figure 4
Figure 4. ASH1L is required for leukemic transformation by MLL oncoproteins
(A) Mouse MLL-AF9 leukemia cells were transduced with lentiviral vectors expressing the indicated shRNAs. Transcript levels were quantified by qRT-PCR after three days of selection with puromycin and expressed relative to control shRNA transduced cells. (B) Light microscopy of May-Grunwald/Giemsa-stained mouse MLL-AF9 leukemia cells after five days of selection in methylcellulose culture with puromycin. (C–D) The effects of ASH1L knockdown on differentiation (C) and apoptosis (D) in mouse MLL-AF9 leukemia cells (by flow cytometry) are shown. (E) Mouse HSPCs transformed by the indicated oncogenes (below) were transduced with lentiviral vectors expressing control or ASH1L shRNAs. Colony numbers were quantified after 5 days of selection in methylcellulose culture with puromycin. Results are expressed relative to control shRNA transduced cells. (F) Survival curves are shown for cohorts of mice transplanted with mouse MLL-AF10 leukemia cells (1×10⁶) transduced with control or ASH1L shRNAs (n = 5 each cohort). Acute leukemia was confirmed by peripheral blood leukocyte count and necropsy. Log-rank test was used for statistical analysis (p = 0.0017).
Figure 5
Figure 5. ASH1L is required for transformation of MLL-rearranged human leukemia cells
(A) MV4–11 leukemia cells were transduced with lentiviral vectors expressing control or ASH1L shRNAs. Transcript levels for the indicated genes were quantified by qRT-PCR after three days of selection with puromycin and expressed relative to control shRNA transduced cells. (B, C) Human leukemia cell lines were transduced with lentiviral vectors expressing the indicated shRNAs. Colony numbers were quantified after seven days of selection in methylcellulose culture with puromycin, and expressed relative to control shRNA transduced cells (B). Cell numbers were quantified after indicated times of selection in liquid culture with puromycin (C). (D, E) MV 4–11 leukemia cells (D) or MLLr primary human AML cells (E) were transduced with ASH1L or control shRNAs and transplanted into NSG mice. The percentage of transduced (RFP+) cells was assessed before transplant and in the bone marrow after 4 weeks (D) and 10 weeks (E) in vivo. Normalized RFP reflects the ratio of RFP+ human cells at a given time point to the level immediately prior to transplant.
Figure 6
Figure 6. H3K36me3 is not essential for LEDGF and MLL target gene occupancy
(A) Mouse MLL-AF9 leukemia cells were transduced with lentiviral vectors expressing the indicated shRNAs. Transcript levels for genes indicated below were quantified by qRT-PCR after three days of selection with puromycin, and expressed relative to control shRNA transduced cells. (B) Global levels of histone methylation were determined by western blot analysis of MLL-AF9 leukemia cells transduced with SETD2 or control shRNAs. (C) Mouse HSPCs transformed by MLL-AF9 were transduced with lentiviral vectors expressing the indicated shRNAs. Colony numbers were quantified after five days of selection in methylcellulose culture with puromycin. Results are expressed relative to control shRNA transduced cells. (D) MLL-AF9 transformed HSPCs transduced with SETD2 or control shRNAs were subjected to ChIP assays using the indicated antibodies. Promoter regions amplified by qPCR are indicated below the respective panels.
Figure 7
Figure 7. KDM2A impairs leukemic transformation by MLL oncoproteins
(A) Mouse MLL-AF10 leukemia cells were transduced with KDM2A or KDM2B over-expression or control vectors. Transcript levels for genes indicated below the respective panels were quantified by qRT-PCR after three days of selection with puromycin and expressed relative to control vector transduced cells. (B) MLL-AF10 transformed HSPCs transduced with KDM2A over-expression or control vectors were subjected to ChIP assays using the indicated antibodies. Promoter regions amplified by qPCR are indicated below the respective panels. (C) MLL-AF10 transformed HSPCs were transduced with KDM2A or KDM2B over-expression or control vectors. Colony numbers were quantified after five days of selection in methylcellulose culture with puromycin. Results are expressed relative to control vector transduced cells. (D) Mouse HSPCs transformed by the indicated oncogenes were transduced with KDM2A over-expression or control vectors. Colony numbers were quantified after five days of selection in methylcellulose culture with puromycin. Results are expressed relative to control vector transduced cells. (E) Survival curves are shown for cohorts of mice transplanted with MLL-AF10 leukemia cells (1×10⁶) transduced with KDM2A over-expression or control vectors. (n = 5 each cohort). Acute leukemia was confirmed by peripheral blood leukocyte count and necropsy. Log-rank test was used for statistical analysis (p = 0.0018).

Comment in

References

    1. Greer EL, Shi Y. Histone methylation: a dynamic mark in health, disease and inheritance. Nature Reviews Genetics. 2012;13(5):343–57. - PMC - PubMed
    1. Musselman CA, Lalonde ME, Cote J, Kutateladze TG. Perceiving the epigenetic landscape through histone readers. Nature Structural & Molecular Biology. 2012;19(12):1218–27. - PMC - PubMed
    1. Schuettengruber B, Chourrout D, Vervoort M, Leblanc B, Cavalli G. Genome regulation by polycomb and trithorax proteins. Cell. 2007;128(4):735–45. - PubMed
    1. Hess JL, Yu BD, Li B, Hanson R, Korsmeyer SJ. Defects in yolk sac hematopoiesis in Mll-null embryos. Blood. 1997;90(5):1799–806. - PubMed
    1. Jude CD, Climer L, Xu D, Artinger E, Fisher JK, Ernst P. Unique and independent roles for MLL in adult hematopoietic stem cells and progenitors. Cell Stem Cell. 2007;1(3):324–37. - PMC - PubMed

MeSH terms