Comment
. 2016 Jun 7;113(23):6508-13.
doi: 10.1073/pnas.1605085113. Epub 2016 May 6.

Syntax compensates for poor binding sites to encode tissue specificity of developmental enhancers

Affiliations
Comment

Syntax compensates for poor binding sites to encode tissue specificity of developmental enhancers

Emma K Farley et al. Proc Natl Acad Sci U S A. .

Abstract

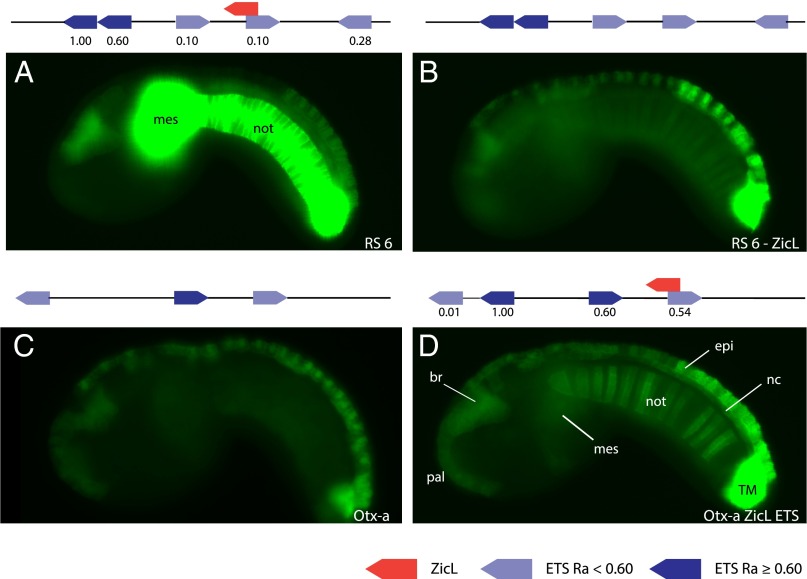
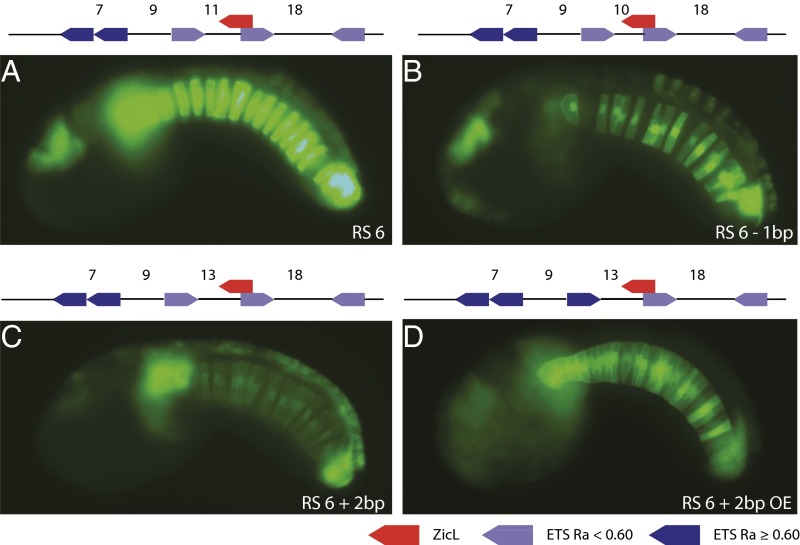
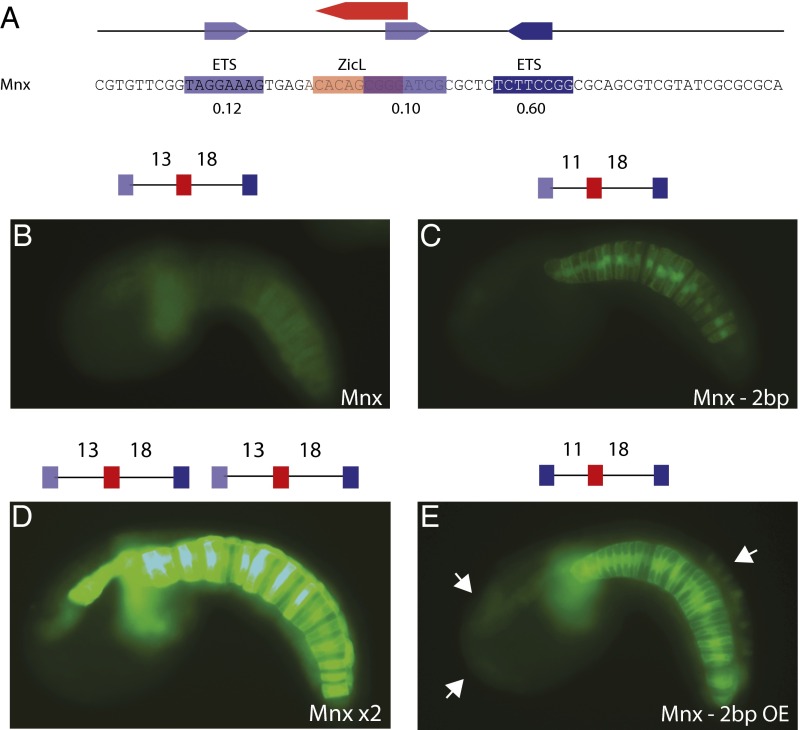
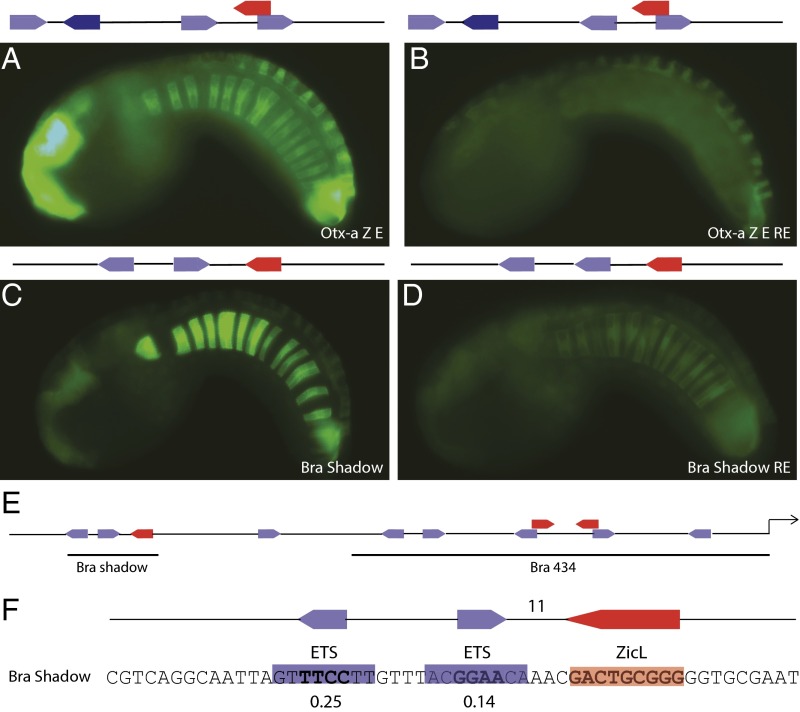
Transcriptional enhancers are short segments of DNA that switch genes on and off in response to a variety of intrinsic and extrinsic signals. Despite the discovery of the first enhancer more than 30 y ago, the relationship between primary DNA sequence and enhancer activity remains obscure. In particular, the importance of "syntax" (the order, orientation, and spacing of binding sites) is unclear. A high-throughput screen identified synthetic notochord enhancers that are activated by the combination of ZicL and ETS transcription factors in Ciona embryos. Manipulation of these enhancers elucidated a "regulatory code" of sequence and syntax features for notochord-specific expression. This code enabled in silico discovery of bona fide notochord enhancers, including those containing low-affinity binding sites that would be excluded by standard motif identification methods. One of the newly identified enhancers maps upstream of the known enhancer that regulates Brachyury (Ci-Bra), a key determinant of notochord specification. This newly identified Ci-Bra shadow enhancer contains binding sites with very low affinity, but optimal syntax, and therefore mediates surprisingly strong expression in the notochord. Weak binding sites are compensated by optimal syntax, whereas enhancers containing high-affinity binding affinities possess suboptimal syntax. We suggest this balance has obscured the importance of regulatory syntax, as noncanonical binding motifs are typically disregarded by enhancer detection methods. As a result, enhancers with low binding affinities but optimal syntax may be a vastly underappreciated feature of the regulatory genome.

Keywords: enhancer; enhancer grammar; gene regulation; regulatory principles; transcription.


Conflict of interest statement

The authors declare no conflict of interest.

Figures

Fig. 1.
Fig. 1.
ETS and ZicL mediate notochord expression. (A) Embryo electroporated with RS 6; GFP expression can be seen strongly (≥10% saturated pixels at 500 ms exposure time) in the notochord (not) and mesenchyme (mes), and moderately in the anterior brain and dorsal epidermis. Expression in this embryo is saturated, as all images in this figure are taken at the same exposure time. Please see SI Appendix, Fig. S1, for images of this embryo at other exposure times. (B) Embryo electroporated with RS 6 −ZicL, where the ZicL site has been mutated. GFP expression is only weakly (<10% saturated pixels at 800 ms) in the notochord. (C) Embryo electroporated with Otx-a; GFP expression can be seen in the anterior brain, palps, dorsal nerve cord, dorsal epidermis, and two tail muscle cells. No expression is seen in the notochord. (D) Embryo electroporated with Otx-a ZicL ETS, where the sequence was modified to add a ZicL and ETS site similar to RS 6. Moderate GFP expression is now seen in the notochord as well as locations of endogenous Otx-a expression anterior brain (br), palps (pal), dorsal nerve cord (nc), dorsal epidermis (epi), and two tail muscle cells (TM). A schematic of the sequence electroporated is shown above each image. Dark-blue arrows refer to ETS binding sites with a relative binding affinity (Ra) ≥0.60, which is classified as a high binding affinity; light-blue arrows refer to ETS binding sites with a binding affinity <0.60; and red arrows refer to a ZicL binding site. All images were taken at the same exposure time. For counting of expression, see SI Appendix, Fig. S1.
Fig. 2.
Fig. 2.
Regulatory compensation: suboptimal spacing can be balanced by improved binding affinities. (A) Embryo electroporated with RS 6; GFP expression can be seen strongly in the notochord and mesenchyme and moderately in the anterior brain and dorsal epidermis. (B) Embryo electroporated with RS 6 −1 bp, where 1 bp has been deleted between ETS and ZicL. GFP expression is weaker in the notochord compared with RS 6. (C) Embryo electroporated with RS 6 +2 bp, where 2 bp have been inserted between ETS and ZicL. GFP expression is weaker in the notochord compared with RS 6. (D) Embryo electroporated with RS 6 +2 bp optimized ETS (OE), where the ETS closest to the ZicL has been changed from CTGGAACT to CCGGAAGT, the optimal affinity ETS binding motif. GFP expression is stronger in the notochord than RS 6 +2 bp and equal to RS 6. The poorer spacing in RS 6 +2 bp has been compensated by the optimal ETS binding site. A schematic of the sequence electroporated is shown above each image. Dark-blue arrows refer to ETS binding sites with a binding affinity above 0.60, light-blue arrows refer to ETS binding sites with a binding affinity lower than 0.60, and red arrows refer to a ZicL binding site. All images were taken at the same exposure time.
Fig. 3.
Fig. 3.
Identification of the Mnx enhancer, using compensatory regulatory logic. (A) The 69-bp sequence of an Mnx enhancer located 690 bp upstream of the transcription start site for Mnx. Relative binding affinities are shown below sites. (B) Embryo electroporated with Mnx enhancer; GFP expression can be seen weakly in the notochord. (C) Embryo electroporated with Mnx −2 bp enhancer; GFP expression is stronger in the notochord compared with Mnx. (D) Embryo electroporated with Mnx ×2 enhancer; GFP expression can be strongly in the notochord and the floor plate and moderately in the mesenchyme. (E) Embryo electroporated with Mnx −2 bp with optimized ETS (OE) enhancer; GFP is strongly expressed in the notochord compared with Mnx −2 bp. White arrows point to ectopic expression in the palps, anterior brain, and dorsal epidermis. A schematic of the sequence electroporated is shown above each image. Dark-blue boxes refer to ETS binding sites with a binding affinity above 0.60, light-blue boxes refer to ETS binding sites with a binding affinity lower than 0.60, and red boxes refer to a ZicL binding site. All images were taken at the same exposure time to allow for direct comparison. For counting, see SI Appendix, Fig. S6.
Fig. 4.
Fig. 4.
Optimal syntax compensates for poor affinities to encode tissue specific expression. (A) Embryo electroporated with Otx-a ZicL ETS (Otx-a Z E); GFP expression can be seen in the notochord as well as locations of endogenous Otx-a expression. (B) Embryo electroporated with Otx-a ZicL ETS reversed ETS (Otx-a Z E RE), where the sequence of the ETS closest to the ZicL was mutated to be the reverse complement. GFP expression in the notochord is lost. (C) Embryo electroporated with Bra shadow; GFP expression can be seen in the notochord. (D) Embryo electroporated with Bra shadow with reversed ETS (Bra shadow RE); GFP expression is diminished in the notochord. A schematic of the sequence electroporated is shown above each image. Dark-blue boxes refer to ETS binding sites with a binding affinity above 0.60, light-blue boxes refer to ETS binding sites with a binding affinity lower than 0.60, and red boxes refer to a ZicL binding site. All images were taken at the same exposure time. (E) The Bra shadow is 731 bp upstream of the Brachyury start site. (F) The Bra shadow employs the optimal syntax, the ETS and ZicL are 11 bp apart and are facing each other, but the relative affinity of the ETS binding site are poor at 0.25 and 0.14.

Comment in

  • Regulatory elements: Putting enhancers into context.
    Burgess DJ. Burgess DJ. Nat Rev Genet. 2016 Jul;17(7):377. doi: 10.1038/nrg.2016.74. Epub 2016 May 31. Nat Rev Genet. 2016. PMID: 27240812 No abstract available.
  • How to tune an enhancer.
    Barolo S. Barolo S. Proc Natl Acad Sci U S A. 2016 Jun 7;113(23):6330-1. doi: 10.1073/pnas.1606109113. Epub 2016 May 31. Proc Natl Acad Sci U S A. 2016. PMID: 27247414 Free PMC article. No abstract available.

Comment on

  • How to tune an enhancer.
    Barolo S. Barolo S. Proc Natl Acad Sci U S A. 2016 Jun 7;113(23):6330-1. doi: 10.1073/pnas.1606109113. Epub 2016 May 31. Proc Natl Acad Sci U S A. 2016. PMID: 27247414 Free PMC article. No abstract available.

References

    1. Crocker J, et al. Low affinity binding site clusters confer hox specificity and regulatory robustness. Cell. 2015;160(1-2):191–203. - PMC - PubMed
    1. Farley EK, et al. Suboptimization of developmental enhancers. Science. 2015;350(6258):325–328. - PMC - PubMed
    1. Small S, Kraut R, Hoey T, Warrior R, Levine M. Transcriptional regulation of a pair-rule stripe in Drosophila. Genes Dev. 1991;5(5):827–839. - PubMed
    1. Jiang J, Levine M. Binding affinities and cooperative interactions with bHLH activators delimit threshold responses to the dorsal gradient morphogen. Cell. 1993;72(5):741–752. - PubMed
    1. Swanson CI, Schwimmer DB, Barolo S. Rapid evolutionary rewiring of a structurally constrained eye enhancer. Curr Biol. 2011;21(14):1186–1196. - PMC - PubMed

Publication types

Substances