

doi: 10.5588/ijtld.15.0882.
Isoniazid hair concentrations in children with tuberculosis: a proof of concept study
Affiliations
- PMID: 27155191
- PMCID: PMC4889729
- DOI: 10.5588/ijtld.15.0882
Item in Clipboard
Isoniazid hair concentrations in children with tuberculosis: a proof of concept study
Int J Tuberc Lung Dis.
2016 Jun.
Abstract
Assessing treatment adherence and quantifying exposure to anti-tuberculosis drugs among children is challenging. We undertook a 'proof of concept' study to assess the drug concentrations of isoniazid (INH) in hair as a therapeutic drug monitoring tool. Children aged <12 years initiated on a thrice-weekly treatment regimen including INH (10 mg/kg) for newly diagnosed tuberculosis were enrolled. INH concentrations in hair were measured using liquid chromatography-tandem mass spectrometry at 1, 2, 4 and 6 months after initiating anti-tuberculosis treatment. We found that INH hair concentrations in all children on thrice-weekly INH were detectable and displayed variability across a dynamic range.
Figures
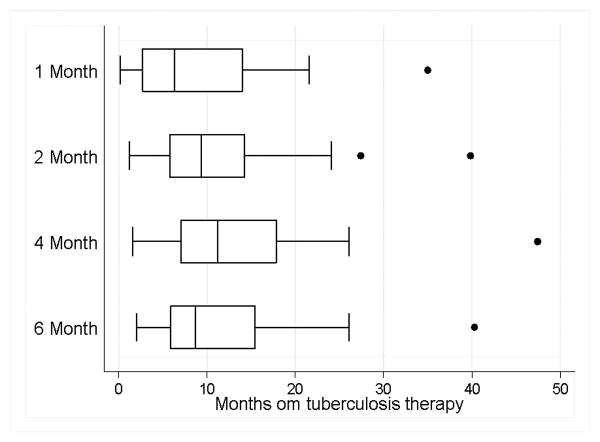
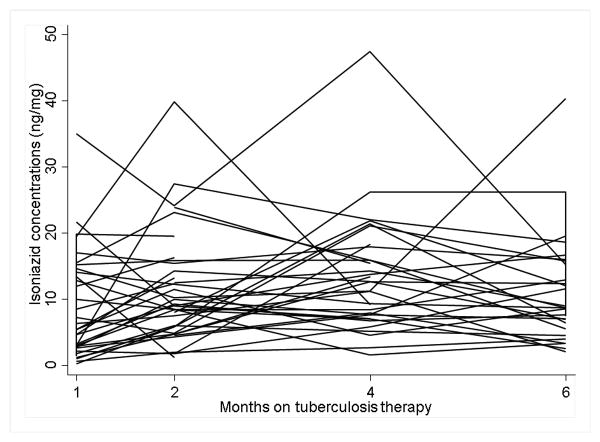
1a. Hair isoniazid concentrations by months on tuberculosis therapy. Months on tuberculosis therapy is shown in Y-axis. Dots in the figure represent outlier values; 1b. Sphagetti plot illustrating intra-individual variability of hair isoniazid concentrations over 6 months on tuberculosis therapy. Each line indicates the individual hair isoniazid concentrations at month 1, 2, 4 and 6 on tuberculosis therapy.
1a. Hair isoniazid concentrations by months on tuberculosis therapy. Months on tuberculosis therapy is shown in Y-axis. Dots in the figure represent outlier values; 1b. Sphagetti plot illustrating intra-individual variability of hair isoniazid concentrations over 6 months on tuberculosis therapy. Each line indicates the individual hair isoniazid concentrations at month 1, 2, 4 and 6 on tuberculosis therapy.
References
-
- World Health Organization. Document WHO/HTM/TB/2015 22. Geneva: World Health Organization; 2015. [Accessed 25th November 2015]. Global tuberculosis report 2015. www.who.int/tb/publications/global_report/en/
-
- Peloquin CA. Therapeutic drug monitoring in the treatment of tuberculosis. Drugs. 2002;62(15):2169–83. 2002. - PubMed
-
- Podsadecki TJ, Vrijens BC, Tousset EP, Rode RA, Hanna GJ. “White coat compliance” limits the reliability of therapeutic drug monitoring in HIV-1-infected patients. HIV Clin Trials. 2008;9(4):238–246. - PubMed
-
- Garcia-Martin E. Interethnic and intraethnic variability of NAT2 single nucleotide polymorphisms. Current Drug Metabolism. 2008;9:487–97. - PubMed
Publication types
MeSH terms
Substances
Grants and funding
LinkOut - more resources
Full Text Sources
Other Literature Sources
Medical
