

Dynamic metabolic and transcriptomic profiling of methyl jasmonate-treated hairy roots reveals synthetic characters and regulators of lignan biosynthesis in Isatis indigotica Fort
- PMID: 27155368
- PMCID: PMC5103230
- DOI: 10.1111/pbi.12576
Dynamic metabolic and transcriptomic profiling of methyl jasmonate-treated hairy roots reveals synthetic characters and regulators of lignan biosynthesis in Isatis indigotica Fort
Abstract
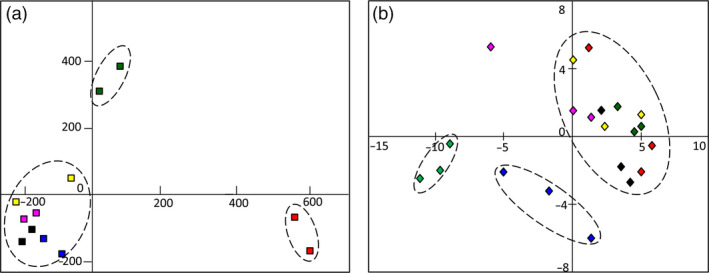
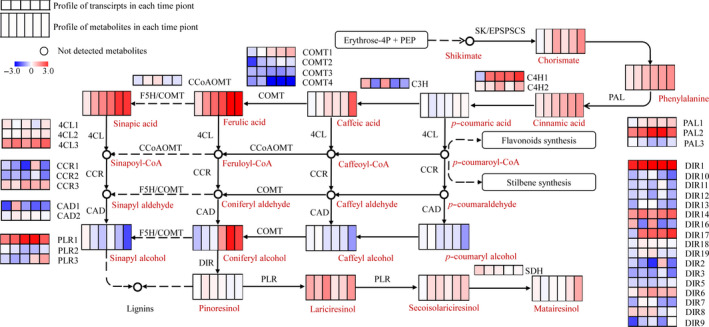
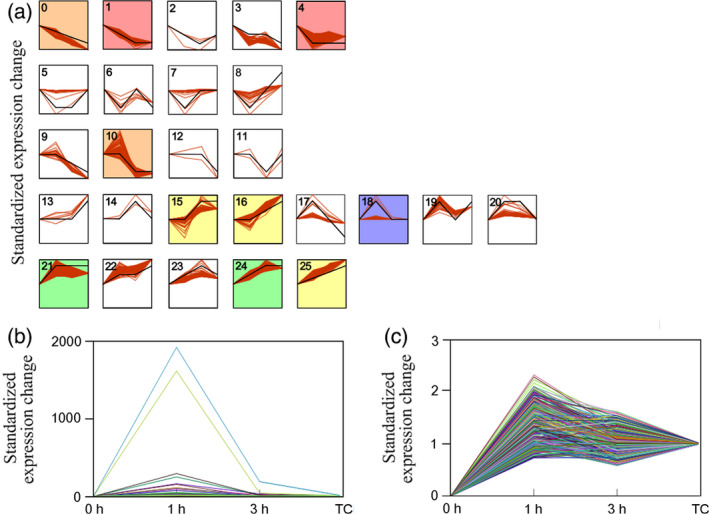
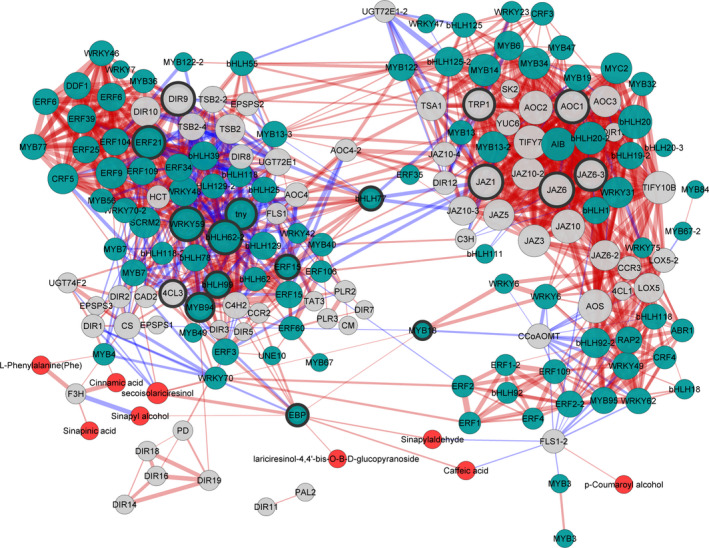
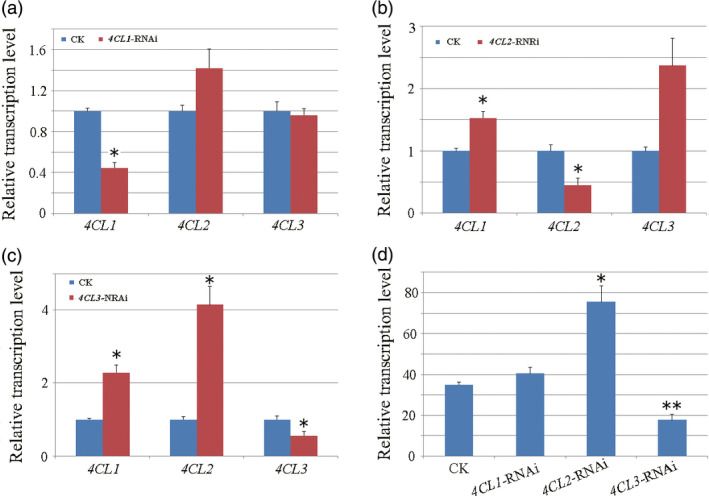
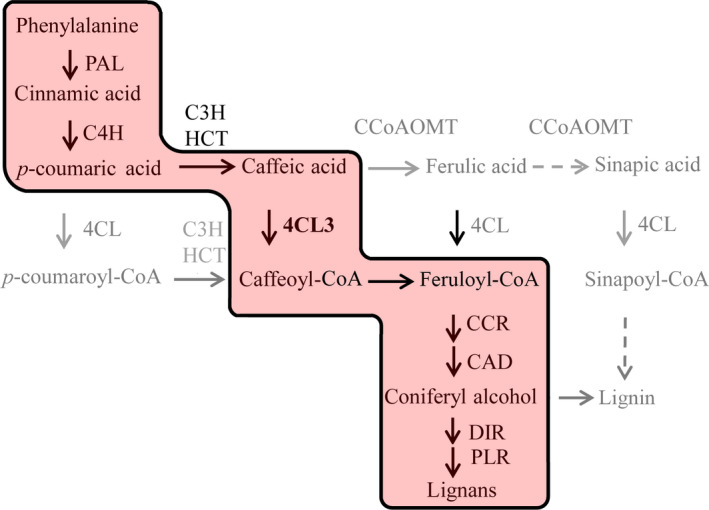
A molecular description of lignan biosynthesis in Isatis indigotica displaying its synthetic characteristics and regulatory mechanism is of great importance for the improvement of the production of this class of active compounds. To discover the potential key catalytic steps and regulatory genes, I. indigotica hairy roots elicited by methyl jasmonate (MeJA) were used as a source of systematic variation for exploring the metabolic/transcriptional changes and candidate genes that might play key roles in lignan biosynthesis. The reprogramming modulated by MeJA was classified into three distinct phases, referred to as signal responding, transcriptional activation of metabolic pathways and accumulation of metabolites. Candidate genes were pooled according to the three phases and applied to co-expression network analysis. In total, 17 genes were identified as hub genes. 4CL3 was selected to validate its impact on lignan biosynthesis. RNAi of 4CL3 resulted in a significant reduction in lignan production. Taken together with its catalytic property, a major route of lignan biosynthesis in I. indigotica was highlighted, which was catalysed by 4CL3 via the esterization of caffeic acid. In conclusion, this study provides new insights into lignan biosynthesis as well as potential targets for metabolic engineering in I. indigotica.
Keywords: Isatis indigotica; co-expression network; lignan biosynthesis; metabolic profiling; transcriptomic profiling.
© 2016 The Authors. Plant Biotechnology Journal published by Society for Experimental Biology and The Association of Applied Biologists and John Wiley & Sons Ltd.
Conflict of interest statement
The authors declare they have no conflict of interest.
Figures
Similar articles
-
Transcriptome-wide analysis of basic helix-loop-helix transcription factors in Isatis indigotica and their methyl jasmonate responsive expression profiling.Gene. 2016 Jan 15;576(1 Pt 1):150-9. doi: 10.1016/j.gene.2015.09.083. Epub 2015 Oct 9. Gene. 2016. PMID: 26449398
-
Deep sequencing reveals transcriptome re-programming of Polygonum multiflorum thunb. roots to the elicitation with methyl jasmonate.Mol Genet Genomics. 2016 Feb;291(1):337-48. doi: 10.1007/s00438-015-1112-9. Epub 2015 Sep 5. Mol Genet Genomics. 2016. PMID: 26342927 Free PMC article.
-
Biosynthesis of the active compounds of Isatis indigotica based on transcriptome sequencing and metabolites profiling.BMC Genomics. 2013 Dec 5;14:857. doi: 10.1186/1471-2164-14-857. BMC Genomics. 2013. PMID: 24308360 Free PMC article.
-
Computational identification and systematic classification of novel GRAS genes in Isatis indigotica.Chin J Nat Med. 2016 Mar;14(3):161-76. doi: 10.1016/S1875-5364(16)30013-9. Chin J Nat Med. 2016. PMID: 27025363 Review.
-
Isatis indigotica: from (ethno) botany, biochemistry to synthetic biology.Mol Hortic. 2021 Dec 14;1(1):17. doi: 10.1186/s43897-021-00021-w. Mol Hortic. 2021. PMID: 37789475 Free PMC article. Review.
Cited by
-
Transcriptome Analysis of JA Signal Transduction, Transcription Factors, and Monoterpene Biosynthesis Pathway in Response to Methyl Jasmonate Elicitation in Mentha canadensis L.Int J Mol Sci. 2018 Aug 10;19(8):2364. doi: 10.3390/ijms19082364. Int J Mol Sci. 2018. PMID: 30103476 Free PMC article.
-
Characterization of LuWRKY36, a flax transcription factor promoting secoisolariciresinol biosynthesis in response to Fusarium oxysporum elicitors in Linum usitatissimum L. hairy roots.Planta. 2019 Jul;250(1):347-366. doi: 10.1007/s00425-019-03172-9. Epub 2019 Apr 29. Planta. 2019. PMID: 31037486
-
Cellular Morphology and Transcriptome Comparative Analysis of Astragalus membranaceus Bunge Sprouts Cultured In Vitro under Different LED Light.Plants (Basel). 2023 May 8;12(9):1914. doi: 10.3390/plants12091914. Plants (Basel). 2023. PMID: 37176972 Free PMC article.
-
Metabolic Profiling of Terpene Diversity and the Response of Prenylsynthase-Terpene Synthase Genes during Biotic and Abiotic Stresses in Dendrobium catenatum.Int J Mol Sci. 2022 Jun 7;23(12):6398. doi: 10.3390/ijms23126398. Int J Mol Sci. 2022. PMID: 35742843 Free PMC article.
-
Transcriptome Analysis Reveals Differences in Key Genes and Pathways Regulating Carbon and Nitrogen Metabolism in Cotton Genotypes under N Starvation and Resupply.Int J Mol Sci. 2020 Feb 22;21(4):1500. doi: 10.3390/ijms21041500. Int J Mol Sci. 2020. PMID: 32098345 Free PMC article.
References
-
- Babu, M.M. , Luscombe, N.M. , Aravind, L. , Gerstein, M. and Teichmann, S.A. (2004) Structure and evolution of transcriptional regulatory networks. Curr. Opin. Struct. Biol. 14, 283–291. - PubMed
-
- Beuerle, T. and Pichersky, E. (2002) Enzymatic synthesis and purification of aromatic coenzyme A esters. Anal. Biochem. 302, 305–312. - PubMed
Publication types
MeSH terms
Substances
LinkOut - more resources
Full Text Sources
Other Literature Sources
