Meta-Analysis
. 2017 Mar 30;322(Pt B):311-328.
doi: 10.1016/j.bbr.2016.05.007. Epub 2016 May 4.

Transcriptional signatures of brain aging and Alzheimer's disease: What are our rodent models telling us?

Affiliations
Meta-Analysis

Transcriptional signatures of brain aging and Alzheimer's disease: What are our rodent models telling us?

Kendra E Hargis et al. Behav Brain Res. .

Abstract

Aging is the biggest risk factor for idiopathic Alzheimer's disease (AD). Recently, the National Institutes of Health released AD research recommendations that include: appreciating normal brain aging, expanding data-driven research, using open-access resources, and evaluating experimental reproducibility. Transcriptome data sets for aging and AD in humans and animal models are available in NIH-curated, publically accessible databases. However, little work has been done to test for concordance among those molecular signatures. Here, we test the hypothesis that brain transcriptional profiles from animal models recapitulate those observed in the human condition. Raw transcriptional profile data from twenty-nine studies were analyzed to produce p-values and fold changes for young vs. aged or control vs. AD conditions. Concordance across profiles was assessed at three levels: (1) # of significant genes observed vs. # expected by chance; (2) proportion of significant genes showing directional agreement; (3) correlation among studies for magnitude of effect among significant genes. The highest concordance was found within subjects across brain regions. Normal brain aging was concordant across studies, brain regions, and species, despite profound differences in chronological aging among humans, rats and mice. Human studies of idiopathic AD were concordant across brain structures and studies, but were not concordant with the transcriptional profiles of transgenic AD mouse models. Further, the five transgenic AD mouse models that were assessed were not concordant with one another. These results suggest that normal brain aging is similar in humans and research animals, and that different transgenic AD model mice may reflect selected aspects of AD pathology.

Keywords: Aging; Alzheimer’s disease; Transcriptome.


Figures

Figure 1
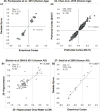
Figure 1. Assessing similarity/concordance across transcriptional profiles
A. When contrasting studies, method 1 (False Positive) assesses the number of genes expected to be significant due to the error of multiple testing. Total number of genes common to both studies multiplied by the p-value cutoffs used in both studies to identify significant genes (e.g., 13146 total genes * 0.01 for hippocampal (hip) * 0.01 for entorhinal cortex (EC) yields 131 genes expected in each study with 1 gene common between them. Method 2 (post hoc) uses the number of genes observed to be significant in each study, divided by the total number of genes tested, to establish the probability that any gene randomly drawn from the data set would be significant. The number in the overlap is predicted by the product of the post hoc probabilities for each direction in each study. In the Berchtold et al, 2008 hippocampal profile, 358 genes were significantly downregulated and 962 were significantly upregulated. In the same study’s entorhinal cortex profile, 162 genes were significantly downregulated and 219 were significantly upregulated. Therefore, the number of genes predicted to be significant and to agree in direction for both studies is [downregulated: (358/13146) * (162/13146) * 13146 = ∼4] + [upregulated: (962/13146) * (219/13146) = ∼16] = 20. Observed gives the values found in the actual comparison. phFCR-post hoc False Concordance Rate- an extension of the False Discovery Rate assessment used in single transcriptional profile studies (Method 2 overlap/observed overlap). B. A representative example of relative agreement across brain regions within subjects. For the 85 aging-significant genes overlapping between hippocampus and EC, log 2 fold changes for entorhinal cortex are plotted against hippocampus. The observed number of genes, the post hoc false concordance rate (phFCR), and percent agreement (%: based on direction of change) are shown.
Figure 2
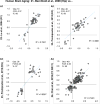
Figure 2. Similarity within subjects across brain regions
In addition to Berchtold et al., 2008 (see Fig. 1), the first four of eight additional studies examining transcriptional profiles in the same subjects across > 1 brain region are shown. For each comparison, the fold change (log2) for significant genes across regions are plotted, along with the R2 value for the correlation. Within each graph, the observed number of genes, the post hoc false concordance rate (phFCR), and percent agreement (%: based on direction of change) are shown. A1–A2: Human aging. B1–B2: Human Alzheimer’s disease. In B1, Laser Capture Microdissected (LCM) formalin fixed paraffin embedded CA region of the hippocampus (2011) is contrasted with hand-dissected fresh frozen samples (2004).
Figure 3
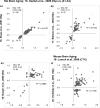
Figure 3. Similarity within subjects across brain regions
In addition to Berchtold et al, 2008 (see Fig. 1), the second four of eight studies examining transcriptional profiles in the same subjects across > 1 brain region are shown. For each comparison, the fold change (log2) for significant genes across regions are plotted, along with the R2 value for the correlation. Within each graph, the observed number of genes, the post hoc false concordance rate (phFCR), and percent agreement (%: based on direction of change) are shown. A1–A2: Human Alzheimer’s disease. B1–B2: Transgenic mouse models of Alzheimer’s disease.
Figure 4
Figure 4. Brain aging profile similarity within humans
Log2 fold changes are plotted for overlapping significant genes in each pairwise study comparison A1–4. Within each graph, number of genes observed (Obs), post hoc false concordance rate (FCR), and percent agreement are shown.
Figure 5
Figure 5. Brain aging profile similarity within rodents
Log2 fold changes are plotted for overlapping significant genes in each study. A1–A3: Concordance evaluations for rat brain aging profiles. B: Concordance evaluation for mouse brain aging (note that aging in [20] was 2 v 15 months old, while in [19] they were 5 vs 30 months). Within each graph, number of genes observed (Obs), post hoc false concordance rate (FCR), and percent agreement are shown.
Figure 6
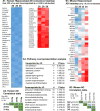
Figure 6. Brain aging consensus within species
A1: Heatmap of ranked fold changes from most negative (blue) to most positive (red) are shown for genes significantly changed (p ≤ 0.05) in four human brain aging studies. Two genes (c, ELAVL1) did not show consistent direction of change. Selected significant pathway overrepresentation analysis categories, numbers of genes, and overrepresentation p-values are noted. A2: Correlation matrix r values from Pearson’s test for all pairwise comparisons among the commonly significant human aging genes. B1: Heatmap of ranked fold changes for rat aging genes significant across four studies at p ≤ 0.05. One gene, IL18 was consistent in hippocampal specimens, but not in DG. B2: Correlation matrix r values (Pearson’s test) for all pairwise comparisons among the commonly significant rat aging genes. Within each correlation matrix (A2, B2), estimated numbers of genes predicted to be found by method 1 (M1), method 2 (M2), number of genes observed (Obs) and false concordance rate (FCR) are shown.
Figure 7
Figure 7. Comparison of human vs. rodent hippocampal aging
Log2 Fold changes are plotted for overlapping significant genes in human hippocampal aging vs. four aging transcriptional profiles in rodents. A: Mouse hippocampal aging profile. B–D. Rat hippocampal aging profiles. Within each graph, estimated numbers of genes predicted to be found by method 1 (M1), method 2 (M2), number of genes observed (Obs) and false concordance rate (FCR) are shown.
Figure 8
Figure 8. Human AD similarity
Log2 fold changes are plotted for overlapping significant genes in each study, along with numerical comparison results. A1–3: Concordance evaluations are made for human brain AD profiles. A4- comparison with human Down’s syndrome subjects (control Down’s vs. Down’s with AD-like pathology). Within each graph, estimated numbers of genes predicted to be found by method 1 (M1), method 2 (M2), number of genes observed (Obs) and false concordance rate (FCR) are shown.
Figure 9
Figure 9. Similarity among AD mouse models
Log2 fold changes are plotted for overlapping significant genes in each study, along with numerical comparison results. A1–A4: Concordance evaluations for transgenic mouse models of AD. Within each graph, estimated numbers of genes predicted to be found by method 1 (M1), method 2 (M2), number of genes observed (Obs) and false concordance rate (FCR) are shown.
Figure 10
Figure 10. Alzheimer’s disease human and animal model gene signatures
A1: Heatmap of ranked fold changes from most negative (blue) to most positive (red) are shown for genes significantly changeSS (p ≤ 0.05) in three human hippocampal brain AD studies. For display purposes, the top 10% commonly upregulated and downregulated genes are shown out of 503 total genes (491 of which agreed in direction across all studies). A2: Correlation matrix r-values from Pearson’s test for all pairwise comparisons among the commonly significant human hippocampal AD genes A3: Pathway overrepresentation analysis results with pathway, number of genes significant in pathway (#), and probability such a result would be found by chance (Pvalue). B1: Heatmap of ranked fold changes for mouse transgenic AD model genes significant across four studies at p ≤ 0.05. Two genes (CAPG and IGSF6) showed directional agreement. One gene, IL18 was consistent in hippocampal specimens, but not in DG. B2: Correlation matrix r values (Pearson’s test) for all pairwise comparisons among the commonly significant transgenic mouse model AD genes. Within each correlation matrix (A2), estimated numbers of genes predicted to be found by method 1 (M1), method 2 (M2), number of genes observed (Obs) and false concordance rate (FCR) are shown.
Figure 11
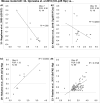
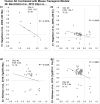
Figure 11. Comparison of human AD transcriptional profile with individual mouse models and brain regions
Log2 fold changes for genes found significant across human and individual mouse transgenic AD models and regions (first 4 of 7 comparisons) are shown. A1–2: Hippocampal (Hip) and entorhinal cortex (EC) from the J20 mouse. B1–B2: Hippocampal and frontal cortex (F. Ctx) from the Tg2576 mouse). Within each graph, estimated numbers of genes predicted to be found by method 1 (M1), method 2 (M2), number of genes observed (Obs) and false concordance rate (FCR) are shown.
Figure 12
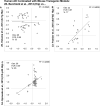
Figure 12. Comparison of human AD transcriptional profile with individual mouse models and brain regions
Log2 fold changes for genes found significant across human and individual mouse transgenic AD models (last 3 of 7) are shown. A: Hippocampus from the 3xTg mouse. B. Hippocampus from the 5xFAD mouse. C: Hippocampus from the CK-p25 inducible mouse model (RNA-seq based fold changes). Within each graph, estimated numbers of genes predicted to be found by method 1 (M1), method 2 (M2), number of genes observed (Obs) and false concordance rate (FCR) are shown.
Figure 13
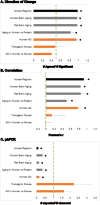
Figure 13
Consolidated comparisons. Averaged pairwise contrast comparison results for direction of change (A), correlation (B), and post hoc False Concordance Rate (C) are shown. Across Regions from Figs. 1B, 2 and 3; Human Brain Aging from Fig. 4; Rat Brain Aging from Fig. 5; Aging in Human vs. Rodent from Fig. 7; Human AD from Fig. 8; Transgenic Mouse from Fig. 10; and AD in Human vs. Mouse from Figs. 11 and 12. * p ≤ 0.05; one-sample t-test vs. chance (dashed green line).

Similar articles

Cited by

References

    1. Satizabal CL, Beiser AS, Chouraki V, Chene G, Dufouil C, Seshadri S. Incidence of Dementia over Three Decades in the Framingham Heart Study. N Engl J Med. 2016;374:523–32. - PMC - PubMed
    1. Lister JP, Barnes CA. Neurobiological changes in the hippocampus during normative aging. Arch Neurol. 2009;66:829–33. - PubMed
    1. Mielke MM, Vemuri P, Rocca WA. Clinical epidemiology of Alzheimer’s disease: assessing sex and gender differences. Clin Epidemiol. 2014;6:37–48. - PMC - PubMed
    1. Hebert LE, Scherr PA, Bienias JL, Bennett DA, Evans DA. Alzheimer disease in the US population: prevalence estimates using the 2000 census. Arch Neurol. 2003;60:1119–22. - PubMed
    1. Foster TC. Dissecting the age-related decline on spatial learning and memory tasks in rodent models: N-methyl-D-aspartate receptors and voltage-dependent Ca2+ channels in senescent synaptic plasticity. Prog Neurobiol. 2012;96:283–303. - PMC - PubMed

Publication types