. 2016 Nov;73(21):4121-40.
doi: 10.1007/s00018-016-2259-1. Epub 2016 May 7.

Hepatitis B virus inhibits insulin receptor signaling and impairs liver regeneration via intracellular retention of the insulin receptor

Affiliations

Hepatitis B virus inhibits insulin receptor signaling and impairs liver regeneration via intracellular retention of the insulin receptor

Sebastian Robert Barthel et al. Cell Mol Life Sci. 2016 Nov.

Abstract

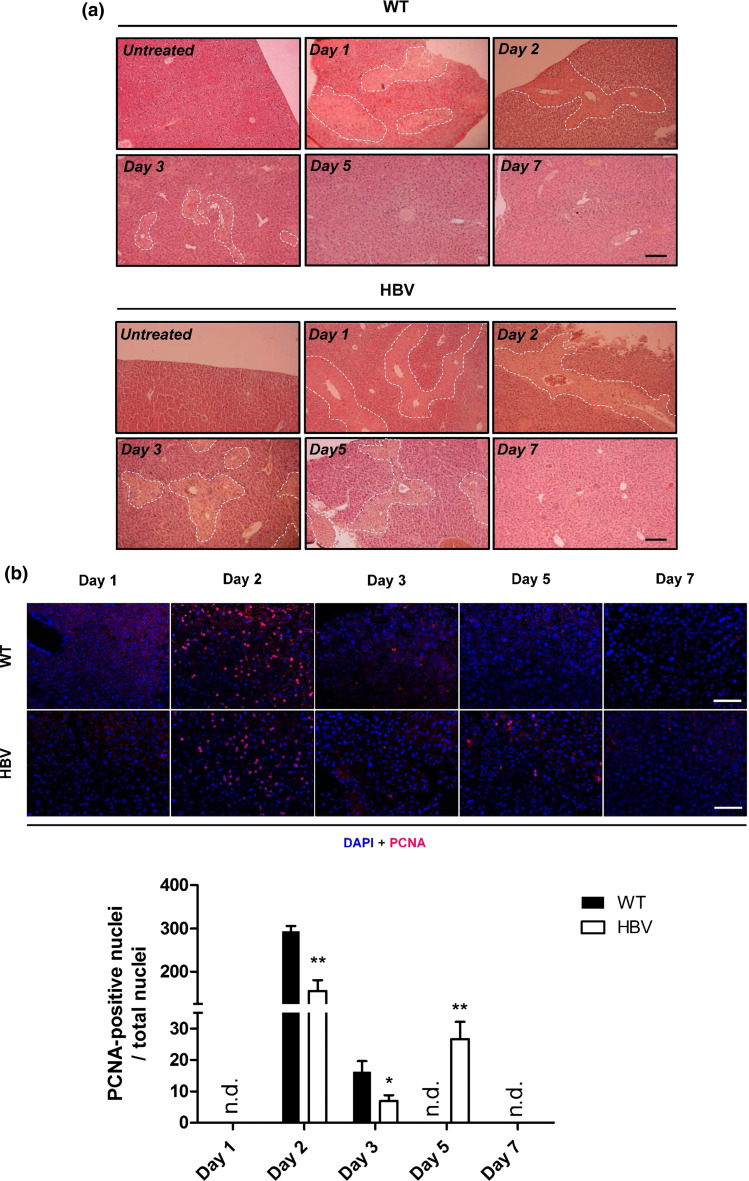
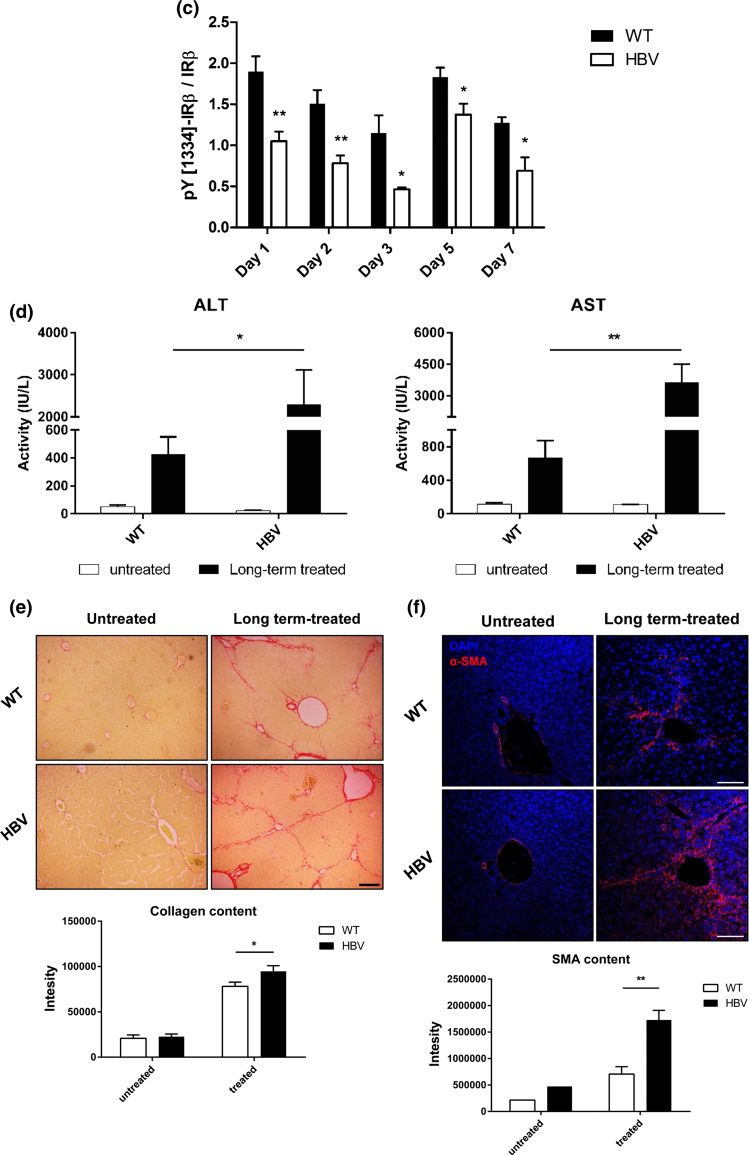
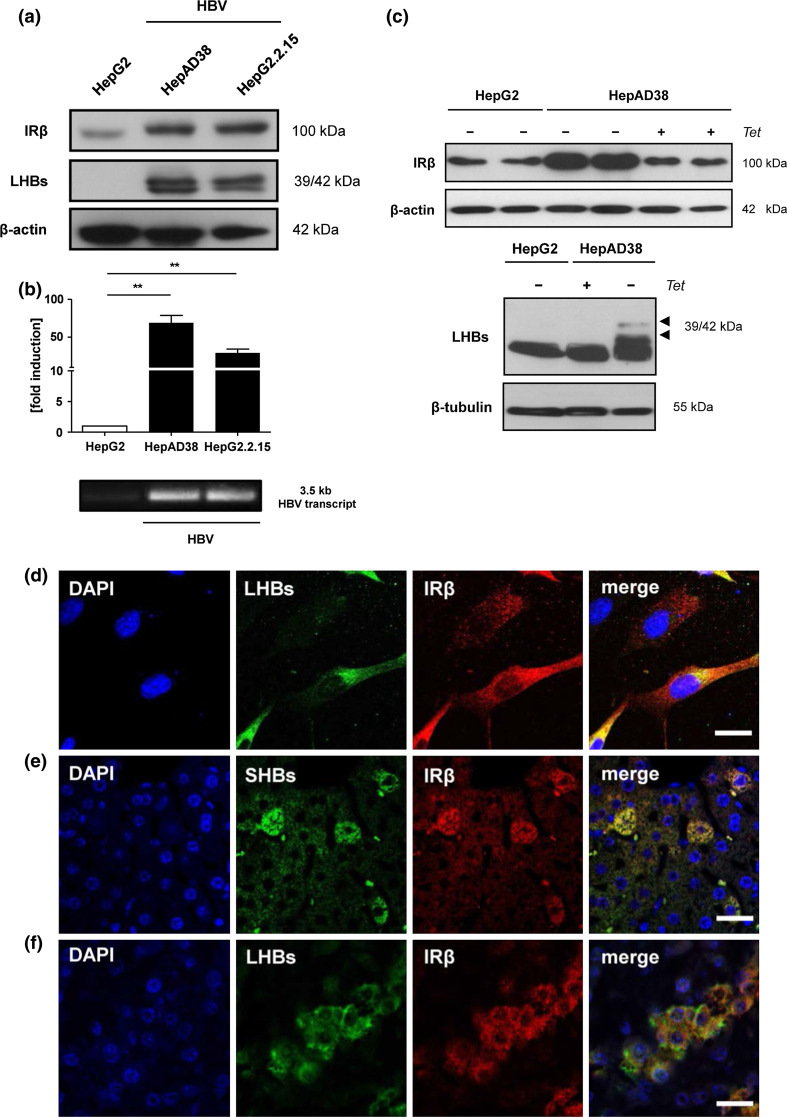
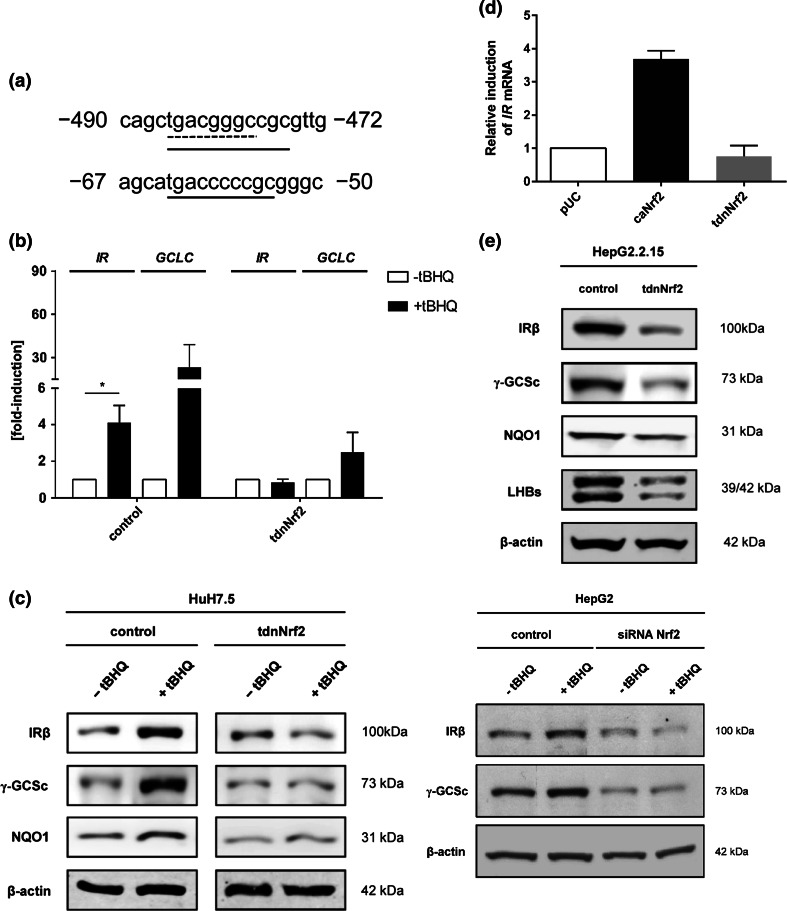
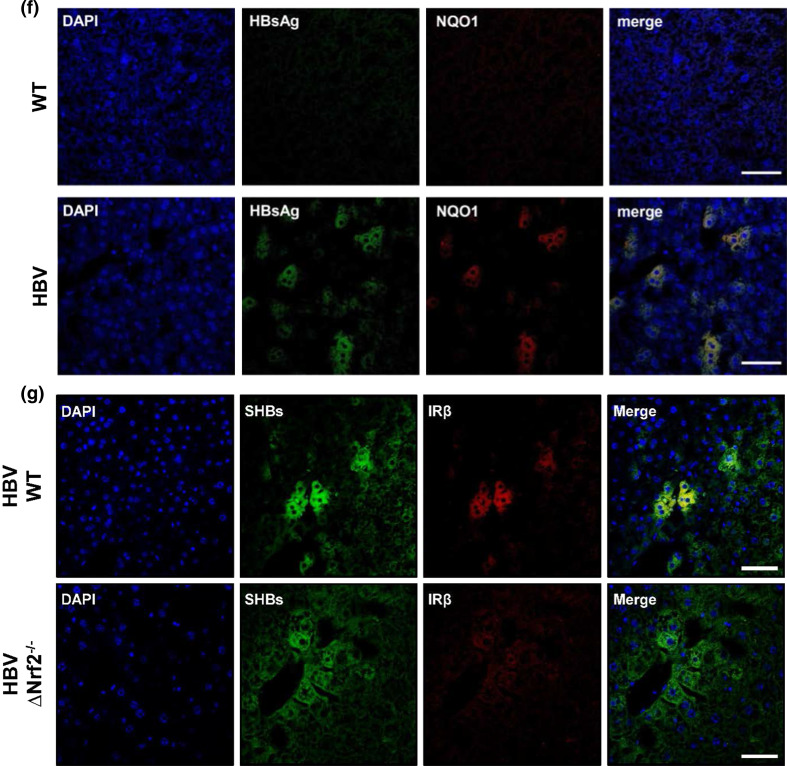
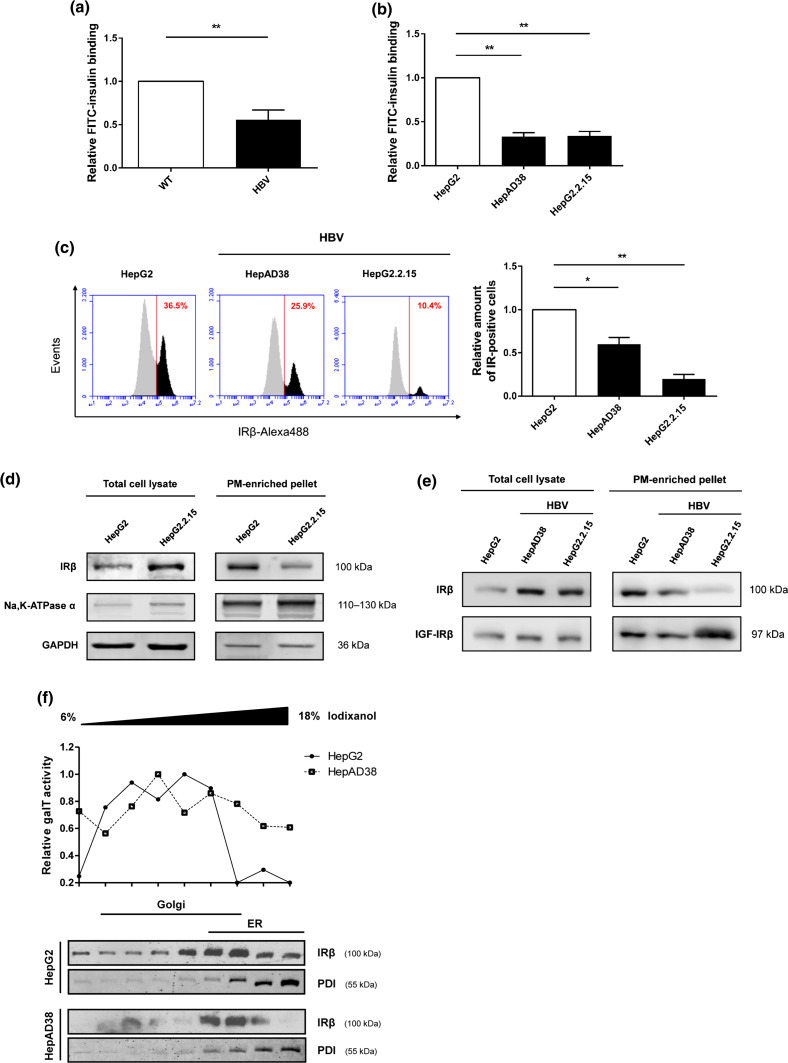
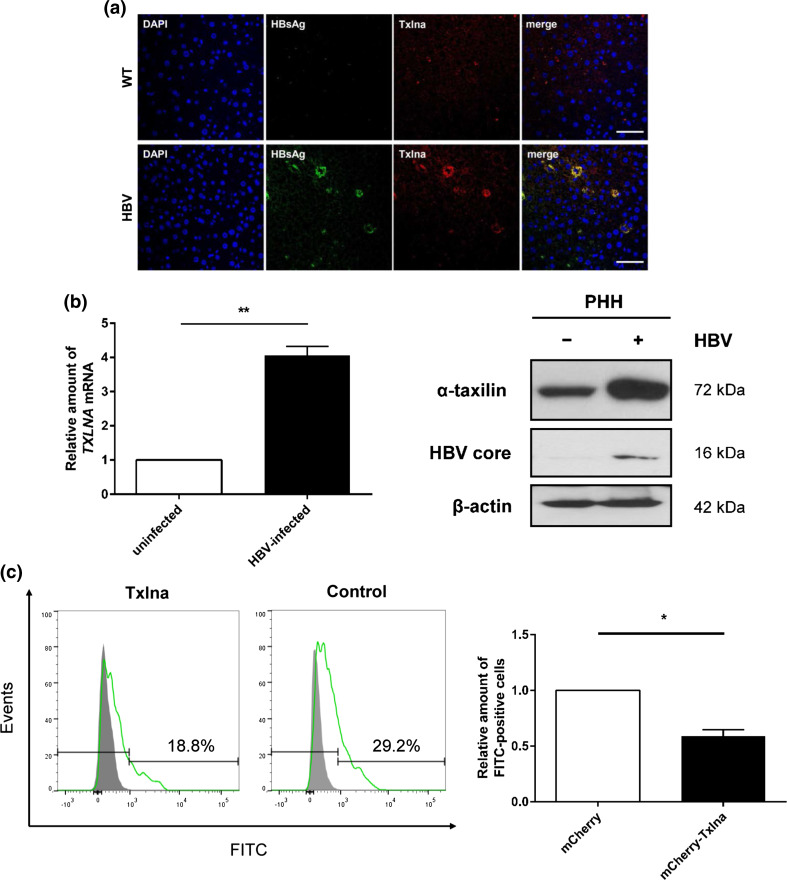
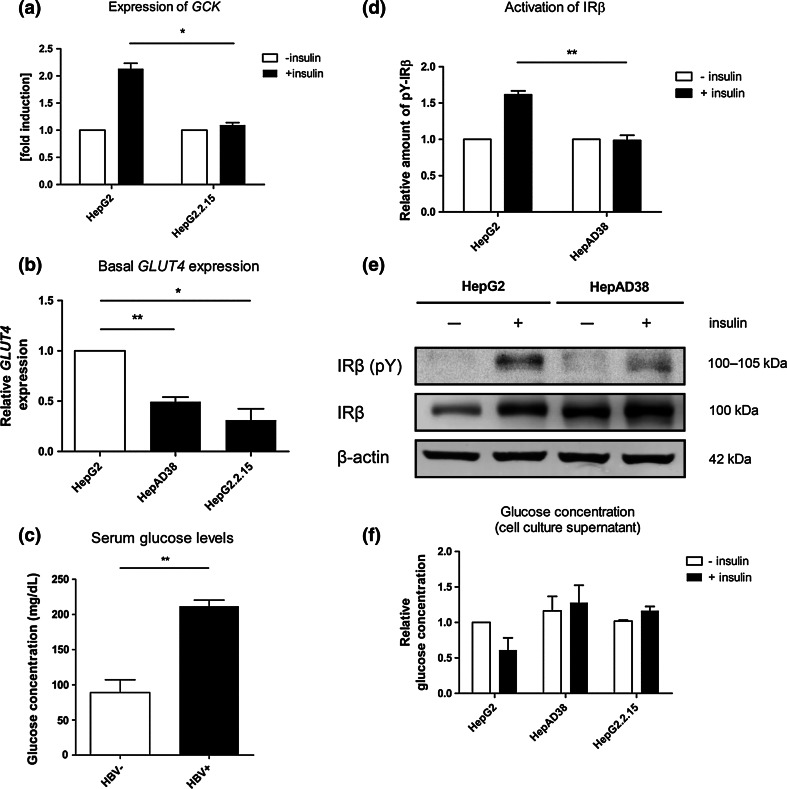
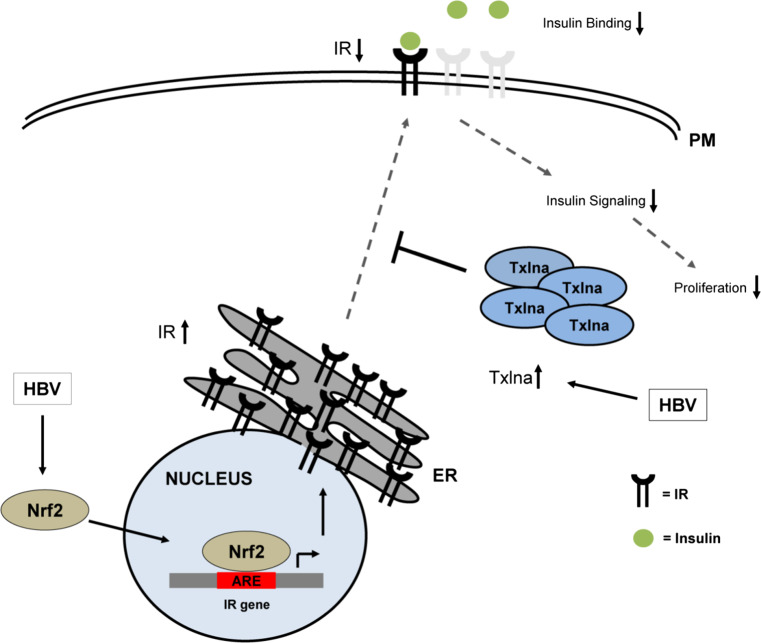
Hepatitis B virus (HBV) causes severe liver disease but the underlying mechanisms are incompletely understood. During chronic HBV infection, the liver is recurrently injured by immune cells in the quest for viral elimination. To compensate tissue injury, liver regeneration represents a vital process which requires proliferative insulin receptor signaling. This study aims to investigate the impact of HBV on liver regeneration and hepatic insulin receptor signaling. After carbon tetrachloride-induced liver injury, liver regeneration is delayed in HBV transgenic mice. These mice show diminished hepatocyte proliferation and increased expression of fibrosis markers. This is in accordance with a reduced activation of the insulin receptor although HBV induces expression of the insulin receptor via activation of NF-E2-related factor 2. This leads to increased intracellular amounts of insulin receptor in HBV expressing hepatocytes. However, intracellular retention of the receptor simultaneously reduces the amount of functional insulin receptors on the cell surface and thereby attenuates insulin binding in vitro and in vivo. Intracellular retention of the insulin receptor is caused by elevated amounts of α-taxilin, a free syntaxin binding protein, in HBV expressing hepatocytes preventing proper targeting of the insulin receptor to the cell surface. Consequently, functional analyses of insulin responsiveness revealed that HBV expressing hepatocytes are less sensitive to insulin stimulation leading to delayed liver regeneration. This study describes a novel pathomechanism that uncouples HBV expressing hepatocytes from proliferative signals and thereby impedes compensatory liver regeneration after liver injury.

Keywords: HBV; Insulin receptor signaling; Insulin resistance; Liver disease; Nrf2; α-Taxilin.


Conflict of interest statement

The authors declare that they have no conflicts of interest with the contents of this article.

Figures

Fig. 1
Fig. 1
Impaired liver regeneration and decreased insulin receptor activation in HBV transgenic mice after liver injury. a HE staining of representative liver sections (magnification ×100) of male wild type (WT) and HBV transgenic mice either untreated or at different time points after intraperitoneal injection of a single dose (0.27 mL/kg body weight) of CCl4. Hepatic lesions are outlined in white dashed lines. Five animals per group were analyzed with comparable results. Scale bar represents 500 µm. b PCNA staining of liver sections (magnification ×200) derived from male WT and HBV transgenic mice 1, 2, 3, 5, and 7 days after CCl4 treatment. Scale bar represents 50 µm. The graph represents the ratio of PCNA-positive nuclei and total nuclei (mean ± SEM) per visual field in male WT (n = 3) and HBV transgenic mice (n = 3 for day 1, day 5 and day 7, n = 4 for day 2 and day 3) after CCl4 treatment. Three visual fields have been analyzed per animal. n.d. not detectable. *p < 0.05, **p < 0.01. c Quantification of tyrosine-phosphorylated insulin receptor β (pY [1334]-IRβ) by phospho-IRβ-specific ELISA 1, 2, 3, 5 and 7 days after CCl4 treatment in liver lysates from male WT (n = 5 for day 1 and day 2, n = 3 for day 3, n = 4 for day 5 and day 7) and HBV transgenic mice (n = 7 for day 1, n = 5 for day 2, n = 4 for day 3, n = 3 for day 5 and day 7). The graph represents the ratio of pY-IRβ and the total amount of IRβ as determined by IRβ-specific ELISA (mean ± SEM). *p < 0.05, **p < 0.01. d ALT (left graph) and AST (right graph) activity was determined in the serum of untreated and CCl4 long-term-treated WT and HBV transgenic mice (0.17 mL/kg body weight). The graphs represent the mean ± SEM from six long-term-treated animals in each group (n = 6). The serum of untreated mice (WT: n = 2; HBV: n = 3) served as control. *p < 0.05, **p < 0.01. e Paraffin-embedded liver sections of CCl4 long-term-treated WT and HBV transgenic mice were deparaffinized, rehydrated and stained by Picro-sirius red. Representative images are shown in comparison to untreated animals (magnification ×100). The red color indicates collagenous fibers. Scale bar represents 500 μm. The amount of collagen was quantified by the intensity of the red color using ImageJ. The graph represents the mean ± SEM from untreated (WT: n = 3; HBV: n = 4) and long-term-treated WT (n = 10) and HBV transgenic (n = 10) mice. Five visual fields have been analyzed per animal. *p < 0.05. f Paraffin-embedded liver sections of CCl4 long-term-treated WT and HBV transgenic mice were deparaffinized, rehydrated and stained for α-SMA using a mouse-derived primary antibody and a donkey-derived Cy3-coupled anti-mouse secondary antibody (red fluorescence). Nuclei was visualized by DAPI (blue fluorescence) (magnification ×200). Scale bar represents 100 μm. Representative images are shown in comparison to untreated animals. The amount of α-SMA was quantified by the intensity of the red color using ImageJ. The graph represents the mean ± SEM from untreated (WT: n = 1; HBV: n = 1) and long-term-treated WT (n = 5) and HBV transgenic (n = 5) mice. Five visual fields have been analyzed per animal. **p ≤ 0.01
Fig. 1
Fig. 1
Impaired liver regeneration and decreased insulin receptor activation in HBV transgenic mice after liver injury. a HE staining of representative liver sections (magnification ×100) of male wild type (WT) and HBV transgenic mice either untreated or at different time points after intraperitoneal injection of a single dose (0.27 mL/kg body weight) of CCl4. Hepatic lesions are outlined in white dashed lines. Five animals per group were analyzed with comparable results. Scale bar represents 500 µm. b PCNA staining of liver sections (magnification ×200) derived from male WT and HBV transgenic mice 1, 2, 3, 5, and 7 days after CCl4 treatment. Scale bar represents 50 µm. The graph represents the ratio of PCNA-positive nuclei and total nuclei (mean ± SEM) per visual field in male WT (n = 3) and HBV transgenic mice (n = 3 for day 1, day 5 and day 7, n = 4 for day 2 and day 3) after CCl4 treatment. Three visual fields have been analyzed per animal. n.d. not detectable. *p < 0.05, **p < 0.01. c Quantification of tyrosine-phosphorylated insulin receptor β (pY [1334]-IRβ) by phospho-IRβ-specific ELISA 1, 2, 3, 5 and 7 days after CCl4 treatment in liver lysates from male WT (n = 5 for day 1 and day 2, n = 3 for day 3, n = 4 for day 5 and day 7) and HBV transgenic mice (n = 7 for day 1, n = 5 for day 2, n = 4 for day 3, n = 3 for day 5 and day 7). The graph represents the ratio of pY-IRβ and the total amount of IRβ as determined by IRβ-specific ELISA (mean ± SEM). *p < 0.05, **p < 0.01. d ALT (left graph) and AST (right graph) activity was determined in the serum of untreated and CCl4 long-term-treated WT and HBV transgenic mice (0.17 mL/kg body weight). The graphs represent the mean ± SEM from six long-term-treated animals in each group (n = 6). The serum of untreated mice (WT: n = 2; HBV: n = 3) served as control. *p < 0.05, **p < 0.01. e Paraffin-embedded liver sections of CCl4 long-term-treated WT and HBV transgenic mice were deparaffinized, rehydrated and stained by Picro-sirius red. Representative images are shown in comparison to untreated animals (magnification ×100). The red color indicates collagenous fibers. Scale bar represents 500 μm. The amount of collagen was quantified by the intensity of the red color using ImageJ. The graph represents the mean ± SEM from untreated (WT: n = 3; HBV: n = 4) and long-term-treated WT (n = 10) and HBV transgenic (n = 10) mice. Five visual fields have been analyzed per animal. *p < 0.05. f Paraffin-embedded liver sections of CCl4 long-term-treated WT and HBV transgenic mice were deparaffinized, rehydrated and stained for α-SMA using a mouse-derived primary antibody and a donkey-derived Cy3-coupled anti-mouse secondary antibody (red fluorescence). Nuclei was visualized by DAPI (blue fluorescence) (magnification ×200). Scale bar represents 100 μm. Representative images are shown in comparison to untreated animals. The amount of α-SMA was quantified by the intensity of the red color using ImageJ. The graph represents the mean ± SEM from untreated (WT: n = 1; HBV: n = 1) and long-term-treated WT (n = 5) and HBV transgenic (n = 5) mice. Five visual fields have been analyzed per animal. **p ≤ 0.01
Fig. 2
Fig. 2
Increased levels of insulin receptor in HBV expressing cells. a Western blot analysis of cellular lysates derived from HepG2, HepAD38 and HepG2.2.15 cells using a rabbit-derived IRβ-specific antiserum. HBV surface antigen (HBsAg) was detected using a mouse-derived LHBs-specific antiserum (Ma18/07). Detection of β-actin served as loading control. b rtPCR of IR-specific transcripts in HepG2, HepAD38 and HepG2.2.15 cells (n = 3, mean ± SEM) referred to GAPDH as internal control. IR expression in HepG2 cells was set as 1. 3.5 kb HBV-specific transcripts were amplified using HBV-specific primers and were visualized by agarose gel electrophoresis as shown below the graph. **p < 0.01. c Western blot analysis of cellular lysates derived from untreated HepG2 and HepAD38 cells and tetracyclin (Tet)-treated HepAD38 cells using a rabbit-derived IRβ-specific antiserum or a mouse-derived LHBs-specific antiserum. Detection of β-actin or β-tubulin served as loading control. d CLSM analysis of transiently HBV-transfected HuH7.5 cells (magnification ×1000), liver sections derived from an HBV transgenic mouse (magnification ×400) (e) and a patient with chronic hepatitis B (magnification ×400) (f). HBV expressing cells were visualized using mouse-derived LHBs- (Ma18/07) or goat-derived SHBs-specific antisera. For detection of IRβ a rabbit-derived antibody was used. Nuclei was visualized by DAPI. Scale bar represents 20 µm
Fig. 3
Fig. 3
Activation of Nrf2 induces insulin receptor expression. a Identification of putative ARE sequences (underlined) in the promoter region of the insulin receptor gene. The dashed line indicates a second, alternative ARE sequence. Numbers refer to the upstream position of the element within the promoter. b rtPCR of IR- and GCLC-specific transcripts in control (gfp) and transdominant negative Nrf2 (tdnNrf2) transfected HuH7.5 cells after treatment with tBHQ (mean ± SEM, n = 3). Unstimulated cells served as control and were set as 1. Values were referred to GAPDH as internal control. *p < 0.05. c Western blot analysis of cellular lysates derived from control and tdnNrf2-transfected HuH7.5 cells and control and Nrf2-specific siRNA-transfected HepG2 cells using IRβ-specific antiserum. Cells were stimulated with tBHQ or left untreated. A rabbit-derived γ-GCSc-specific and a mouse-derived NQO1-specific antiserum served for detection of Nrf2-dependent marker proteins. Detection of β-actin served as loading control. d rtPCR of IR-specific transcripts in HuH7.5 cells transfected with control (pUC), constitutively active Nrf2 (caNrf2) and transdominant negative Nrf2 mutant (tdnNrf2) (mean ± SEM, n = 2). Control transfected cells served as control and were set as 1. Values were referred to GAPDH as internal control. Successful transfection with Nrf2 mutant was confirmed by increased or reduced expression of classical Nrf2 target gene GPx1 (not shown). e Western blot analysis of cellular lysates derived from control and tdnNrf2 transfected HepG2.2.15 cells using IRβ-specific antiserum. A rabbit-derived γ-GCSc-specific and a mouse-derived NQO1-specific antiserum served for detection of Nrf2-dependent marker proteins. Detection of β-actin served as loading control. f Immunohistochemical staining of NQO1 in liver sections from WT and HBV transgenic mice (magnification ×400). HBV expressing cells were visualized using a goat-derived SHBs-specific antiserum. For detection of NQO1, a rabbit-derived antibody was used. Scale bar represents 50 µm. g Immunohistochemical staining of liver sections from HBV transgenic wild type (HBV WT) and HBV transgenic Nrf2 knock-out (HBV∆Nrf2−/−) mice (magnification ×400). HBV expressing cells were visualized using a goat-derived SHBs-specific antiserum. For detection of IRβ, a rabbit-derived antibody was used. Scale bar represents 50 µm
Fig. 3
Fig. 3
Activation of Nrf2 induces insulin receptor expression. a Identification of putative ARE sequences (underlined) in the promoter region of the insulin receptor gene. The dashed line indicates a second, alternative ARE sequence. Numbers refer to the upstream position of the element within the promoter. b rtPCR of IR- and GCLC-specific transcripts in control (gfp) and transdominant negative Nrf2 (tdnNrf2) transfected HuH7.5 cells after treatment with tBHQ (mean ± SEM, n = 3). Unstimulated cells served as control and were set as 1. Values were referred to GAPDH as internal control. *p < 0.05. c Western blot analysis of cellular lysates derived from control and tdnNrf2-transfected HuH7.5 cells and control and Nrf2-specific siRNA-transfected HepG2 cells using IRβ-specific antiserum. Cells were stimulated with tBHQ or left untreated. A rabbit-derived γ-GCSc-specific and a mouse-derived NQO1-specific antiserum served for detection of Nrf2-dependent marker proteins. Detection of β-actin served as loading control. d rtPCR of IR-specific transcripts in HuH7.5 cells transfected with control (pUC), constitutively active Nrf2 (caNrf2) and transdominant negative Nrf2 mutant (tdnNrf2) (mean ± SEM, n = 2). Control transfected cells served as control and were set as 1. Values were referred to GAPDH as internal control. Successful transfection with Nrf2 mutant was confirmed by increased or reduced expression of classical Nrf2 target gene GPx1 (not shown). e Western blot analysis of cellular lysates derived from control and tdnNrf2 transfected HepG2.2.15 cells using IRβ-specific antiserum. A rabbit-derived γ-GCSc-specific and a mouse-derived NQO1-specific antiserum served for detection of Nrf2-dependent marker proteins. Detection of β-actin served as loading control. f Immunohistochemical staining of NQO1 in liver sections from WT and HBV transgenic mice (magnification ×400). HBV expressing cells were visualized using a goat-derived SHBs-specific antiserum. For detection of NQO1, a rabbit-derived antibody was used. Scale bar represents 50 µm. g Immunohistochemical staining of liver sections from HBV transgenic wild type (HBV WT) and HBV transgenic Nrf2 knock-out (HBV∆Nrf2−/−) mice (magnification ×400). HBV expressing cells were visualized using a goat-derived SHBs-specific antiserum. For detection of IRβ, a rabbit-derived antibody was used. Scale bar represents 50 µm
Fig. 4
Fig. 4
Reduced amounts of surface-bound insulin receptor lead to decreased insulin binding in HBV expressing cells. a Primary hepatocytes from WT and HBV transgenic mice were incubated with FITC-labeled insulin and relative FITC-fluorescence was measured in a microplate fluorescent plate reader (n = 3, mean ± SEM). WT mouse cells were set as 1. **p < 0.01. b HepG2, HepAD38 and HepG2.2.15 cells were incubated with FITC-labeled insulin and relative FITC-fluorescence was measured in a microplate fluorescent plate reader (n = 3, mean ± SEM). HepG2 cells were set as 1. **p < 0.01. c Non-permeabilized HepG2, HepAD38 and HepG2.2.15 cells were incubated with a rabbit-derived IRβ-specific antiserum and a donkey-derived Alexa488-coupled anti-rabbit secondary antibody. Viable cells were gated by flow cytometry and percentage of cells expressing insulin receptor on the cell surface were analyzed. One representative histogram is shown of three independent experiments. As a control, the cells were only incubated with the donkey-derived Alexa488-coupled secondary antibody (gray-shaded peaks) to determine background fluorescence originating from the cells. Summary of flow cytometry analysis (n = 3, mean ± SEM) is shown in the diagram. HepG2 cells were set as 1. *p < 0.05, **p < 0.01. d Western blot analysis of total cellular lysates and plasma membrane-enriched fractions derived from HepG2 and HepG2.2.15 cells using rabbit-derived IRβ-specific antiserum. Enrichment of plasma membrane was confirmed by detection of membrane-localized Na+/K+-ATPase α and depletion of cytosolic GAPDH. Residual amounts of GAPDH after enrichment represent membrane-associated GAPDH. Similar results were obtained for stably HBV expressing HepAD38 cells. e Western blot analysis of total cellular lysates and plasma membrane-enriched fractions derived from HepG2, HepAD38 and HepG2.2.15 cells using rabbit-derived IRβ- and IGFRβ-specific antisera. f Cellular lysates from HepG2 and HepAD38 cells were used for subcellular fractionation by iodixanol density gradient centrifugation. Fractions were collected from top to bottom and analyzed by galactosyltransferase (galT) activity assay (upper panel) for the presence of Golgi membranes and the presence of IRβ and ER-resident protein PDI by western blot using rabbit-derived IRβ- and mouse-derived PDI-specific antisera (lower panel). Comparable results were obtained for HepG2.2.15 cells using a mouse-derived antiserum against calnexin as marker for ER in the western blot. The range of iodixanol concentration of the analyzed fractions is indicated above the graph in a. The fractions analyzed in the galT assay above the blot correspond to the fractions analyzed by western blot
Fig. 5
Fig. 5
Elevated amounts of α-taxilin in HBV expressing cells contribute to insulin receptor retention. a Immunohistochemical staining of α-taxilin (Txlna) in liver sections derived from WT and HBV transgenic mice (magnification ×200). HBV expressing cells were visualized using a goat-derived SHBs-specific antiserum. For detection of Txlna, a rabbit-derived antibody was used. Scale bar represents 50 µm. b rtPCR of TXLNA-specific transcripts in HBV-infected (MOI = 5) primary human hepatocytes (PHH) and uninfected controls (n = 3, mean ± SEM) referred to GAPDH as internal control. Uninfected cells were set as 1. **p < 0.01. The western blot shows the amount of α-taxilin in cellular lysates derived from HBV-infected and uninfected PHH using a rabbit-derived α-taxilin-specific antiserum and for detection of HBV core protein a mouse-derived HBV core-specific antiserum. Detection of β-actin served as loading control. c HuH7.5 cells were either transfected with a plasmid encoding an mCherry-tagged α-taxilin fusion protein or mCherry alone (control) and were then incubated with 100 nM FITC-insulin. mCherry-Txlna or mCherry-expressing cells were gated by flow cytometry and analyzed for FITC-fluorescence. Gray-shaded peaks represent background fluorescence originating from cells that were not incubated with FITC-insulin. Representative histogram shows percentage of FITC-insulin-positive cells from mCherry-Txlna or mCherry-expressing control cells. Summary of flow cytometry analysis (n = 4, mean ± SEM) is shown in the diagram. Control cells were set as 1. *p < 0.05
Fig. 6
Fig. 6
Reduced insulin responsiveness in HBV expressing cells. a, b Activation of IRβ by tyrosine phosphorylation (pY) was determined by phospho-IRβ-specific ELISA (a) and western blot (b) of cellular lysates of HepG2 and HepAD38 with and without addition of 100 nM insulin for 20 min (ELISA) or 5 min (western blot) using a rabbit-derived phospho-IRβ-specific antiserum. Total amount of IRβ was determined by western blot using a rabbit-derived IRβ-specific antiserum. Detection of β-actin served as loading control. Unstimulated cells in a were set as 1. **p < 0.01. c Glucose concentration was measured in the cell culture supernatant before and after insulin stimulation for 12 h with 100 nM insulin. Experiment was performed in duplicate. Unstimulated HepG2 cells were set as 1. d rtPCR of GCK-specific transcripts in HepG2 and HepG2.2.15 cells before and after stimulation for 2–4 h with 100 nM insulin (n = 3, mean ± SEM). Values were referred to RPL27 as internal control. Unstimulated cells were set as 1. *p < 0.05. e rtPCR of GLUT4-specific transcripts in HepG2, HepAD38 and HepG2.2.15 cells (n = 5, mean ± SEM). Values were referred to RPL27 as internal control. HepG2 were set as 1. *p < 0.05, **p < 0.01. f Serum glucose concentration of 2–6 month old HBV-negative (HBV−) and HBV transgenic (HBV+) mice (n = 3, two males and one female per group, mean ± SEM). **p < 0.01
Fig. 7
Fig. 7
Schematic representation of HBV-induced insulin receptor retention. HBV induces activation of Nrf2 which translocates to the nucleus and activates ARE-mediated expression of the insulin receptor (IR). In parallel, HBV also induces increased amounts of α-taxilin (Txlna) which prevent insulin receptor translocation to the plasma membrane (PM) resulting in accumulation of the insulin receptor at the endoplasmic reticulum (ER). Reduced amounts of the insulin receptor at the plasma membrane attenuate insulin binding and lead to inhibition of insulin receptor signaling and retardation of hepatocyte proliferation

Similar articles

Cited by

References

    1. Schädler S, Hildt E. HBV life cycle: entry and morphogenesis. Viruses. 2009;1:185–209. doi: 10.3390/v1020185. - DOI - PMC - PubMed
    1. Liang TJ, Block TM, McMahon BJ, Ghany MG, Urban S, Guo J, et al. Present and future therapies of hepatitis B: from discovery to cure. Hepatology. 2015;62:1893–1908. doi: 10.1002/hep.28025. - DOI - PMC - PubMed
    1. Arzumanyan A, Reis H, Feitelson MA. Pathogenic mechanisms in HBV- and HCV-associated hepatocellular carcinoma. Nat Rev Cancer. 2013;13:123–135. doi: 10.1038/nrc3449. - DOI - PubMed
    1. Lupberger J, Hildt E. Hepatitis B virus-induced oncogenesis. World J Gastroenterol. 2007;13:74. doi: 10.3748/wjg.v13.i1.74. - DOI - PMC - PubMed
    1. Dhanasekaran R, Limaye A, Cabrera R. Hepatocellular carcinoma: current trends in worldwide epidemiology, risk factors, diagnosis, and therapeutics. Hepat Med. 2012;4:19–37. - PMC - PubMed

Publication types

MeSH terms

LinkOut - more resources