. 2016 Aug;72(2):479-92.
doi: 10.1007/s00248-016-0775-z. Epub 2016 May 7.

Nitrate and the Origin of Saliva Influence Composition and Short Chain Fatty Acid Production of Oral Microcosms

Affiliations

Nitrate and the Origin of Saliva Influence Composition and Short Chain Fatty Acid Production of Oral Microcosms

Jessica E Koopman et al. Microb Ecol. 2016 Aug.

Abstract

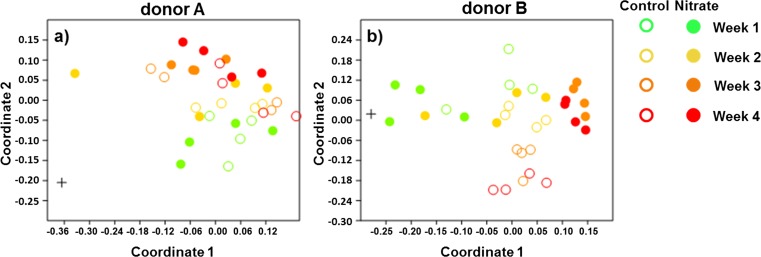
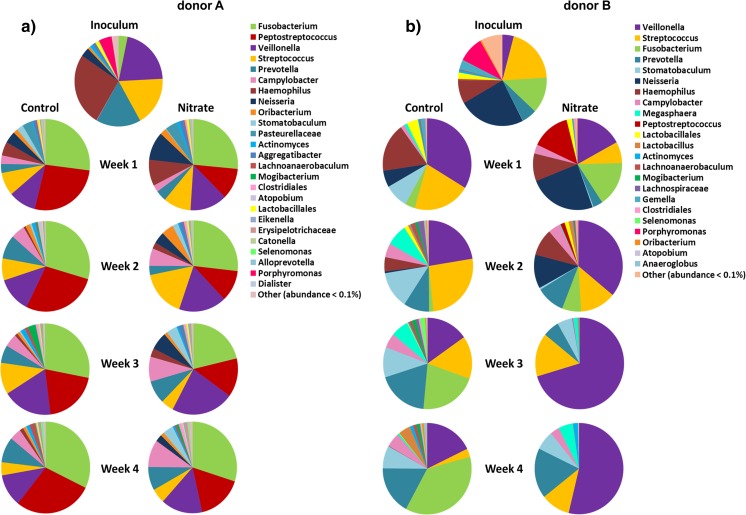
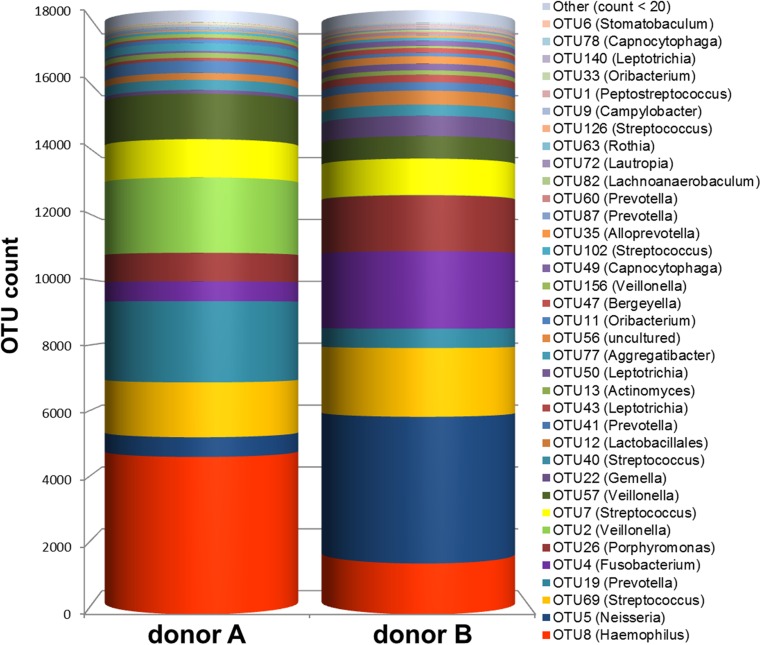
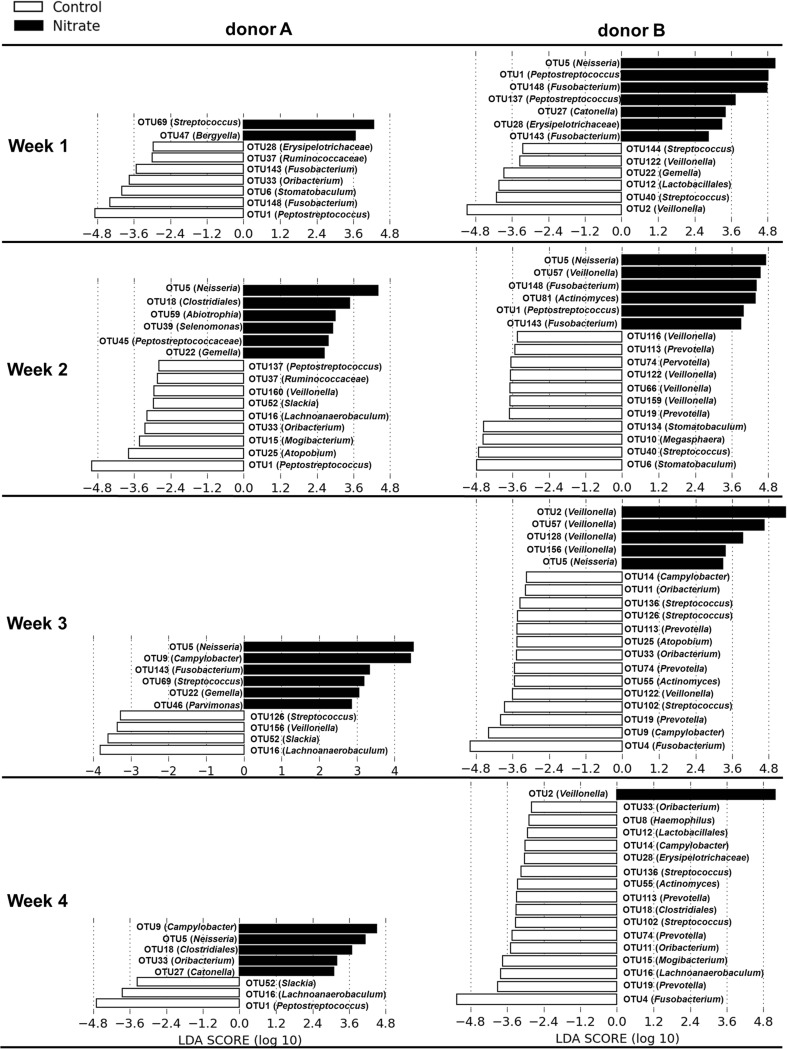
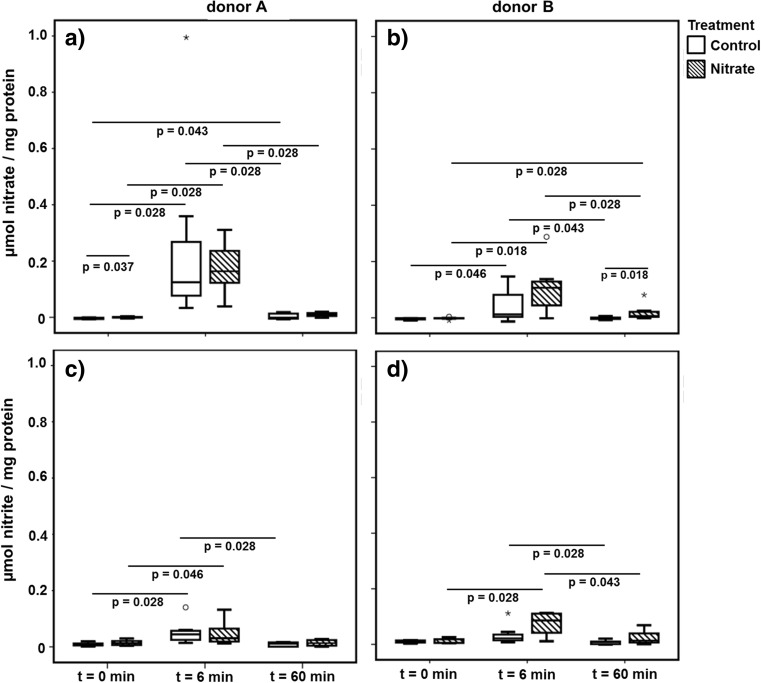
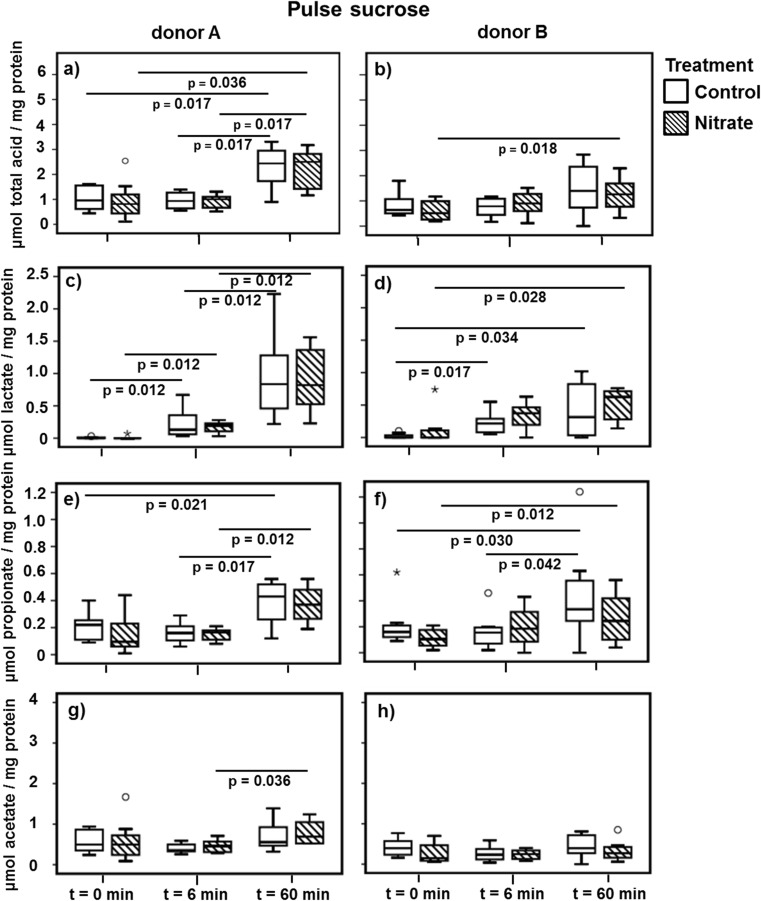
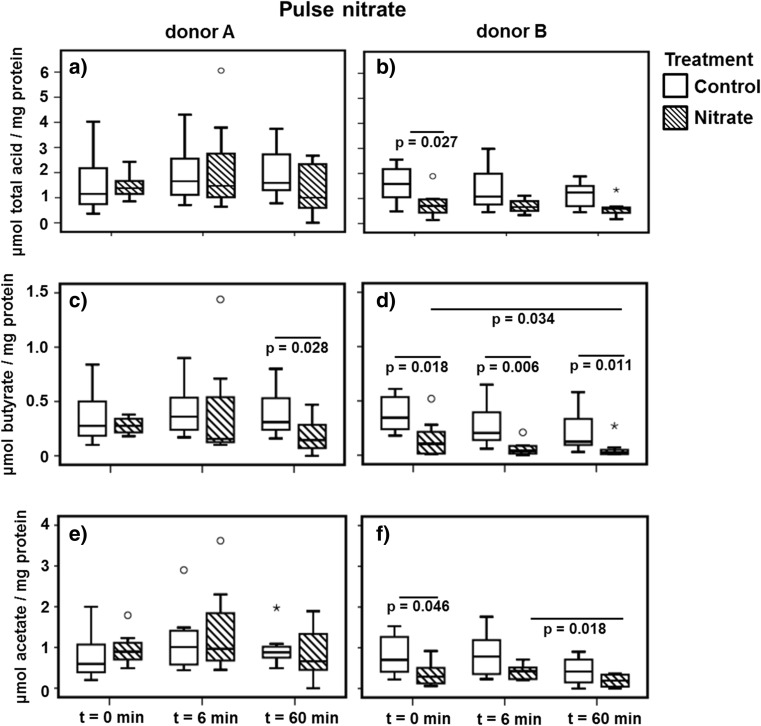
Nitrate is emerging as a possible health benefactor. Especially the microbial conversion of nitrate to nitrite in the oral cavity and the subsequent conversion to nitric oxide in the stomach are of interest in this regard. Yet, how nitrate influences the composition and biochemistry of the oral ecosystem is not fully understood. To investigate the effect of nitrate on oral ecology, we performed a 4-week experiment using the multiplaque artificial mouth (MAM) biofilm model. This model was inoculated with stimulated saliva of two healthy donors. Half of the microcosms (n = 4) received a constant supply of nitrate, while the other half functioned as control (n = 4). Additionally, all microcosms received a nitrate and sucrose pulse, each week, on separate days to measure nitrate reduction and acid formation. The bacterial composition of the microcosms was determined by 16S rDNA sequencing. The origin of the saliva (i.e., donor) showed to be the strongest determinant for the development of the microcosms. The supplementation of nitrate was related to a relatively high abundance of Neisseria in the microcosms of both donors, while Veillonella was highly abundant in the nitrate-supplemented microcosms of only one of the donors. The lactate concentration after sucrose addition was similarly high in all microcosms, irrespective of treatment or donor, while the concentration of butyrate was lower after nitrate addition in the nitrate-receiving microcosms. In conclusion, nitrate influences the composition and biochemistry of oral microcosms, although the result is strongly dependent on the inoculum.

Keywords: Neisseria; Nitrate reduction; Oral microbiome; Short chain fatty acids; Veillonella.


Figures

Fig. 1
Fig. 1
Nonmetric multidimensional scaling plots based on the three-dimensional Bray-Curtis similarity index based on time and treatment. The plots depict the similarities between the microcosms derived from donor A (stress 0.1027) (a) and the similarities between the microcosms derived from donor B (stress 0.1340) (b). The plus symbol represents the inoculum, the open dots represent the control microcosms, and the solid dots represent the nitrate treatment. The green dots represent week 1, the yellow dots represent week 2, the orange dots represent week 3, and the red dots represent week 4
Fig. 2
Fig. 2
The relative abundance of genera for donor A (a) and donor B (b) per time point and treatment. Pie charts based on the average abundance of the most prevalent genera in the inoculum and per week, per treatment
Fig. 3
Fig. 3
OTUs in the inoculum of each donor. The bar chart shows the total count of the most abundant OTUs in the inoculum of donor A and donor B. Other (count < 20) is the sum of all OTUs that were counted less than 20 times
Fig. 4
Fig. 4
Differentially abundant OTUs between the two treatments at each time point per donor. The OTUs that were identified as differentially abundant through linear discriminant analysis effect (LEfSe) size score between the two treatments are displayed in the histogram. The white bars represent OTUs that were associated with the control group; the black bars represent OTUs that were associated with the nitrate group
Fig. 5
Fig. 5
Reduction of nitrate and formation of nitrite after the addition of nitrate to the microcosms. The boxplots represent the amount of nitrate (a, b) and nitrite (c, d) in the microcosms before the addition of nitrate (t = 0 min) and after the addition of nitrate (t = 6 min and t = 60 min) for both treatments. The significance (p < 0.05) of the difference in nitrate or nitrite concentration between the time points of the same treatment was tested using the Wilcoxon signed ranks test. The significance (p < 0.05) of the difference in concentration between the treatments at a single time point was tested using the Mann-Whitney test. The boxes represent the median and interquartile range (IQR) and outliers more than 1.5× IQR are depicted by circles and more than 3× IQR by stars
Fig. 6
Fig. 6
Short chain fatty acid concentrations before and after the addition of sucrose to the microcosms. The boxplots represent the concentration of all short chain fatty acids combined (a, b) (including succinate, formate, and butyrate), lactate (c, d), propionate (e, f), and acetate (g, h) before (t = 0 min) and after (t = 6 min and t = 60 min) the addition of sucrose. The significance (p < 0.05) of the difference in acid concentration between the time points of the same treatment was tested using the Wilcoxon signed ranks test. The boxes represent the median and interquartile range (IQR), and outliers more than 1.5× IQR are depicted by circles and more than 3× IQR by stars
Fig. 7
Fig. 7
Short chain fatty acid concentrations before and after the addition of nitrate to the microcosms. The boxplots represent the concentration of all short chain fatty acids combined (a, b) (including lactate, succinate, formate, and propionate), butyrate (c, d), and acetate (e, f) before (t = 0 min) and after (t = 6 min and t = 60 min) the addition of nitrate. The significance (p < 0.05) of the difference in acid concentration between the time points of the same treatment was tested using the Wilcoxon signed ranks test. The significance (p < 0.05) of the difference in acid concentration between the treatments at a single time point was tested using the Mann-Whitney test. The boxes represent the median and interquartile range (IQR), and outliers more than 1.5× IQR are depicted by circles and more than 3× IQR by stars

References

    1. Forman D, Al-Dabbagh S, Doll R. Nitrates, nitrites and gastric cancer in Great Britain. Nature. 1985;313:620–625. doi: 10.1038/313620a0. - DOI - PubMed
    1. Tannenbaum SR, Correa P. Nitrate and gastric cancer risks. Nature. 1985;317:675–676. doi: 10.1038/317675b0. - DOI - PubMed
    1. Knobeloch L, Salna B, Hogan A, Postle J, Anderson H. Blue babies and nitrate-contaminated well water. Environ Health Perspect. 2000;108:675–678. doi: 10.1289/ehp.00108675. - DOI - PMC - PubMed
    1. Granli T, Dahl R, Brodin P, Bockman OC. Nitrate and nitrite concentrations in human saliva: variations with salivary flow-rate. Food Chem Toxicol. 1989;27:675–680. doi: 10.1016/0278-6915(89)90122-1. - DOI - PubMed
    1. Andersson R. Nitrate reduction during fermentation by Gram-negative bacterial activity in carrots. Int J Food Microbiol. 1985;2:219–225. doi: 10.1016/0168-1605(85)90012-1. - DOI

MeSH terms

LinkOut - more resources