. 2016 May 17;44(5):1127-39.
doi: 10.1016/j.immuni.2016.03.007. Epub 2016 May 3.

Transforming Growth Factor-β Signaling Guides the Differentiation of Innate Lymphoid Cells in Salivary Glands

Affiliations

Transforming Growth Factor-β Signaling Guides the Differentiation of Innate Lymphoid Cells in Salivary Glands

Victor S Cortez et al. Immunity. .

Abstract

The signals guiding differentiation of innate lymphoid cells (ILCs) within tissues are not well understood. Salivary gland (SG) ILCs as well as liver and intestinal intraepithelial ILC1 have markers that denote tissue residency and transforming growth factor-β (TGF-β) imprinting. We deleted Tgfbr2 in cells expressing the ILC and NK marker NKp46 and found that SG ILCs were reduced in number. They lost distinct tissue markers, such as CD49a, and the effector molecules TRAIL and CD73. Expression of the transcription factor Eomes, which promotes NK cell differentiation, was elevated. Conversely, Eomes deletion in NKp46(+) cells enhanced TGF-β-imprinting of SG ILCs. Thus, TGF-β induces SG ILC differentiation by suppressing Eomes. TGF-β acted through a JNK-dependent, Smad4-independent pathway. Transcriptome analysis demonstrated that SG ILCs had characteristic of both NK cells and ILC1. Finally, TGF-β imprinting of SG ILCs was synchronized with SG development, highlighting the impact of tissue microenvironment on ILC development.

Keywords: TGF-β; development; innate lymphoid cells; salivary gland; signaling; transcription factors.


Figures

Figure 1
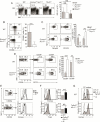
Figure 1. Impact of TGF-βRII deficiency on the distinct phenotype of SG ILCs
(A) Relative expression of Tgfb1, Tgfb2, and Tgfb3 from different tissues of WT mice determined by qPCR. n = 3 mice. (B) Frequencies and absolute numbers of SG ILCs (NK1.1+CD3CD45+) from WT and Tgfbr2f/f x Ncr1Cre mice. n = 8-10 mice per group. (C) Expression of CD49a and CD49b by SG ILCs from WT and Tgfbr2f/f x Ncr1Cre mice. n = 8 mice. (D) Expression of tissue markers and NK cell markers by SG ILCs from WT and Tgfbr2f/f x Ncr1Cre mice (horizontal black bars represent negative staining). n = at least 5 mice per group. (E-F) Expression of (E) TRAIL and (F) CD39 and CD73 (within CD39 gates) ex vivo on SG ILCs from WT and Tgfbr2f/f x Ncr1Cre mice. n = at least 6 mice per group. (G and H) Expression of (G) intracellular IFN-γ and (H) surface CD107a after stimulation with IL-12 plus IL-18 or PMA and ionomycin of SG ILC from WT and Tgfbr2f/f x Ncr1Cre mice. n = 5 mice per group. (A) All gene values were normalized to the expression of the housekeeping gene Gapdh. (B-H) Data are presented as mean ± SD and are representative of at least three independent experiments. Student's t test, *p <0.05, **p < 0.01, ***p <0.001 for comparisons between WT control and Tgfbr2f/f x Ncr1Cre groups. See also Figure S1.
Figure 2
Figure 2. TGF-β is sufficient to induce SG ILC phenotypic markers on NK cells
(A) Expression of SG ILC markers on purified splenic NK cells from WT or Tgfbr2f/f x Ncr1Cre after 7 days in culture with either IL-2 or IL-2 TGF-β1. Control is staining for the indicated markers directly after purification of NK cells on day 0. (B) MFI of the indicated markers on day 0, 3, 5, and 7 in NK cell cultures from WT or Tgfbr2f/f x Ncr1Cre in the presence of either IL-2 or IL-2 plus TGF-β1. (A-B) Data are representative of at least two independent experiments for each time point. See also Figure S2.
Figure 3
Figure 3. Reciprocal effects of Eomes and TGF-β on SG ILCs differentiation
(A) Frequencies and absolute numbers of SG ILCs from WT, Eomesf/f x Ncr1Cre, and Tbx21−/− mice. n= at least 5 mice per group. (B) Expression of CD49a and CD49b by SG ILCs from WT and Eomesf/f x Ncr1Cre mice. n= 6 mice. (C) Expression of NKp46 and CD103 on SG ILCs from WT and Eomesf/f x Ncr1Cre mice. n = 5-6 mice per group. (D) Expression of CD39 and CD73 (within CD39LO-HI gates) on SG ILCs from WT and Eomesf/f x Ncr1Cre mice. n = 4 mice per group. (E) Overlay of histograms showing Eomes expression in CD49aHi versus CD49a and CD103Hi versus CD103 populations of SG ILCs. (F) Expression of intracellular Eomes and T-bet from SG ILCs of WT and Tgfbr2f/f x Ncr1Cre mice. n = 6 mice per group. (G) Eomes expression in purified splenic CD49b+ NK cells from WT or Tgfbr2f/f x Ncr1Cre mice after 7 days in culture with either IL-2 or IL-2 plus TGF-β1. IC = isotype control. (A-D and F) Data are presented as mean ± SD and are representative of at least two independent experiments. Student's t test, **p < 0.01, ***p <0.001 for comparisons between WT control and Eomesf/f x Ncr1Cre, Tbx21−/− groups. (E and G) Data are representative of at least two independent experiments with 3 mice per group. See also Figure S3.
Figure 4
Figure 4. SG ILCs require non-canonical TGF-β signaling for their distinct phenotype
(A) Frequencies and absolute numbers of SG ILCs from WT and Smad4f/f x Ncr1Cre mice. n = 8 mice per group. (B) Expression of CD49a and CD49b by SG ILCs from WT and Smad4f/f x Ncr1Cre mice. n= 8 mice. (C) Expression of the indicated markers on SG ILCs from WT and Smad4f/f x Ncr1cre mice. n = at least 4 mice per group (D) CD103, TRAIL, and CD73 expression on splenic NK cells from Smad4f/f x Ncr1Cre mice after 7 days in culture with either IL-2 or IL-2 plus TGF-β1. (E) TRAIL, CD73, and CD49a expression on splenic NK cells from WT mice after 3 days in culture with IL-2 or IL-2 plus TGF-β1 in the presence of DMSO or the JNK inhibitor SP600125. SP600125 or DMSO were added at day 1 and 2 of culture. (A) Data are presented as mean ± SD. (B-E) Data are representative of at least two independent experiments with at least 3 mice per group. See also Figure S4.
Figure 5
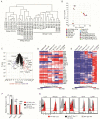
Figure 5. Microarray analysis of CD49a+ SG ILC
(A) Unsupervised hierarchical cluster analysis of CD49a+ SG ILCs and group 1, group 2, and group 3 ILC populations from indicated tissues. (B) Supervised principal component analysis of CD49a+ SG ILCs and indicated group 1, group 2, and group 3 ILC populations from tissues. (C) Comparison of gene expression of splenic NK cells (n=3 replicates) and CD49a+ SG ILCs (n=3 replicates) by volcano plot; colored dots indicate transcripts significantly upregulated by at least four-fold. (D) Heatmap of the expression of selected genes normalized by the indicated group 1 ILCs. (E) Heat map of the transcripts significantly upregulated at least two-fold between CD49a+ SG ILCs and splenic NK cells, in comparison to other group 1 ILCs. (F) Relative expression of Gzma, Gzmb, and Gzmc from sort purified WT SG ILCs (NK1.1+CD3CD45+), Tgfbr2f/f x Ncr1Cre SG ILCs (NK1.1+CD3CD45+), and WT splenic NK cells (NK1.1+CD3CD45+). (G) Staining of indicated markers on WT SG ILCs, Tgfbr2f/f x Ncr1Cre SG ILCs, and WT splenic NK cells (horizontal black bars represent negative staining). Staining's are representative of at least 2 independent experiments. Student's t test, *p <0.05, ***p <0.001 for comparisons between WT control and Tgfbr2f/f x Ncr1Cre groups. See also Figure S5.
Figure 6
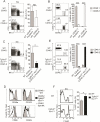
Figure 6. Impact of TGF-β on tissue residency and survival of SG ILCs
(A) Frequency of SG ILCs after four weeks of parabiosis between WT (CD45.1) and WT (CD45.2) mice. n= 4 parabiont pairs (B) Relative frequency of host derived or donor-derived SG ILCs from WT (CD45.1) and WT (CD45.2) parabiont pairs. (C) Frequency of SG ILCs after four weeks of parabiosis between WT (CD45.1) and Tgfbr2f/f x Ncr1Cre (CD45.2) mice. n= 3 parabiont pairs (D) Relative frequency of host or donor-derived SG ILCs from WT (CD45.1) or Tgfbr2f/f x Ncr1Cre (CD45.2) parabiont pairs. (E) Expression of indicated markers on host derived SG ILCs from WT (CD45.1) or Tgfbr2f/f x Ncr1Cre (CD45.2) parabiont pairs. (F) Frequency of cell death of SG ILC from WT or Tgfbr2f/f x Ncr1Cre mice after 1 hr culture in PBS. n= 4 mice per group. (A-C and E) Student's t test, *p <0.05, **p < 0.01, ***p <0.001 for comparisons between WT control and Tgfbr2f/f x Ncr1Cre groups. See also Figure S6.
Figure 7
Figure 7. TGF-β imprinting on SG ILC is age dependent
(A) Relative expression of Tgfb1, Tgfb2, and Tgfb3 from SG of young or adult WT mice determined by qPCR. n = 3 mice. (B) Expression of CD49a and CD49b by SG ILCs from WT young (3-5 weeks) and WT adult (10 weeks or older) mice. n= 5 mice per group. (C) Expression of indicated markers on SG ILCs from young mice, adult mice, and splenic NK cells of adult mice. n = 3 mice per group. (D) Comparison of gene expression of CD49a+ SG ILCs and CD49a SG ILCs of 6 week old mice; colored dots indicate transcripts upregulated by at least twofold. (E) Supervised principal component analysis of CD49a+ SG ILCs and CD49a SG ILCs in comparison to other group 1 ILCs. (F) Frequencies and absolute numbers of SG ILCs from young or adult WT and Nfil3−/− mice. n = at least 3 mice per group. (G) SG ILCs expression of CD49a and CD49b from young and adult Nfil3−/− mice. n = at least 3 mice per group All gene values were normalized to the expression of the housekeeping gene Gapdh. (A and F) Data are presented as mean ± SD and are representative of at least two independent experiments. Student's t test, *p <0.05, **p < 0.01, for comparisons between young and adult WT control and Nfil3−/− groups. (B-C) Data are representative of 3 independent experiments. See also Figure S7.

References

    1. Atarashi K, Tanoue T, Oshima K, Suda W, Nagano Y, Nishikawa H, Fukuda S, Saito T, Narushima S, Hase K, et al. Treg induction by a rationally selected mixture of Clostridia strains from the human microbiota. Nature. 2013;500:232–236. - PubMed
    1. Constantinides MG, McDonald BD, Verhoef PA, Bendelac A. A committed precursor to innate lymphoid cells. Nature. 2014;508:397–401. - PMC - PubMed
    1. Cortez VS, Fuchs A, Cella M, Gilfillan S, Colonna M. Cutting edge: Salivary gland NK cells develop independently of Nfil3 in steady-state. J. Immunol. 2014;192:4487–4491. - PubMed
    1. Curotto de Lafaille MA, Lafaille JJ. CD4(+) regulatory T cells in autoimmunity and allergy. Curr. Opin. Immunol. 2002;14:771–778. - PubMed
    1. Daussy C, Faure F, Mayol K, Viel S, Gasteiger G, Charrier E, Bienvenu J, Henry T, Debien E, Hasan UA, et al. T-bet and Eomes instruct the development of two distinct natural killer cell lineages in the liver and in the bone marrow. J. Exp. Med. 2014;211:563–577. - PMC - PubMed

MeSH terms

Substances