. 2016 May 19;165(5):1120-1133.
doi: 10.1016/j.cell.2016.04.029. Epub 2016 May 5.

Developmental Acquisition of Regulomes Underlies Innate Lymphoid Cell Functionality

Affiliations

Developmental Acquisition of Regulomes Underlies Innate Lymphoid Cell Functionality

Han-Yu Shih et al. Cell. .

Abstract

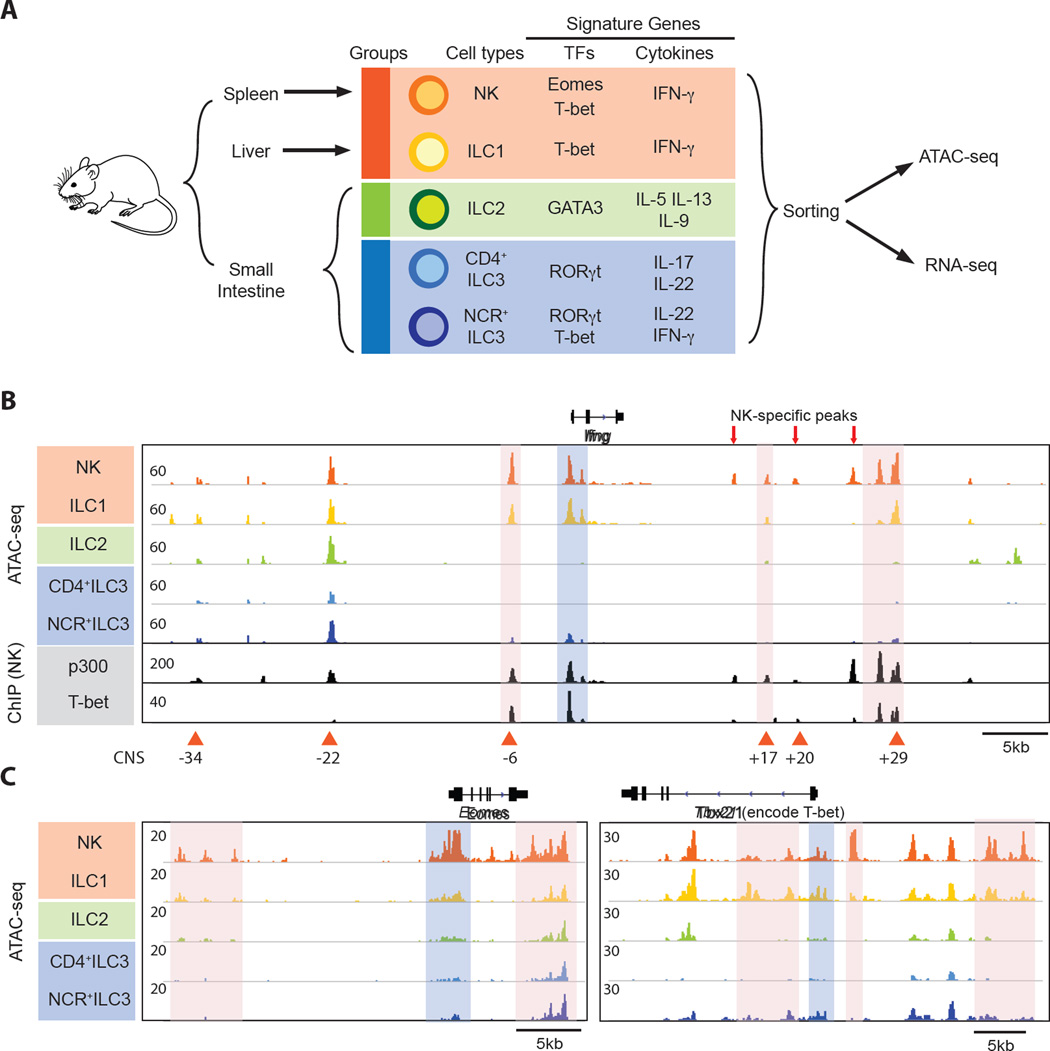
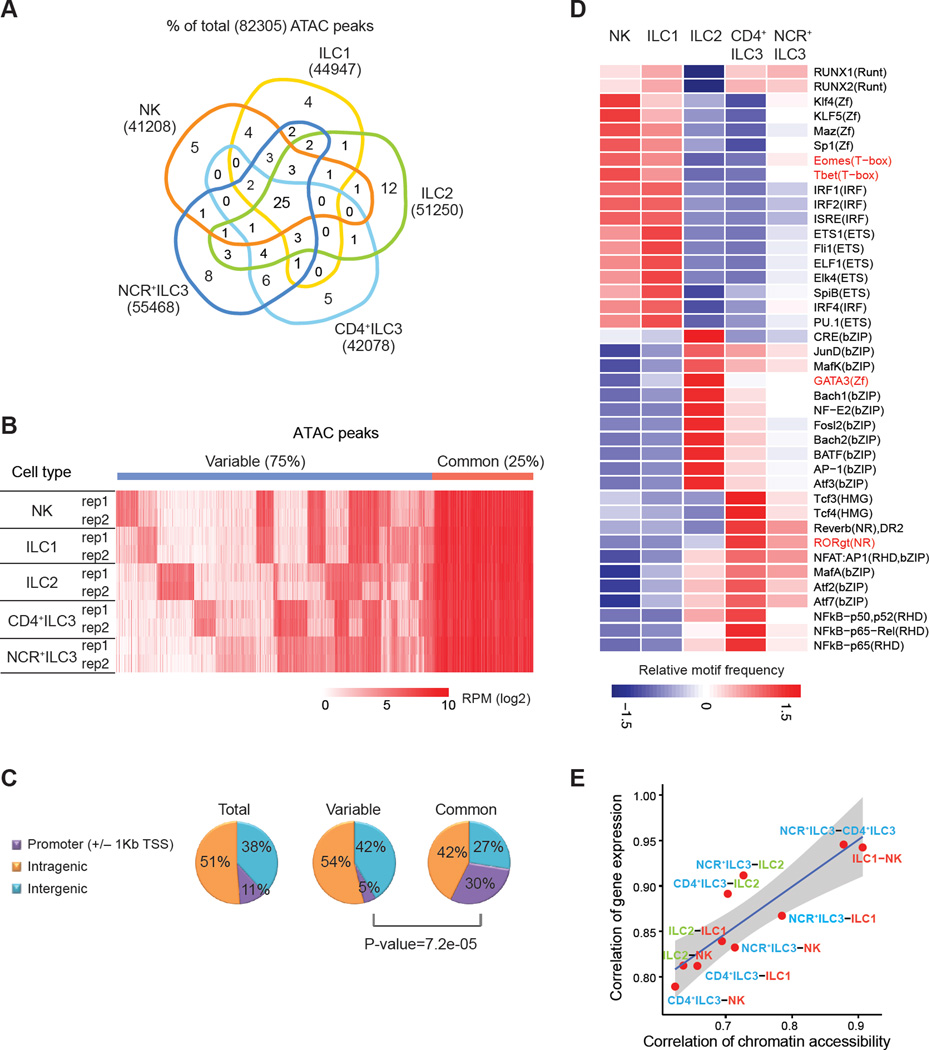
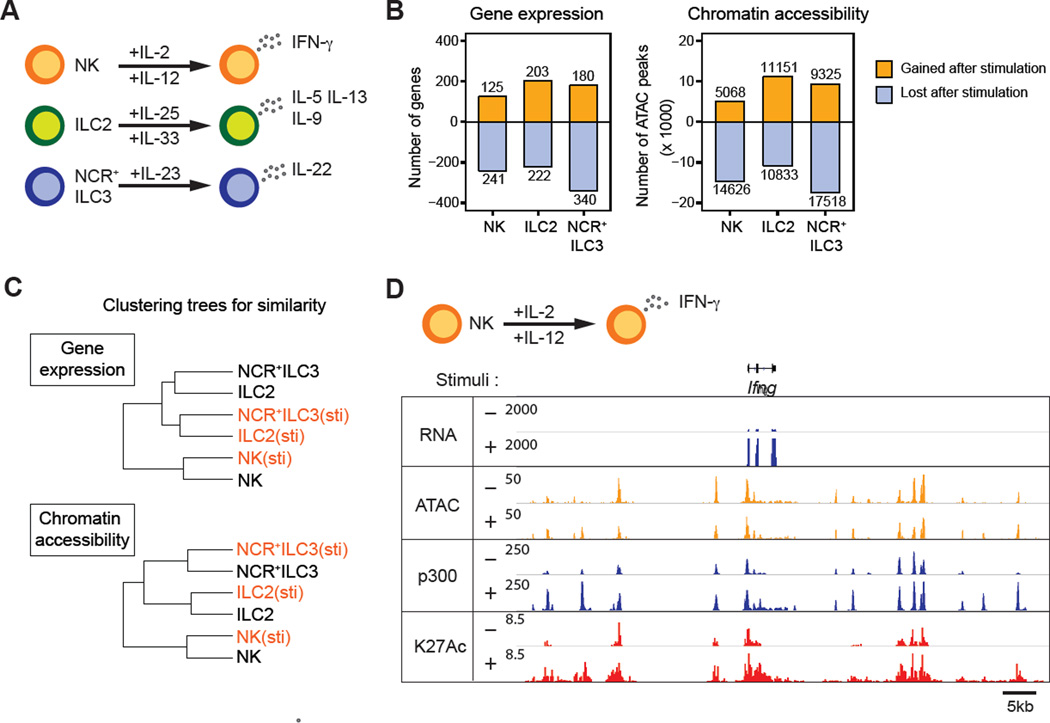
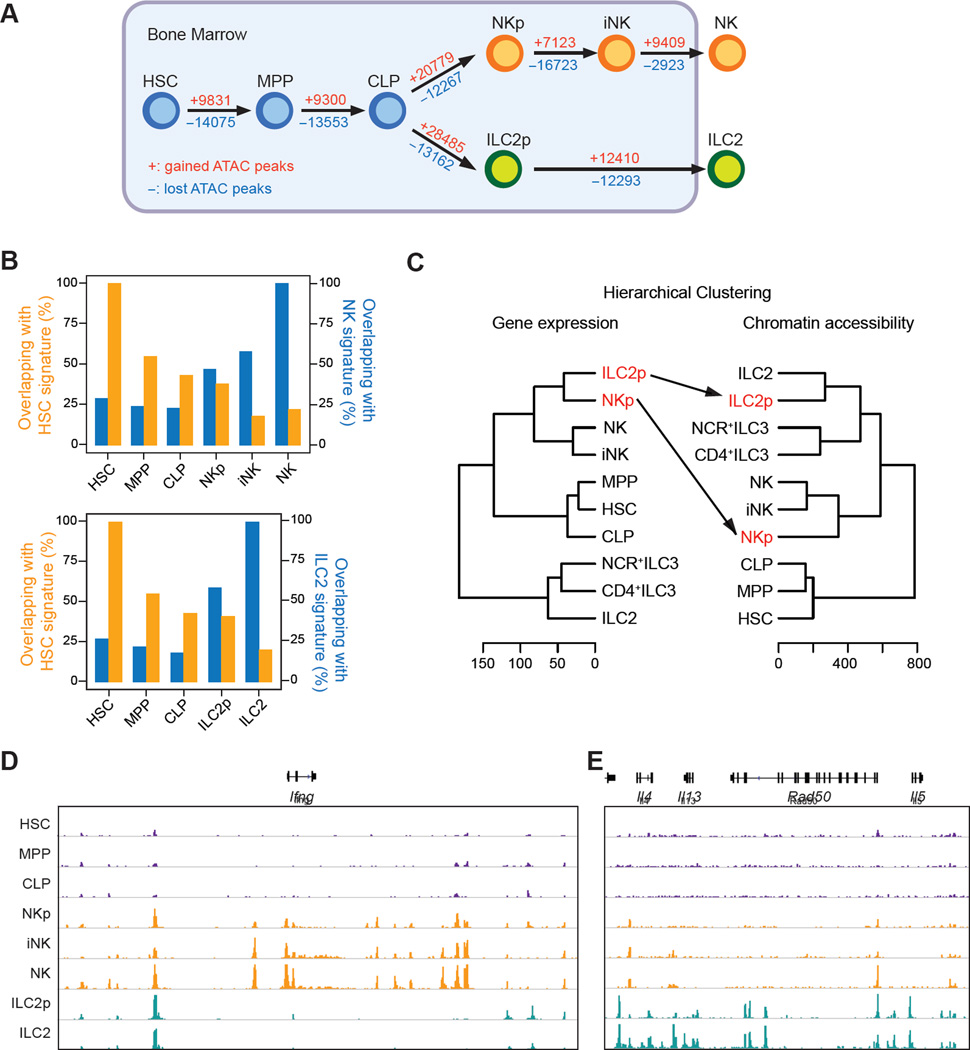
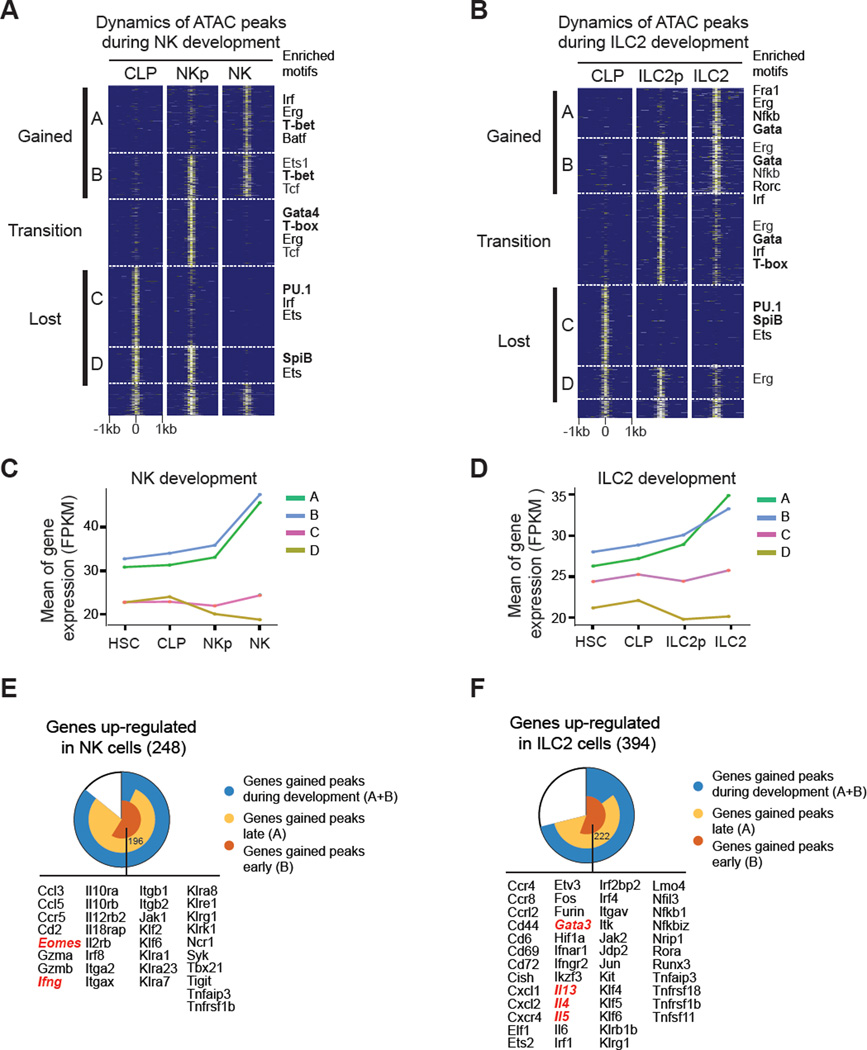
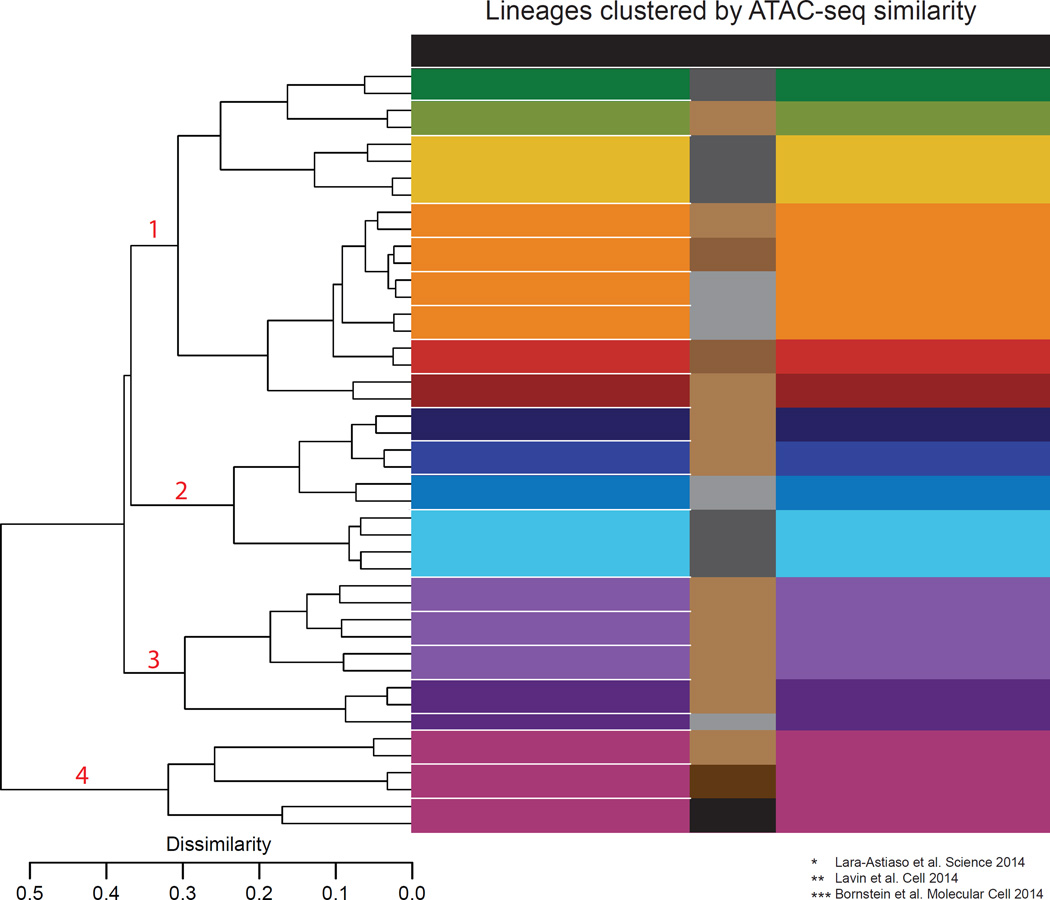
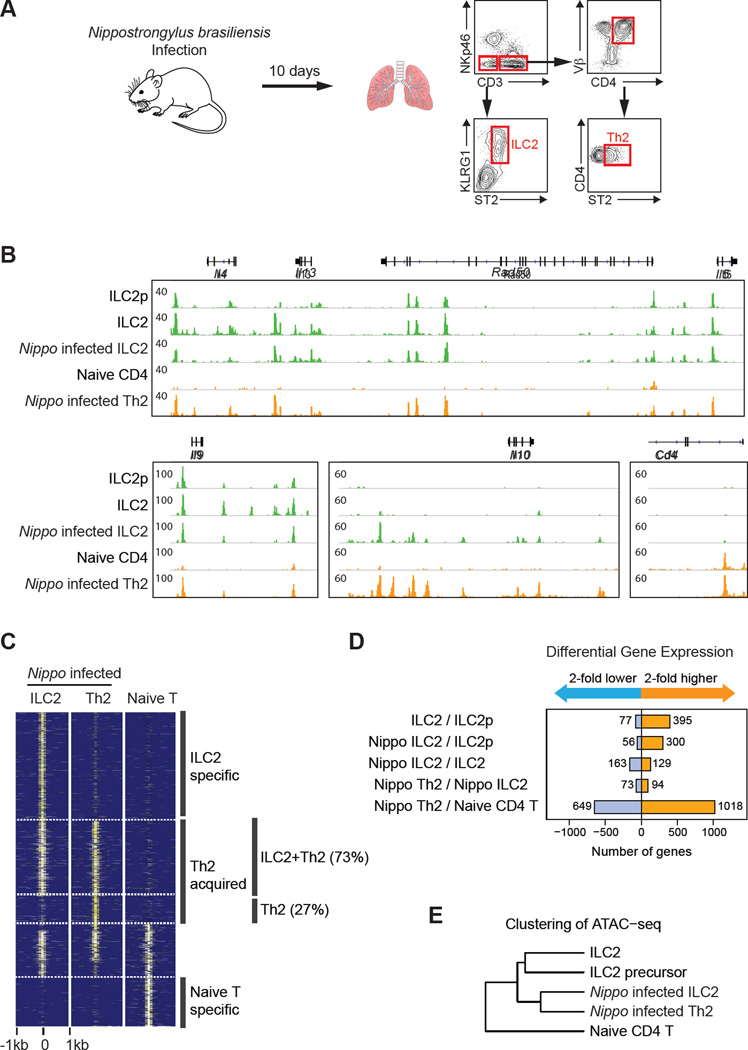
Innate lymphoid cells (ILCs) play key roles in host defense, barrier integrity, and homeostasis and mirror adaptive CD4(+) T helper (Th) cell subtypes in both usage of effector molecules and transcription factors. To better understand the relationship between ILC subsets and their Th cell counterparts, we measured genome-wide chromatin accessibility. We find that chromatin in proximity to effector genes is selectively accessible in ILCs prior to high-level transcription upon activation. Accessibility of these regions is acquired in a stepwise manner during development and changes little after in vitro or in vivo activation. Conversely, dramatic chromatin remodeling occurs in naive CD4(+) T cells during Th cell differentiation using a type-2-infection model. This alteration results in a substantial convergence of Th2 cells toward ILC2 regulomes. Our data indicate extensive sharing of regulatory circuitry across the innate and adaptive compartments of the immune system, in spite of their divergent developing pathways.


Figures

Figure 1
Figure 1. Identification of Regulatory Elements of Innate Lymphoid Cells
(A) Schematic illustration of experimental design. Five prototypical ILCs from various organs were isolated by flow cytometry for ATAC-seq and RNA-seq analysis. Listed in the table are ILC signature genes. All experiments were done in duplicates. (B) – (C) Representative examples of normalized ATAC-seq signal profiles in ILCs across type I signature genes including (B) Ifng, (C) Eomes and Tbx21. (B) p300 and T-bet ChIP-seq were acquired from NK cells. Lineage-signature ATAC peaks at promoter and non-promoter regions are highlighted in blue and red, respectively. Red triangles denote known regulatory elements (Balasubramani et al., 2010; Wilson et al., 2009). Red arrows denote NK cell-specific REs. See also Figure S1 and Experimental Procedures.
Figure 2
Figure 2. Genome-wide chromatin landscapes define distinct ILC subsets
(A) and (B) Comparison of global ATAC peaks in prototypical ILCs. (A) Venn diagram demonstrates percentages of ATAC peaks that are commonly or differentially present in ILCs. The total number of ATAC peaks in each ILC subset is shown next to the annotation. (B) Heatmap showing signal intensity (reads per million mapped reads by log2) of each ATAC peak. (C) Pie charts illustrate the distribution of ATAC peaks across the genome (promoter, +/− 1kb of transcription start sites, intragenic or intergenic regions). P-value is determined by using Fisher’s exact test. (D) Heatmap showing relative enrichment of TF motifs among ILC signature REs. LDTFs were highlighted in red. (E) Scatter plot showing the relationships for Pearson correlations of transcriptomes and regulomes between pairs of ILC subsets. Log2 transformed tag counts averaged from replicates were used for Pearson correlation analysis with threshold of 1 FPKM and 1 RPM for RNA-seq and ATAC-seq datasets, respectively. Blue line denotes linear regression line derived from all data points in the plot. Grey area denotes 95% confidence limits of linear regression. See also Figure S2, Experimental Procedures and Supplemental Table S1.
Figure 3
Figure 3. Cytokine Loci are Primed Prior to Activation
(A) Experimental designs for ILC stimulation. NK cells were treated with IL-2 (1000U/ml) and IL-12 (10ng/ml) for six hours, ILC2 cells were treated with IL-25 (50 ng/ml) and IL-33 (50 ng/ml) for four hours, and NCR+ILC3 cells were treated with IL-23 (50ng/ml) for four hours. (B) Changes in gene expression or chromatin accessibility upon ILC stimulation. Left panel, numbers of genes changed expression over two folds (p-value< 0.05) after stimulation. Right panel, number of peaks gained (orange) or lost (blue) after stimulation. (C) Dendrogram showing hierarchical clustering analysis of ILC gene expression and chromatin accessibility before (marked in black) and after (marked in red) stimulation. (D) Genome track view of the Ifng locus showing RNA-seq, ATAC-seq, H3K27 acetylation and p300 binding for stimulated and non-stimulated NK cells. See also Figure S3, Experimental Procedures and Supplemental Table S1.
Figure 4
Figure 4. Distinctive ILC Enhancer Landscapes Diverge in Development
(A) Schematic diagram of the ILC developmental stages evaluated by ATAC-seq and RNA-seq. The numbers of ATAC peaks gained or lost during transition determined by PAPST program (Bible et al., 2015) are shown in red and blue, respectively, along the arrows. (B) Bar plot illustrates progressive loss of HSC signature (in yellow) and reciprocal gain of mature lineage signature (in blue) for NK (left) or ILC2 (right) during ILC development. (C) Dendrogram showing hierarchical clustering analysis of ILC gene expression (left) and chromatin accessibility (right) of developing ILCs. Log2 transformed tag counts averaged from replicates were used for calculation of Euclidean distances between two cell types with threshold of 1 FPKM and 1 RPM for RNA-seq and ATAC-seq datasets, respectively, and were further clustered by hclust program in R using the ward method. (D) – (E) Genome track view of the Ifng and Th2 loci showing early establishment of divergent chromatin landscapes during ILC development. See also Figure S4, Experimental Procedures and Supplemental Table S1.
Figure 5
Figure 5. Regulatory Elements of ILC Signature Genes are Defined Prior to Maturation
(A) – (B) Dynamics of regulomes during NK (A) and ILC2 (B) development. ATAC-seq Peaks were classified into four categories based on their presence at different developmental stages. A: present in mature ILCs only; B: present in both ILC precursors and mature ILCs; C: present in CLP only; D: present in both CLP and ILC precursors. Representative motifs enriched in each group are listed on the right. (C) – (D) Mean expression level (FPKM) of genes in proximity to REs categorized in (A) and (B) during ILC development was plotted. (E) – (F) REs in proximity to genes upregulated during NK (E) and ILC2 (F) development were evaluated for their timing of acquisition (early vs late). Representative genes that acquire REs early (group 2) were listed. See also Figure S5, Experimental Procedures and Supplemental Table S1.
Figure 6
Figure 6. Relationships between innate and adaptive cell regulomes
Dendrogram showing unbiased hierarchical clustering analysis of lineage relationships based on 37 in-house and 8 previous published ATAC-seq data. Categories of cell types and tissue location from which the cells were harvested are indicated on the right and colored accordingly. The distance on the scale implies the dissimilarity (1-Pearson correlation coefficient) between two individual subjects. Log2 transformed tag counts were used for calculation of dissimilarity between two cell types with threshold of 1 RPM. See also Extended Experimental Procedures
Figure 7
Figure 7. Similarity of ILC2 and Th2 regulomes upon infection
(A) Schematic illustration of experimental design. Lung cells from Foxp3-GFP mice infected with N. brasiliensis were sorted by flow cytometry. In the GFP-negative fraction, Th2 cells were sorted as CD3ε++CD4+ST2+ cells, while ILC2 as CD3εNKp46 KLRG1+ST2+ cells. Purity of sorted cells ranges from 95 to 99% post sort. (B) Representative examples of ATAC-seq signals in type 2 innate and adaptive cells at loci including Th2 cytokines, Il9 and Il10, Cd4 is a lineage marker that distinguishes ILC2 and Th2 cells. (C) Comparison of ATAC-seq signals at signature REs in infected ILC2, Th2 and Naïve CD4+ T cells. A substantial portion of Th2 ATAC-seq peaks acquired upon infection (73%) was shared with infected ILC2. See also Supplemental Table S1 for accessible regions. (D) Pairwise comparison of differential gene expression among type 2 innate and adaptive cells. (E) Dendrogram showing hierarchical clustering of type 2 innate and adaptive cell regulomes to evaluate their similarities. Log2 transformed tag counts averaged from replicates were used for calculation of Euclidean distances between two cell types with threshold of 1 FPKM and 1 RPM for RNA-seq and ATAC-seq datasets, respectively, and were further clustered by hclust program in R using the ward method. See also Extended Experimental Procedures

References

    1. Artis D, Spits H. The biology of innate lymphoid cells. Nature. 2015;517:293–301. - PubMed
    1. Anders S, Huber W. Differential expression analysis for sequence count data. Genome Biology. 2010;11(10):R106. - PMC - PubMed
    1. Ashburner, et al. Gene ontology: tool for the unification of biology. Nat Genet. 2000;25(1):25–29. - PMC - PubMed
    1. Balasubramani A, Winstead CJ, Turner H, Janowski KM, Harbour SN, et al. Deletion of a Conserved cis-Element in the Ifng Locus Highlights the Role of Acute Histone Acetylation in Modulating Inducible Gene Transcription. PLoS Genet. 2014;10:e1003969. - PMC - PubMed
    1. Balasubramani A, Mukasa R, Hatton RD, Weaver CT. Regulation of the Ifng locus in the context of T-lineage specification and plasticity. Immunol Rev. 2010;238:216–232. - PMC - PubMed

Publication types