

Serial image analysis of Mycobacterium tuberculosis colony growth reveals a persistent subpopulation in sputum during treatment of pulmonary TB
- PMID: 27156626
- PMCID: PMC4869592
- DOI: 10.1016/j.tube.2016.03.001
Serial image analysis of Mycobacterium tuberculosis colony growth reveals a persistent subpopulation in sputum during treatment of pulmonary TB
Abstract
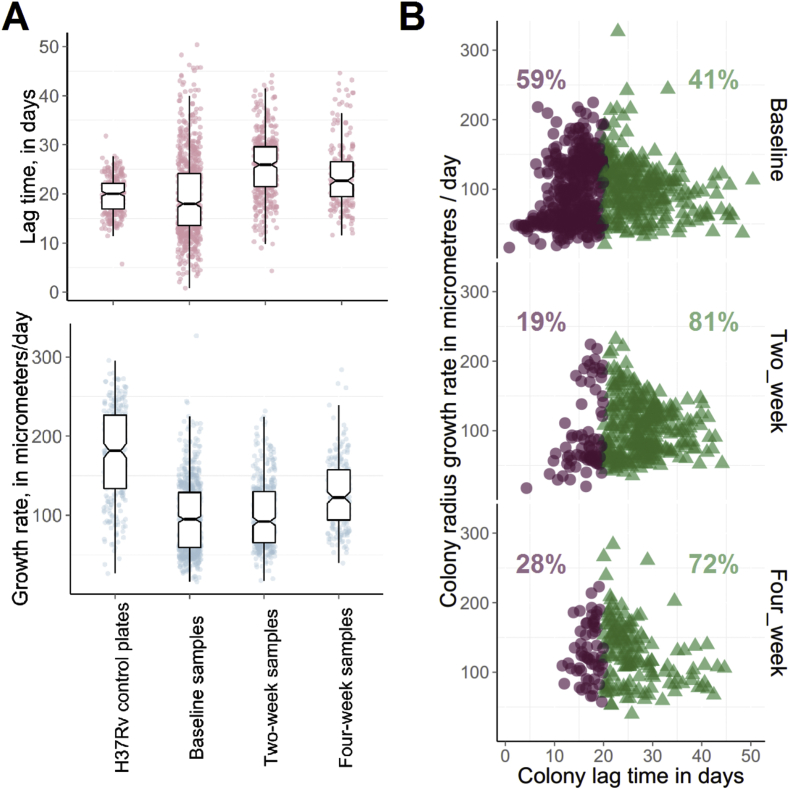
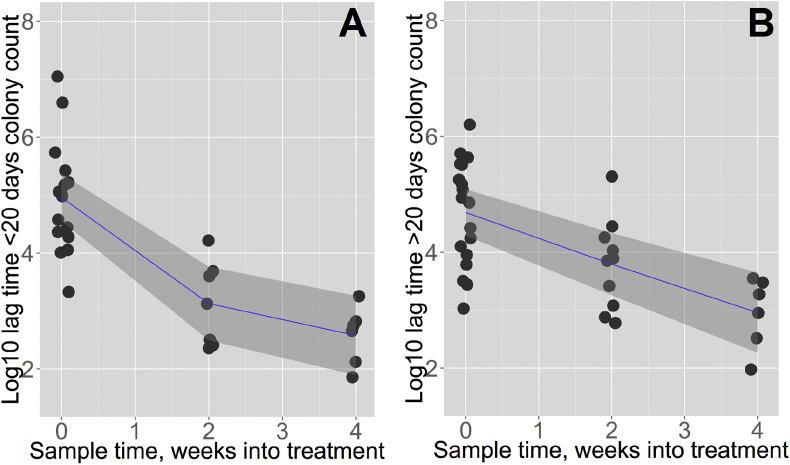
Faster elimination of drug tolerant 'persister' bacteria may shorten treatment of tuberculosis (TB) but no method exists to quantify persisters in clinical samples. We used automated image analysis to assess whether studying growth characteristics of individual Mycobacterium tuberculosis colonies from sputum on solid media during early TB treatment facilitates 'persister' phenotyping. As Time to Detection (TTD) in liquid culture inversely correlates with total bacterial load we also evaluated the relationship between individual colony growth parameters and TTD. Sputum from TB patients in Malawi was prepared for solid and liquid culture after 0, 2 and 4 weeks of treatment. Serial photography of agar plates was used to measure time to appearance (lag time) and radial growth rate for each colony. Mixed-effects modelling was used to analyse changing growth characteristics from serial samples. 20 patients had colony measurements recorded at ≥1 time-point. Overall lag time increased by 6.5 days between baseline and two weeks (p = 0.0001). Total colony count/ml showed typical biphasic elimination, but long lag time colonies (>20days) had slower, monophasic decline. TTD was associated with minimum lag time (time to appearance of first colony1). Slower elimination of long lag time colonies suggests that these may represent a persister subpopulation of bacilli.
Keywords: Biomarkers; Drug tolerance; Persisters; Pharmacodynamics.
Copyright © 2016 The Authors. Published by Elsevier Ltd.. All rights reserved.
Figures
Similar articles
-
Persister populations of Mycobacterium tuberculosis in sputum that grow in liquid but not on solid culture media.J Antimicrob Chemother. 2014 Feb;69(2):437-40. doi: 10.1093/jac/dkt357. Epub 2013 Sep 26. J Antimicrob Chemother. 2014. PMID: 24072170
-
Kinetics of Mycobacterium tuberculosis-specific IFN-γ responses and sputum bacillary clearance in HIV-infected adults during treatment of pulmonary tuberculosis.Tuberculosis (Edinb). 2015 Jul;95(4):463-9. doi: 10.1016/j.tube.2015.05.009. Epub 2015 May 28. Tuberculosis (Edinb). 2015. PMID: 26051653 Free PMC article.
-
Simultaneous staining of sputum smears for acid-fast and lipid-containing Myobacterium tuberculosis can enhance the clinical evaluation of antituberculosis treatments.Tuberculosis (Edinb). 2015 Dec;95(6):770-779. doi: 10.1016/j.tube.2015.08.001. Epub 2015 Aug 13. Tuberculosis (Edinb). 2015. PMID: 26318558 Clinical Trial.
-
The early bactericidal activity of anti-tuberculosis drugs: a literature review.Tuberculosis (Edinb). 2008 Aug;88 Suppl 1:S75-83. doi: 10.1016/S1472-9792(08)70038-6. Tuberculosis (Edinb). 2008. PMID: 18762155 Review.
-
Targeting persisters for tuberculosis control.Antimicrob Agents Chemother. 2012 May;56(5):2223-30. doi: 10.1128/AAC.06288-11. Epub 2012 Mar 5. Antimicrob Agents Chemother. 2012. PMID: 22391538 Free PMC article. Review.
Cited by
-
Xpert Ultra testing of blood in severe HIV-associated tuberculosis to detect and measure Mycobacterium tuberculosis blood stream infection: a diagnostic and disease biomarker cohort study.Lancet Microbe. 2022 Jul;3(7):e521-e532. doi: 10.1016/S2666-5247(22)00062-3. Epub 2022 May 26. Lancet Microbe. 2022. PMID: 35644157 Free PMC article.
-
Prolonged bacterial lag time results in small colony variants that represent a sub-population of persisters.Nat Commun. 2018 Oct 4;9(1):4074. doi: 10.1038/s41467-018-06527-0. Nat Commun. 2018. PMID: 30287875 Free PMC article.
-
The importance of clinical pharmacokinetic-pharmacodynamic studies in unraveling the determinants of early and late tuberculosis outcomes.Int J Pharmacokinet. 2017 Aug;2(3):195-212. doi: 10.4155/ipk-2017-0004. Epub 2017 Jul 12. Int J Pharmacokinet. 2017. PMID: 30283633 Free PMC article. Review.
-
Metabolic Perspectives on Persistence.Microbiol Spectr. 2017 Jan;5(1):10.1128/microbiolspec.tbtb2-0026-2016. doi: 10.1128/microbiolspec.TBTB2-0026-2016. Microbiol Spectr. 2017. PMID: 28155811 Free PMC article. Review.
-
Quantification of bactericidal activity using the PATHFAST TB LAM Ag assay during the first 14 days of pulmonary tuberculosis treatment.Front Antibiot. 2025 May 15;4:1574688. doi: 10.3389/frabi.2025.1574688. eCollection 2025. Front Antibiot. 2025. PMID: 40443956 Free PMC article.
References
Publication types
MeSH terms
Substances
Grants and funding
LinkOut - more resources
Full Text Sources
Other Literature Sources
Research Materials
