. 2016 May 9:6:25524.
doi: 10.1038/srep25524.

Force Generation by Membrane-Associated Myosin-I

Affiliations

Force Generation by Membrane-Associated Myosin-I

Serapion Pyrpassopoulos et al. Sci Rep. .

Abstract

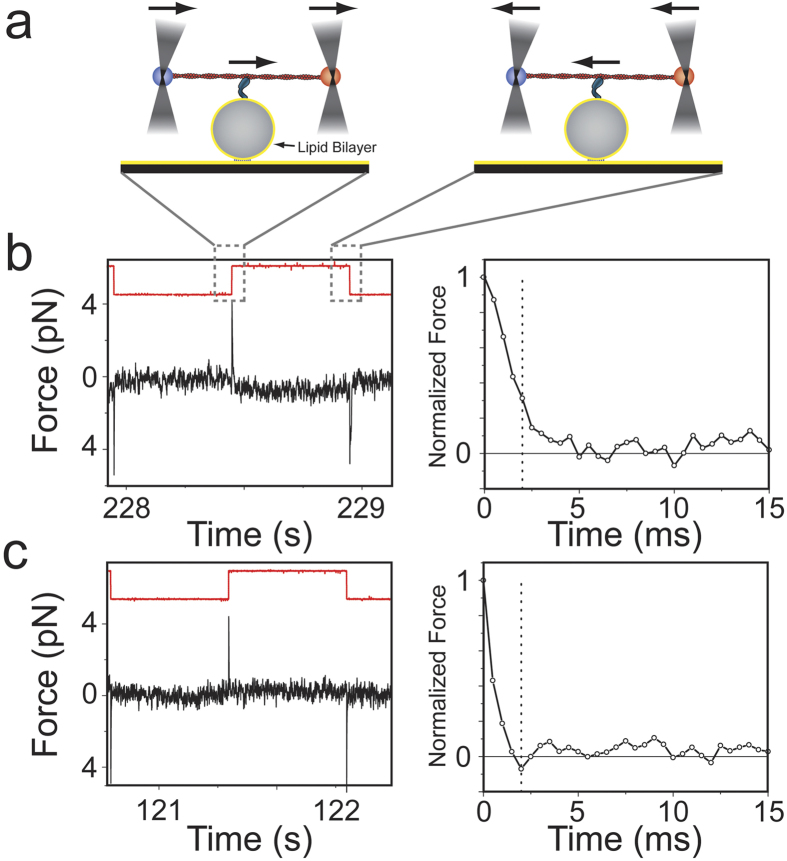
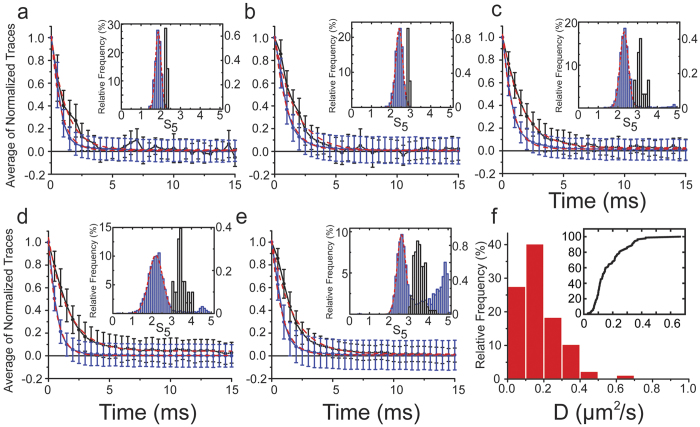
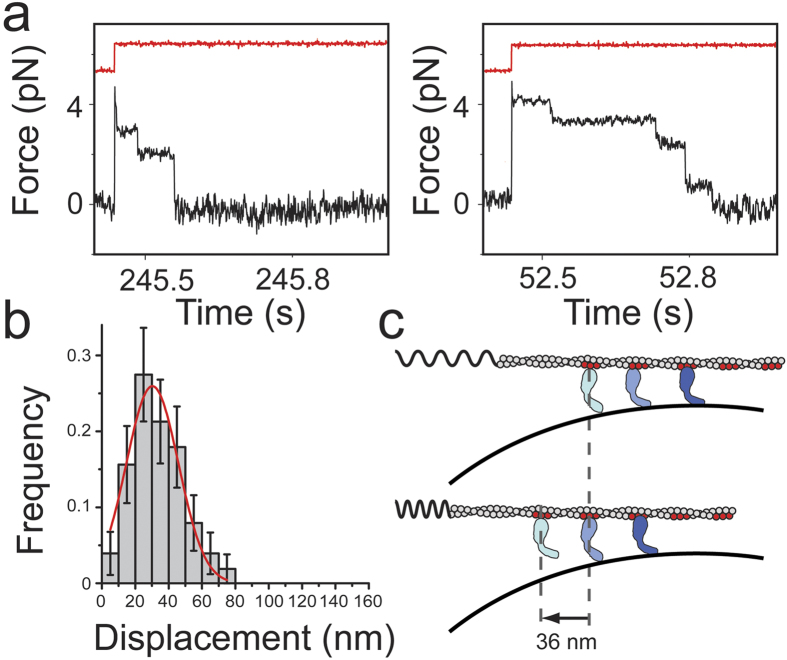
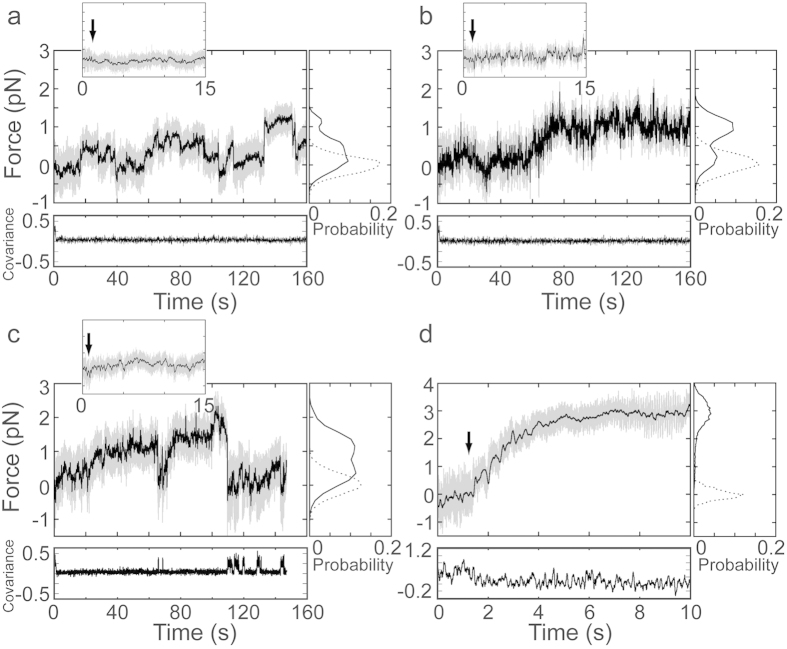
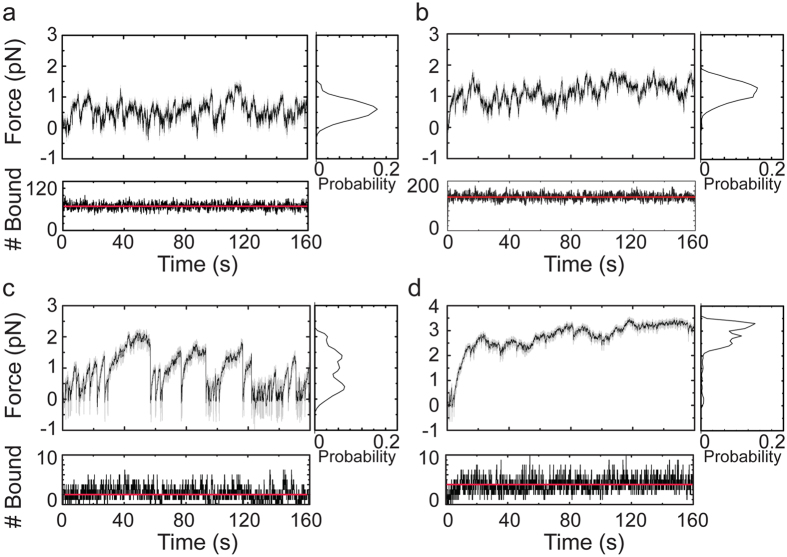
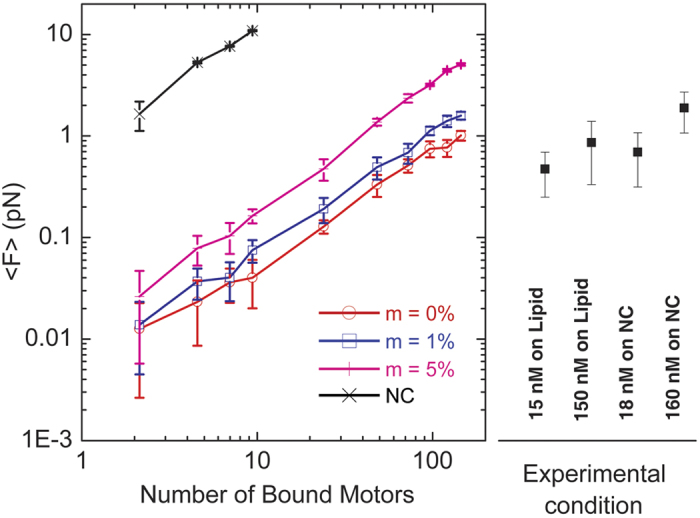
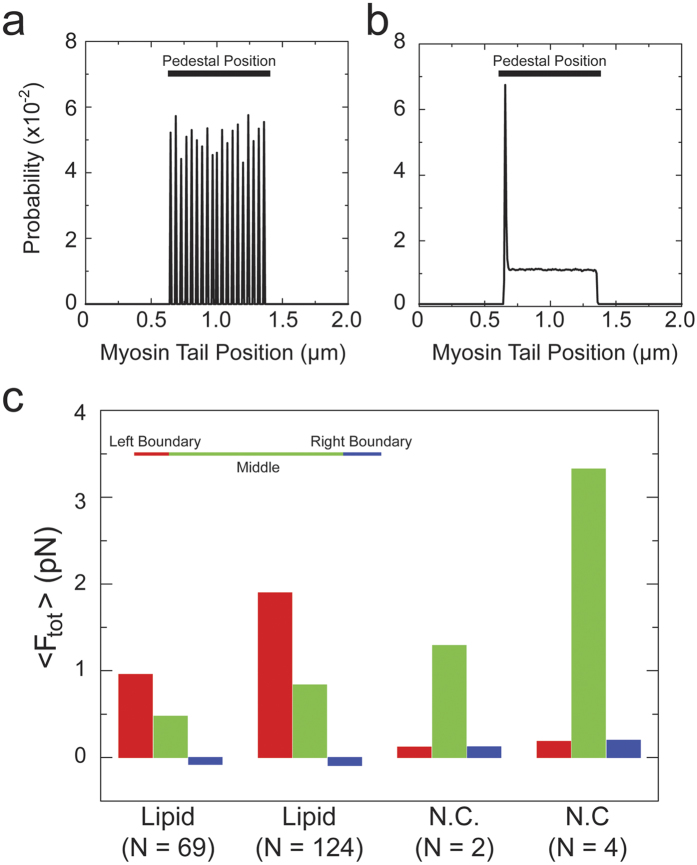
Vertebrate myosin-IC (Myo1c) is a type-1 myosin that links cell membranes to the cytoskeleton via its actin-binding motor domain and its phosphatidylinositol 4,5-bisphosphate (PtdIns(4,5)P2)-binding tail domain. While it is known that Myo1c bound to PtdIns(4,5)P2 in fluid-lipid bilayers can propel actin filaments in an unloaded motility assay, its ability to develop forces against external load on actin while bound to fluid bilayers has not been explored. Using optical tweezers, we measured the diffusion coefficient of single membrane-bound Myo1c molecules by force-relaxation experiments, and the ability of ensembles of membrane-bound Myo1c molecules to develop and sustain forces. To interpret our results, we developed a computational model that recapitulates the basic features of our experimental ensemble data and suggests that Myo1c ensembles can generate forces parallel to lipid bilayers, with larger forces achieved when the myosin works away from the plane of the membrane or when anchored to slowly diffusing regions.


Figures

Figure 1
Figure 1. Relaxation of the force on an actin dumbbell held by optical traps undergoing a square wave oscillation.
(a) Cartoon representation of the three-bead geometry. An actin filament held by two laser-trapped beads is oscillated over a spherical lipid coated pedestal while attached to Myo1c. (b), Left): Sample of the force trace for one of the two laser-trapped beads (black) and the square wave pulse (red; arbitrary units) which is applied to the laser traps, in the presence of 0.6 pM Myo1c and 1 μM ATP. The force offset due to pretention of the actin dumbbell (Methods) has been removed for the sake of clarity. (b), Right): Expanded view of the relaxation phase for a force spike from the left panel after normalization. The dashed vertical line indicates the 5th point (2 ms) up to which the S5 value is calculated and is used as a first approximation of the rate of force relaxation (see text for details). (c) The same as in (b) but in the absence of Myo1c. (When the actin dumbbell is away from a lipid coated spherical pedestal data traces are similar to (c) and are therefore not presented here for this reason).
Figure 2
Figure 2. Measurement of viscous drag of membrane-bound Myo1c.
Ensemble averages of normalized force relaxation traces obtained from oscillating actin filaments (a) away from the pedestal surface and (b) touching the top of the pedestal in the absence of Myo1c, and adjacent to the pedestal in the presence of (c) 0.2 pM, (d) 0.6 pM, and (e) 1.9 pM of Myo1c. The black and blue traces are averages of normalized force relaxation traces in the presence and the absence of actoMyo1c-membrane attachment respectively according to the parsing criterion (see text). Dashed red lines are error-weighted fits of the corresponding average traces to a single exponential decay function. Error bars are standard deviations of the mean. (Insets, blue bars, left axis) Frequency distribution of S5 values for all relaxation traces from a single experiment over multiple oscillation cycles (for the total percentage of the different types of relaxation over the whole datasets under each condition see Table 1). (Black bars, right axis) Distribution of S5 values identified as exponentially decaying force relaxation events during an actoMyo1c-membrane attachment. Blue bars to the left of black bars correspond to relaxation events in the absence of actoMyo1c-membrane attachment. Dashed red lines are fits of the predominant peaks (blue bars to the left of the black bars) to a Gaussian function. (f) Distribution of the diffusion coefficients (DMyo1c) obtained for membrane-bound Myo1c from fitting the individual force relaxation traces for actoMyo1c-membrane attachments identified in the presence of 0.2 pM and 0.6 pM Myo1c (see text for details). (Inset) The same data plotted as a cumulative distribution.
Figure 3
Figure 3. Stepwise relaxation of the force on an actin dumbbell oscillating under a square wave pulse (1 μM ATP).
(a) Two examples of stepwise relaxation events (black trace) that occurred in the presence of 0.6 pM Myo1c. Square wave pulses are shown with arbitrary units (red traces). (b) Frequency distribution of the displacements of the stepwise relaxations acquired in the presence of 0.2 pM Myo1c. Changes in force were transformed to displacement traces (Methods). Error bars were estimated from 1000 bootstrap cycles and the red trace is an error-weighted fit of the distribution to a Gaussian function. (c) Cartoon representation of the proposed origin of the stepwise relaxation events. The motion of an actin filament to its equilibrium position under the restoring force of the laser-trap (stretched spring in upper subpanel) is hindered by a Myo1c molecule (light blue color) which cannot be dragged further to the left due to the curvature of the underlying pedestal. When the Myo1c molecule detaches from the pedestal (lower subpanel) the actin filament moves towards the left until another Myo1c molecule (pale blue) reaches the same geometrical spot. The size of the sequential actin displacements is determined by the spacing between Myo1c molecules (red colored spots on actin filament) which can interact simultaneously with the actin filament and the lipid coated pedestal. This spacing according to structural studies comes in integer multiples of ~36 nm.
Figure 4
Figure 4. Force developed on actin filaments by ensembles of Myo1c molecules on lipid and solid substrates (1mM ATP).
(Large panels) Force on actin dumbbells pulled by Myo1c molecules bound to lipid coated spherical pedestals in the presence of (a) 15 nM and (b) 150 nM Myo1c. Actin dumbbells pulled by Myo1c3IQ molecules anchored via biotin-streptavidin linker on nitrocellulose-coated spherical pedestals in the presence of (c) 18 nM and (d) 360 nM Myo1c. Unfiltered (gray) and smoothed (black) force traces of the beads attached to the barbed-end of the actin filaments are shown. (Insets) Expanded views of the first 15 s of the force traces, with the black arrows indicating the instant of attachment of pedestal-bound Myo1c molecules to the actin filament. (Right subpanels) Probability histograms of the force before the initial attachment (dashed lines) and after the initial attachment (solid lines). (Lower subpanels) Covariance traces (×500) of the two laser-trapped beads. Low covariance values indicate attachment of the actin filament to pedestal-bound Myo1c molecules, while high covariance values indicate detachment.
Figure 5
Figure 5. Simulated force developed on actin filaments by ensembles of Myo1c molecules on lipid and solid substrates.
(Large panels) Force on actin dumbbells pulled by Myo1c molecules dynamically attached to a diffusive surface at densities corresponding to average number (over 50 realizations) of actin-bound motors (a) N = 69.04 and (b) N = 123.61. Actin dumbbells pulled by Myo1c3IQ molecules rigidly anchored to a surface at densities corresponding to average number of actin-bound motors (c) N = 2.14 and (d) N = 3.56. Unfiltered (gray) and smoothed (black) force traces of the beads attached to the barbed-end of the actin filaments are shown. (Right subpanels, dashed lines) Probability histograms of the force are also shown. (Lower subpanels) Traces showing the number of Myo1c molecules bound to actin filament as a function of time.
Figure 6
Figure 6. Average forces on actin filaments as a function of the number of motors bound to the filament.
(Left) The average force <F> (over 10 realizations) of the traces of the beads attached to the barbed-end of the actin filaments as a function of the average number of actin-bound motors, N, on a diffusive surface obtained from the simulations. An increasing percentage of non-diffusing motors (m = 1%, 5%) that dynamically interact with the surface results in an increase in the average force. The dependence of the average force on the number of motors when they are rigidly attached to a non-diffusing nitrocellulose (NC) surface is also shown. Error bars show standard deviation. (Right) Average force values and standard deviations obtained from experimental data at the indicated protein concentrations are shown.
Figure 7
Figure 7. Maximum forces on surface-attached myosins as a function of position on pedestal.
Position histograms of the maximum force on Myo1c motors as a function of their tail position on simulated (a) nitrocellulose- and (b) lipid-coated pedestals. The average number of actin-bound motors in (a) N = 3.56 and (b) N = 123.61. Maximum forces are recorded at every simulation time step, and the resulting histograms are averaged over 50 realizations. (c) The total average force, <Ftot> generated in three different regions on the pedestal by myosin motors for different substrates and different average number of motors. The left and right boundary regions correspond to the first 8 nm from the outermost points of the pedestal, and the middle region in between the two boundaries (the inset is not to scale). The average force (<Ftot> in Table 3) in a given region is calculated from the product of the average number of bound motors to actin and the mean average force of a single myosin during τon (formula image in Table 3, also see Supplementary Information).

Similar articles

Cited by

References

    1. Yin H. L. & Janmey P. A. Phosphoinositide regulation of the actin cytoskeleton. Annu Rev Physiol 65, 761–89 (2003). - PubMed
    1. Bezanilla M., Gladfelter A. S., Kovar D. R. & Lee W. L. Cytoskeletal dynamics: a view from the membrane. J Cell Biol 209, 329–37 (2015). - PMC - PubMed
    1. Hokanson D. E., Laakso J. M., Lin T., Sept D. & Ostap E. M. Myo1c Binds Phosphoinositides through a Putative Pleckstrin Homology Domain. Mol Biol Cell 17, 4856–65 (2006). - PMC - PubMed
    1. Hokanson D. E. & Ostap E. M. Myo1c binds tightly and specifically to phosphatidylinositol 4,5-bisphosphate and inositol 1,4,5-trisphosphate. Proc Natl Acad Sci USA 103, 3118–23 (2006). - PMC - PubMed
    1. Hayden S. M., Wolenski J. S. & Mooseker M. S. Binding of brush border myosin I to phospholipid vesicles. J Cell Biol 111, 443–51 (1990). - PMC - PubMed

Publication types

LinkOut - more resources