Review
. 2016 Sep:54:64-102.
doi: 10.1016/j.preteyeres.2016.04.003. Epub 2016 May 6.

Risk factors and biomarkers of age-related macular degeneration

Affiliations
Review

Risk factors and biomarkers of age-related macular degeneration

Nathan G Lambert et al. Prog Retin Eye Res. 2016 Sep.

Abstract

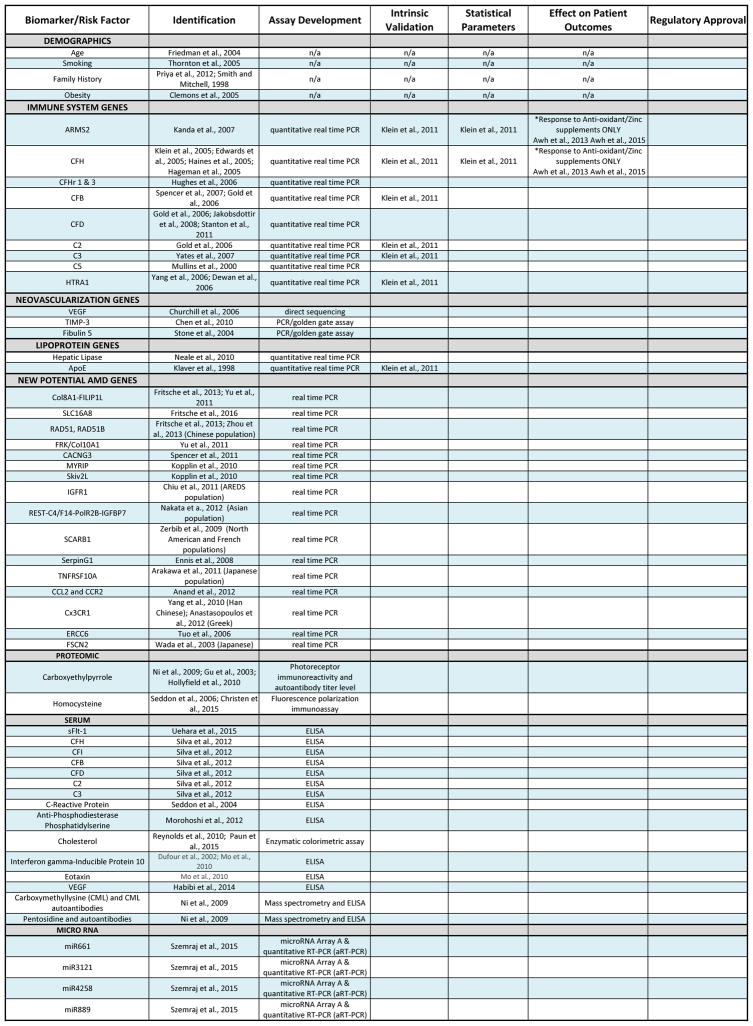
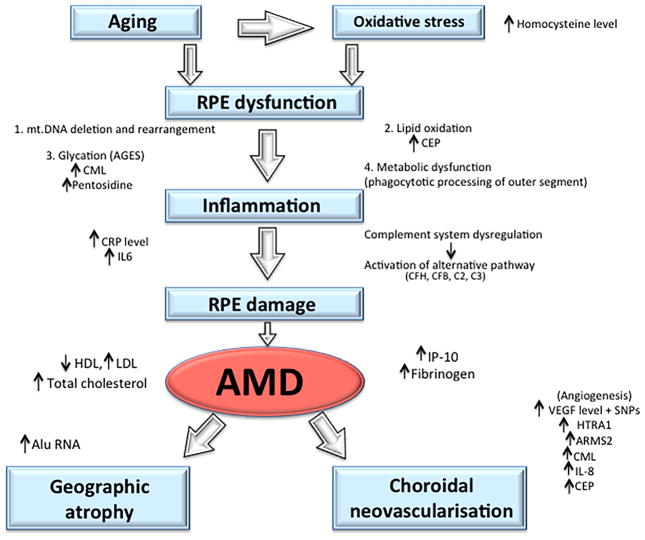
A biomarker can be a substance or structure measured in body parts, fluids or products that can affect or predict disease incidence. As age-related macular degeneration (AMD) is the leading cause of blindness in the developed world, much research and effort has been invested in the identification of different biomarkers to predict disease incidence, identify at risk individuals, elucidate causative pathophysiological etiologies, guide screening, monitoring and treatment parameters, and predict disease outcomes. To date, a host of genetic, environmental, proteomic, and cellular targets have been identified as both risk factors and potential biomarkers for AMD. Despite this, their use has been confined to research settings and has not yet crossed into the clinical arena. A greater understanding of these factors and their use as potential biomarkers for AMD can guide future research and clinical practice. This article will discuss known risk factors and novel, potential biomarkers of AMD in addition to their application in both academic and clinical settings.

Keywords: Age-related macular degeneration; Biomarkers; Proteomics; microRNA; sFlt.


Conflict of interest statement

The authors have no proprietary interests or conflicts

Figures

Figure 1
Figure 1. Forms of AMD, (see appendix)
Figure 1.1: Normal Human Retina A) Posterior pole view of a normal human retina. The fovea is arrowed. B) Immunofluorescent image of macular cones (labelled red), cell nuclei are blue (DAPI) and RPE (orange) due to autofluorescence. NR: neuroretina, RPE: retinal pigment epithelium (Courtesy of Dr Ann Milam, Scheie Eye Institute, University of Pennsylvania Philadelphia, USA) Figure 1.2: Drusen in AMD A) Fundus view of a retina with drusen (white deposits). B) Section of retina showing confluent drusen (*) near optic nerve head. Astrocytes, positive for glial fibrillary acidic protein (GFAP), define the nerve fibre layer (NFL). The cones (red) in the photoreceptor layer (PRL) are shortened and decreased in number over the drusen. The RPE are autofluorescent (orange) due to lipofuscin build up. Cell nuclei are labelled blue. There is loss of cone cells (red) adjacent to drusen. The RPE (orange) is thinned and abnormal over the drusen. (Courtesy of Dr Ann Milam, Scheie Eye Institute, University of Pennsylvania, Philadelphia, USA) Figure 1.3: Geographic Atrophy A) Fundal view of a patient with geographic atrophy, note the pale areas of retinal atrophy (arrow). B) Section of retina showing RPE cell loss (arrowed) with overlying loss of photoreceptors (PRL) at the macula. This area is replaced by intra-retinal glial tissue (anti-GFAP: green) (Courtesy of Dr Ann Milam, Scheie Eye Institute, University of Pennsylvania, Philadelphia, USA) Figure 1.4: Advanced Neovascular Age-related Macular Degeneration A) Fundal view of patient with advanced age related macular degeneration. A disciform scar is located at the macula. B) A immunofluorescence image of a macula with AMD, rods (red) surround an area of RPE and photoreceptor cell loss, replaced by a sub-retinal and intra-retinal glial (anti-GFAP: green) scar. (Courtesy of Dr Ann Milam, Scheie Eye Institute, University of Pennsylvania, Philadelphia, USA)
Figure 2
Figure 2. Complement Cascade (see appendix)
Simplified summary of the alternative complement cascade. Diagram shows the stimulatory role of complement factors B (CFB) and D (CFD), in opposition to the inhibitory role of complement factor H (CFH). The end result of this cascade is the formulation of the membrane attack complex (MAC), which leads to cell lysis and death.
Figure 3
Figure 3. miRNA Processing Pathway (see appendix)
miRNA-processing pathway. miRNAs are generated through a series of cleavage events, which take place in the nucleus and the cytoplasm, forming pri-miRNA and pre-miRNA before forming the mature structure. Hairpin miRNA originates from precursor miRNA within the nucleus as part of a longer primary transcript. At this stage, the pri-miRNA includes the characteristic 5′ 7-methyl guanosine cap and a 3′ poly-A tail, believed to originate from RNA polymerase II activity (Zeng et al., 2006). Pre-miRNA formation also occurs within the nucleus. The microprocessor complex containing the enzymes Drosha, RNase III-like enzyme, and its co-factor DGCR-8, (double-stranded RNA binding protein) all contribute to miRNAs processing. Drosha is comprised of two RNase II domains. Of these, one is believed to cleave the 3′ end of the pre-miRNA while the 5′ end is cleaved by the other domain (Jha et al., 2011). Hairpin release occurs in the nucleus, and then the miRNA is exported to cytoplasm. Dicer enzyme processing occurs, followed by strand selection by RISC (Winter et al., 2009). (RISC= RNA-induced silencing complex, pre-miRNA= Precursor microRNA, pri-miRNA = Primary microRNA)
Figure 4
Figure 4. Effects of microRNA on AMD Development (see appendix)
Simplified diagram depicting the role of microRNA on AMD development. microRNAs regulate different growth and angiogenic factors as well as various elements influencing inflammation, leading to many of the processes responsible for age-related macular degeneration.
Figure 5
Figure 5. Biomarker Development (see appendix)
Process of biomarker development, from inception to clinical implementation.
Figure 6
Figure 6. Biomarker Progress to Clinical Use (see appendix)
Table of biomarkers and their progression in stages of developmental process. The most promising genetic biomarkers include Complement Factor H (CFH) and Age-Related Maculopathy Susceptibility 2 (ARMS2). Patients possessing certain CFH or ARMS2 genetic SNPs have shown positive outcomes after taking AREDs supplements compared to controls. Several complement associated genes, ApoE genes, and genes relating to HTRA1, have been used in clinical predictive models of AMD (Klein et al., 2011). Most of the risk factors and potential biomarkers listed have recently been identified, and future research should be focused on confirming their association with AMD and elucidating their role as a viable marker for AMD. To date, there have been no official randomized clinical trials showing any significant correlation between a specific biomarker and patient outcomes.
Figure 7
Figure 7. Diagnostic and Prognostic Biomarkers for AMD (see appendix)
Summary of development and progression of AMD and depiction of potential biomarkers to predict susceptibility, progression, and prognosis. As individuals age, they experience increased oxidative stress, which can result in elevated homocysteine levels in plasma. As RPE function worsens, various events occur such as mitochondrial DNA (mt.DNA) deletion and rearrangement (such as in ARMS2), increase in lipid oxidation and its end products (i.e. carboxyethypyrrole (CEP)). Proteins begin to break down and are glycated, resulting in elevated levels of advanced glycation end products, such as carboxymethyllysine and pentosidine. Retinal metabolic dysfunction occurs leading to phagocytosis of photoreceptor outer segments. These events lead to inflammation, which can be noted by inflammatory cytokines such as CRP and IL-6. Various mutations in key regulatory complement cascade proteins (CFH, CFB, C2, C3) lead to activation and dysregulation of the complement system, further increasing inflammation and leading to damage of the RPE. Damage to macular RPE and photoreceptor cells results in AMD, either through geographic atrophy or choroidal neovascularisation. Serum IP-10 elevation is seen in early dry-AMD. Changes in serum lipoprotein levels and cholesterol have been associated with geographic atrophy and CNV, while increased levels of Alu RNA in RPE cells is seen mainly in geographic atrophy. Elevated fibrinogen levels can be seen in late-AMD. Increased angiogenesis and worsening CNV can be seen with elevated levels of various factors (VEGF, CML, IL-8, CEP) and expression of certain high-risk genotypes (CFH, HTRA1, ARMS2).

References

    1. Abdel-Magid AF. Factor D Inhibitors for the Treatment of AMD: Patent Highlight. ACS Med Chem Lett. 2012;3:781–782. - PMC - PubMed
    1. Abedi F, Wickremasinghe S, Richardson AJ, Makalic E, Schmidt DF, Sandhu SS, Baird PN, Guymer RH. Variants in the VEGFA gene and treatment outcome after anti-VEGF treatment for neovascular age-related macular degeneration. Ophthalmology. 2013;120:115–121. - PubMed
    1. Abu-Safieh L, Abboud EB, Alkuraya H, Shamseldin H, Al-Enzi S, Al-Abdi L, Hashem M, Colak D, Jarallah A, Ahmad H, Bobis S, Nemer G, Bitar F, Alkuraya FS. Mutation of IGFBP7 causes upregulation of BRAF/MEK/ERK pathway and familial retinal arterial macroaneurysms. American journal of human genetics. 2011;89:313–319. - PMC - PubMed
    1. Adams MK, Simpson JA, Aung KZ, Makeyeva GA, Giles GG, English DR, Hopper J, Guymer RH, Baird PN, Robman LD. Abdominal obesity and age-related macular degeneration. American journal of epidemiology. 2011;173:1246–1255. - PubMed
    1. Adams MK, Simpson JA, Richardson AJ, English DR, Aung KZ, Makeyeva GA, Guymer RH, Giles GG, Hopper J, Robman LD, Baird PN. Apolipoprotein E gene associations in age-related macular degeneration: the Melbourne Collaborative Cohort Study. American journal of epidemiology. 2012;175:511–518. - PubMed

Publication types

Substances