

Traumatic injury in the United States: In-patient epidemiology 2000-2011
- PMID: 27157986
- PMCID: PMC5269564
- DOI: 10.1016/j.injury.2016.04.002
Traumatic injury in the United States: In-patient epidemiology 2000-2011
Abstract
Background: Trauma is a leading cause of death and disability in the United States (US). This analysis describes trends and annual changes in in-hospital trauma morbidity and mortality; evaluates changes in age and gender specific outcomes, diagnoses, causes of injury, injury severity and surgical procedures performed; and examines the role of teaching hospitals and Level 1 trauma centres in the care of severely injured patients.
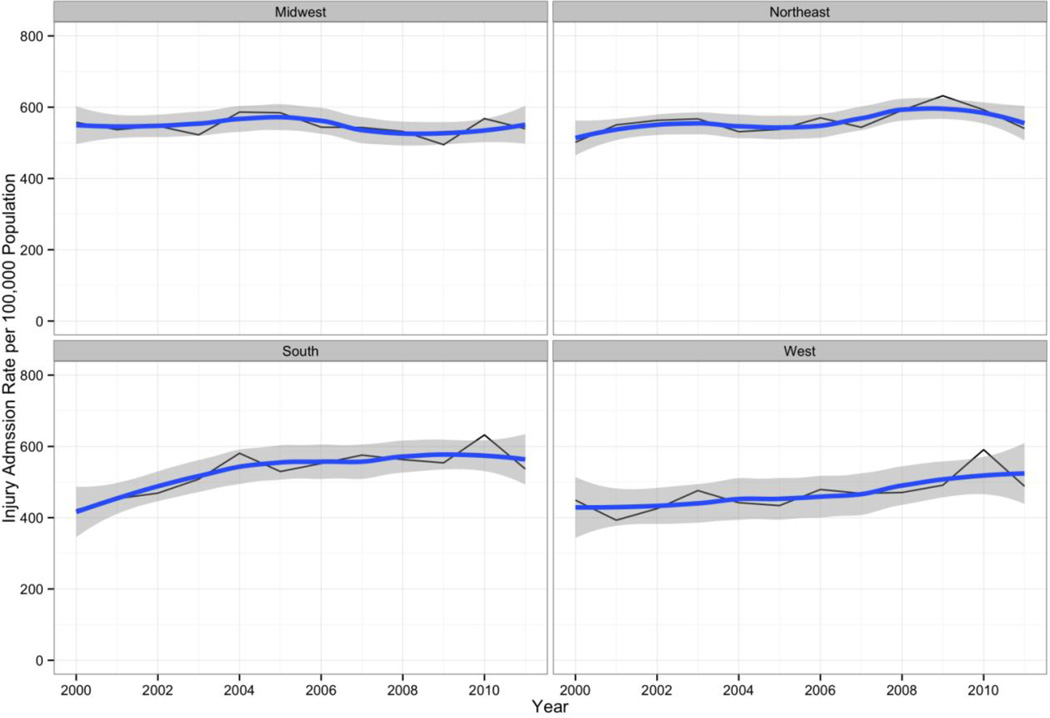
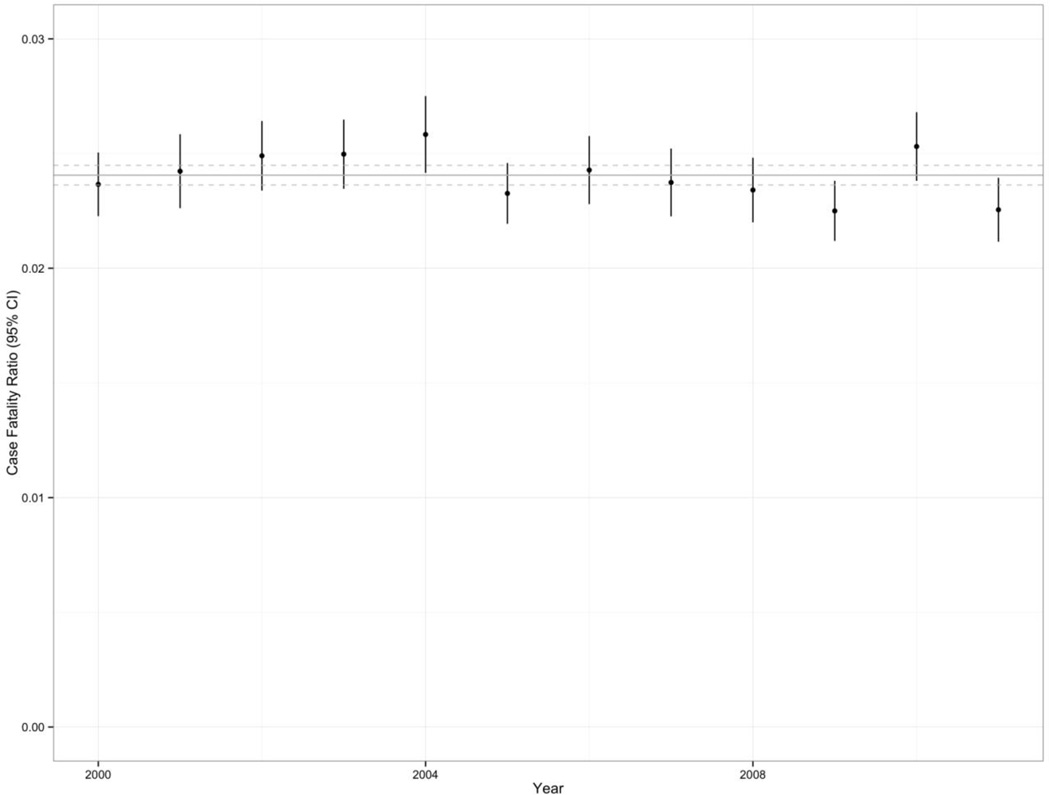
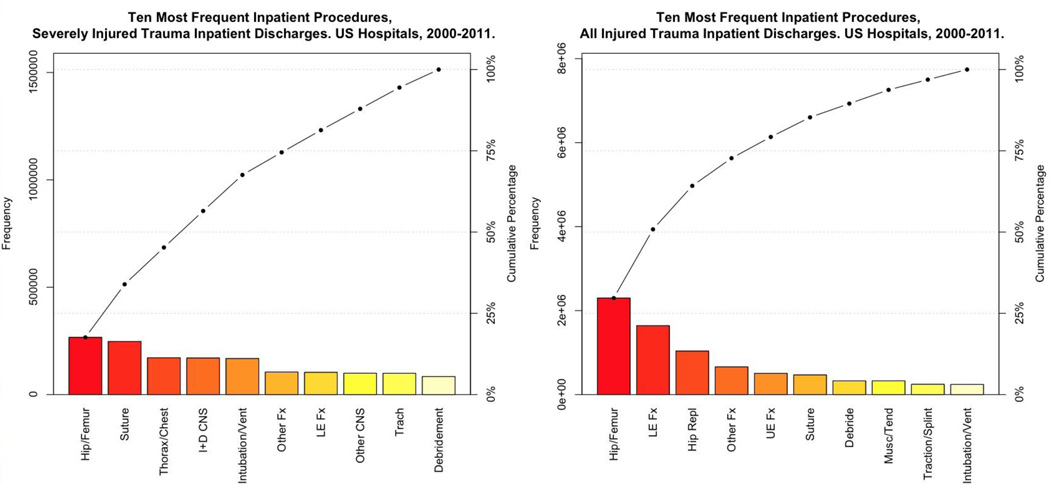
Methods: We conducted a retrospective descriptive and analytic epidemiologic study of an inpatient database representing 20,659,684 traumatic injury discharges from US hospitals between 2000 and 2011. The main outcomes and measures were survey-adjusted counts, proportions, means, standard errors, and 95% confidence intervals. We plotted time series of yearly data with overlying loess smoothing, created tables of proportions of common injuries and surgical procedures, and conducted survey-adjusted logistic regression analysis for the effect of year on the odds of in-hospital death with control variables for age, gender, weekday vs. weekend admission, trauma-centre status, teaching-hospital status, injury severity and Charlson index score.
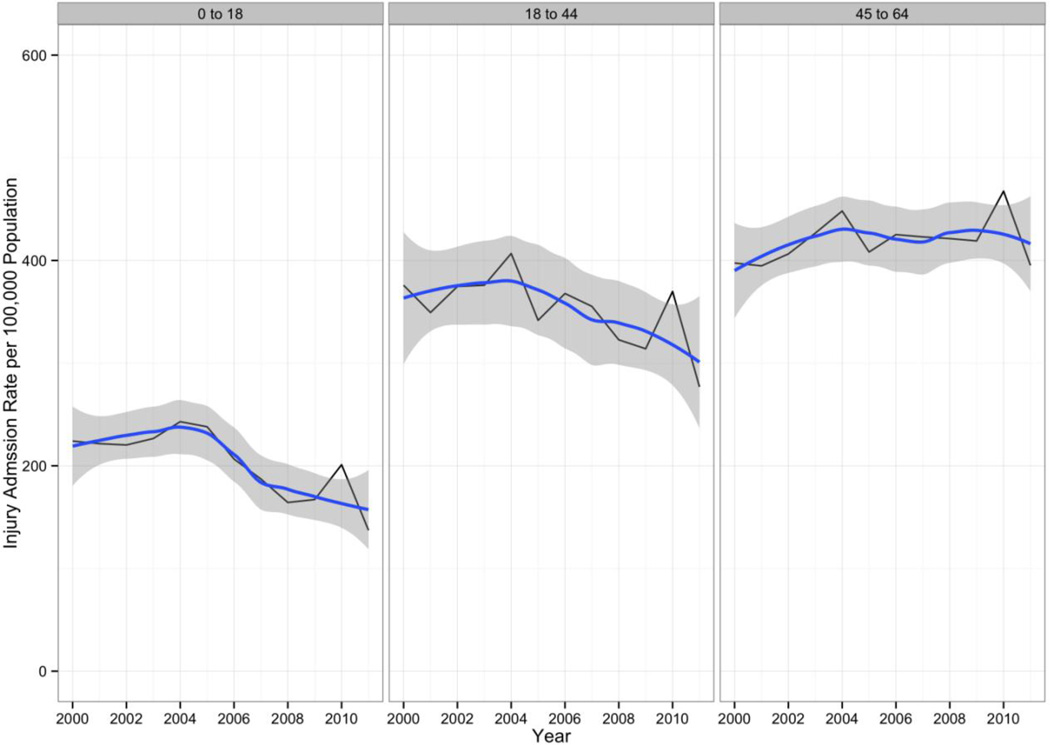
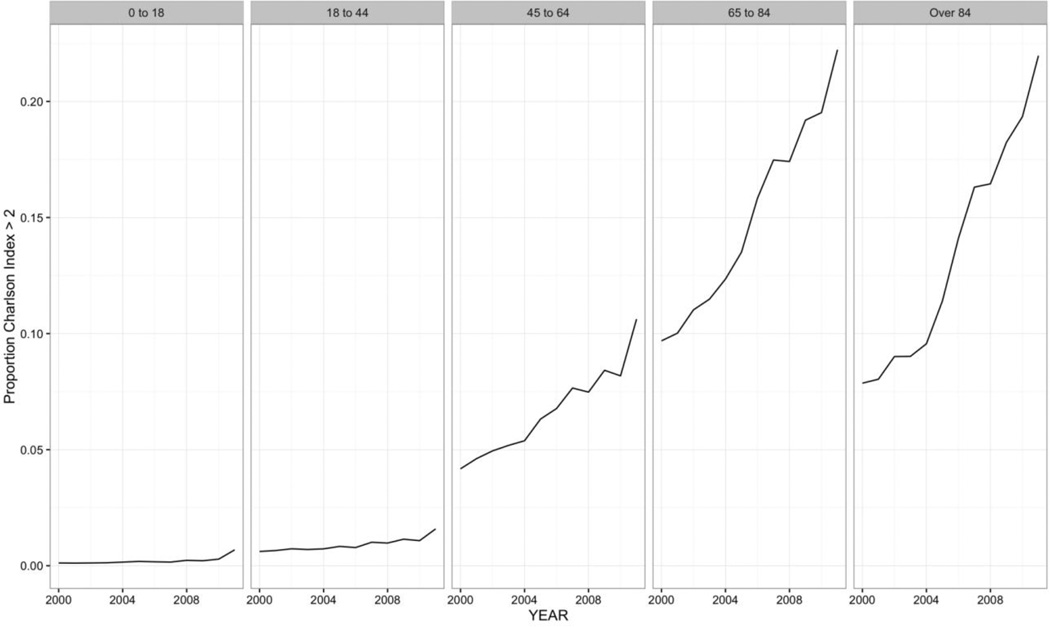
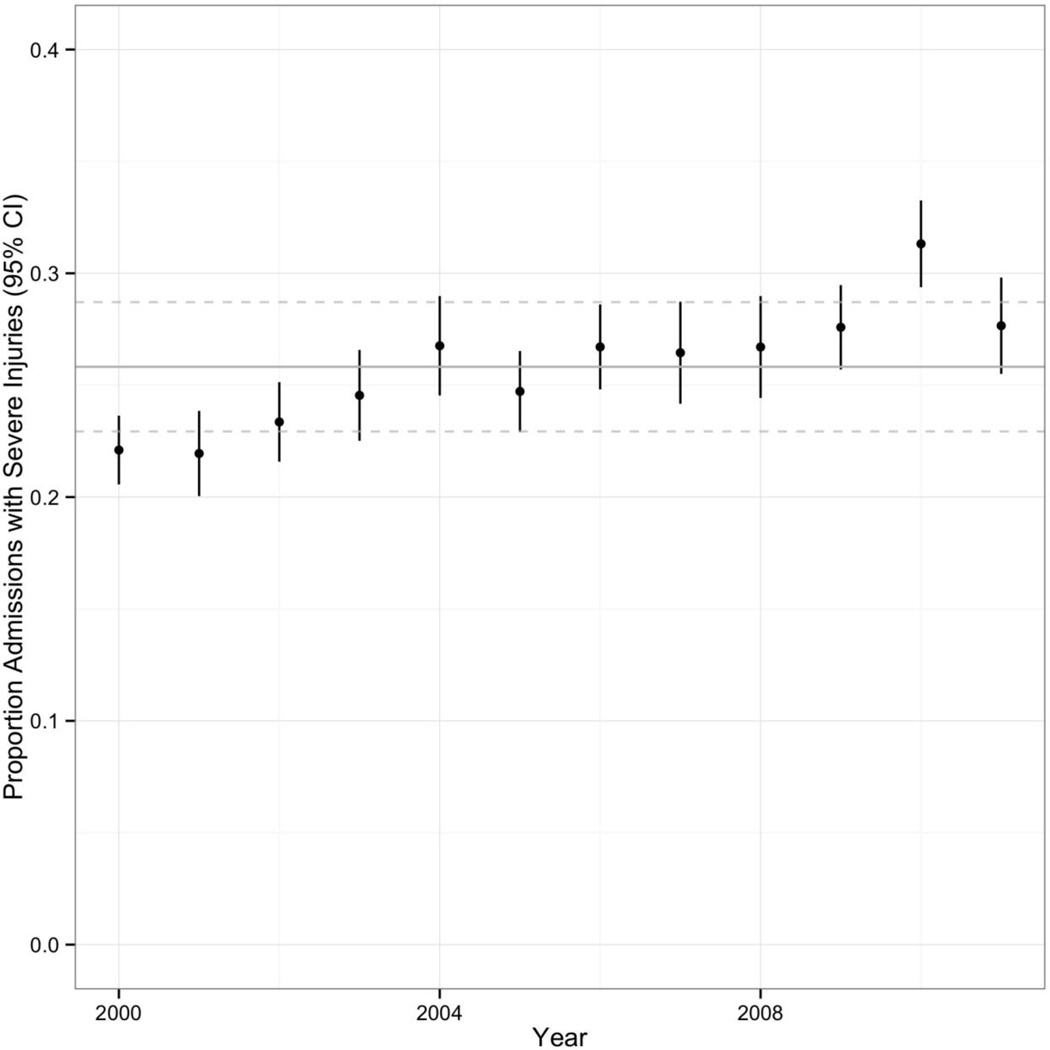
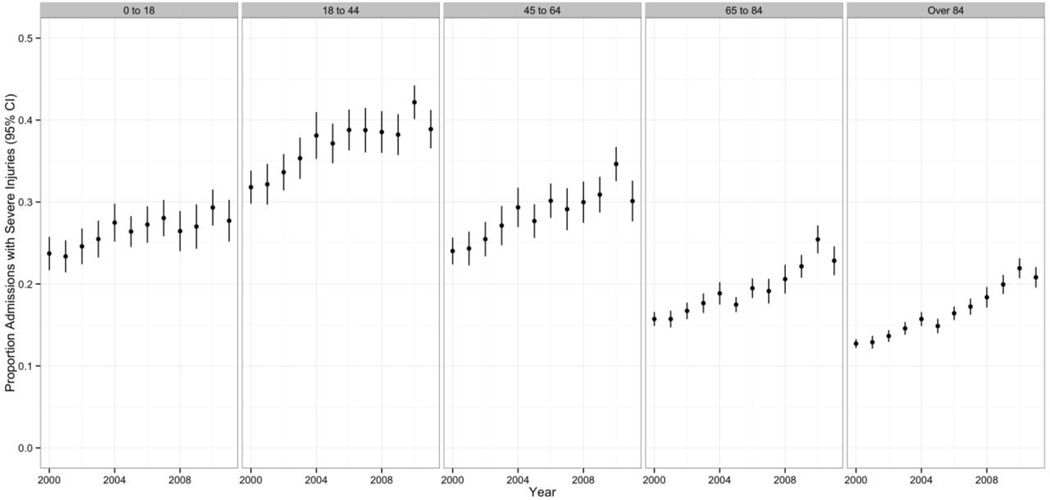
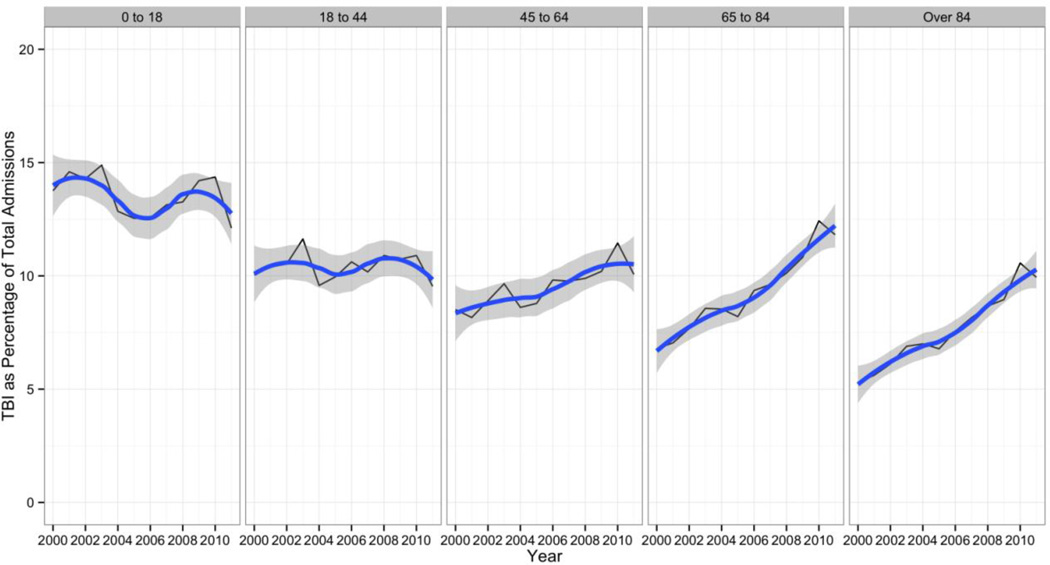
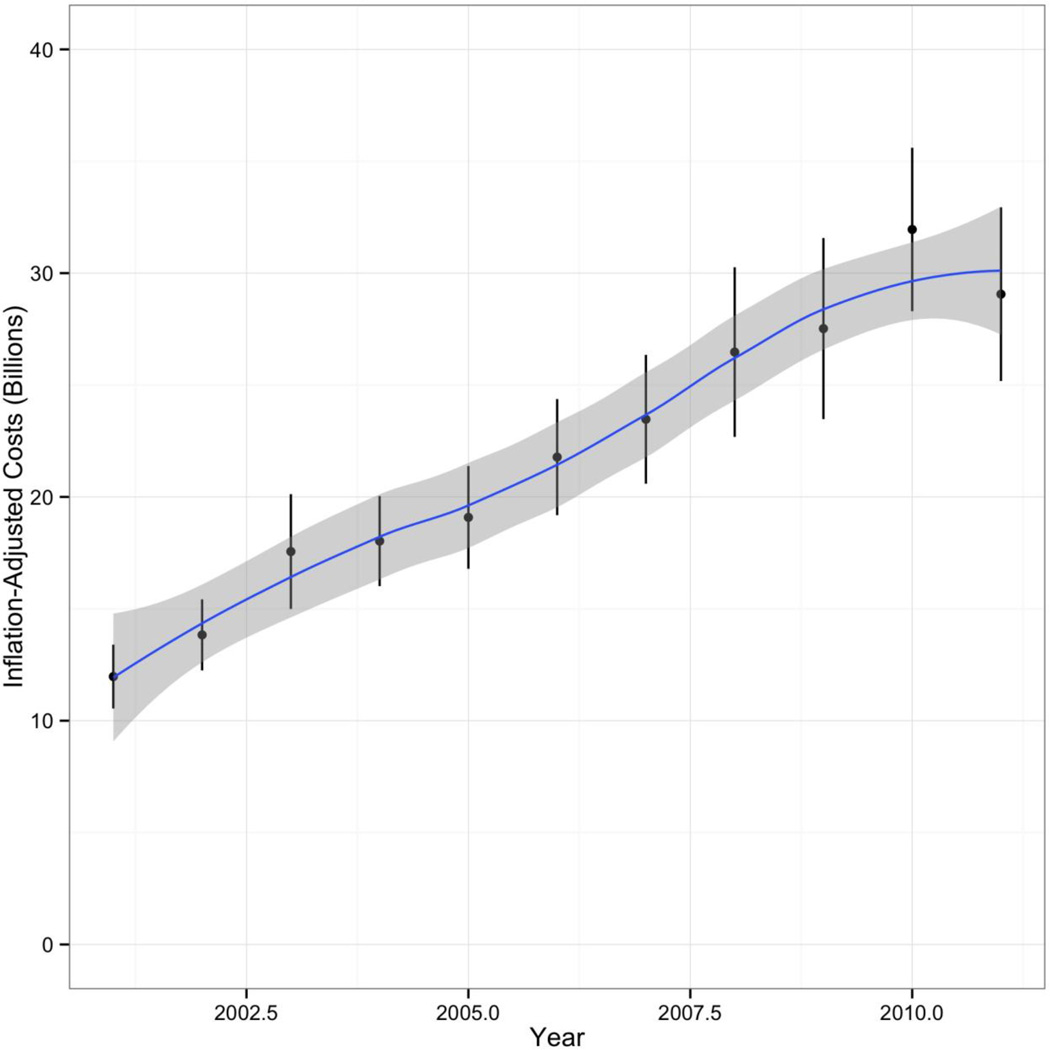
Results: The mean age of a person discharged from a US hospital with a trauma diagnosis increased from 54.08 (s.e.=0.71) in 2000 to 59.58 (s.e.=0.79) in 2011. Persons age 45-64 were the only age group to experience increasing rates of hospital discharges for trauma. The proportion of trauma discharges with a Charlson Comorbidity Index score greater than or equal to 3 nearly tripled from 0.048 (s.e.=0.0015) of all traumatic injury discharges in 2000 to 0.139 (s.e.=0.005) in 2011. The proportion of patients with traumatic injury classified as severe increased from 22% of all trauma discharges in 2000 (95% CI 21, 24) to 28% in 2011 (95% CI 26, 30). Level 1 trauma centres accounted for approximately 3.3% of hospitals. The proportion of severely injured trauma discharges from Level 1 trauma centres was 39.4% (95% CI 36.8, 42.1). Falls, followed by motor-vehicle crashes, were the most common causes of all injuries. The total cost of trauma-related inpatient care between 2001 and 2011 in the US was $240.7 billion (95% CI 231.0, 250.5). Annual total US inpatient trauma-related hospital costs increased each year between 2001 and 2011, more than doubling from $12.0 billion (95% CI 10.5, 13.4) in 2001 to 29.1 billion (95% CI 25.2, 32.9) in 2011.
Conclusions: Trauma, which has traditionally been viewed as a predicament of the young, is increasingly a disease of the old. The strain of managing the progressively complex and costly care associated with this shift rests with a small number of trauma centres. Optimal care of injured patients requires a reappraisal of the resources required to effectively provide it given a mounting burden.
Keywords: Epidemiology; Injury; Trauma.
Copyright © 2016 Elsevier Ltd. All rights reserved.
Conflict of interest statement
Conflict of Interest. The authors have no conflicts of interest to declare.
Figures
References
-
- CDC. Saving Lives and Protecting People from Violence and Injuries. [Accessed: 14 September 2014];Centers for Disease Control and Prevention. http://www.cdc.gov/injury/overview/index.html.
-
- Segui-Gomez M, MacKenzie E. Measuring the public health impact of injuries. Epidemiol Rev. 2003;25:3–19. - PubMed
-
- Kauvar D, Sarfati M, Kraiss L. National trauma databank analysis of mortality and limb loss in isolated lower extremity vascular trauma. J Vasc Surg. 2011;53(6):1598–1603. - PubMed
MeSH terms
Grants and funding
LinkOut - more resources
Full Text Sources
Other Literature Sources
Medical
