

Probability Distributome: A Web Computational Infrastructure for Exploring the Properties, Interrelations, and Applications of Probability Distributions
- PMID: 27158191
- PMCID: PMC4856044
- DOI: 10.1007/s00180-015-0594-6
Probability Distributome: A Web Computational Infrastructure for Exploring the Properties, Interrelations, and Applications of Probability Distributions
Abstract
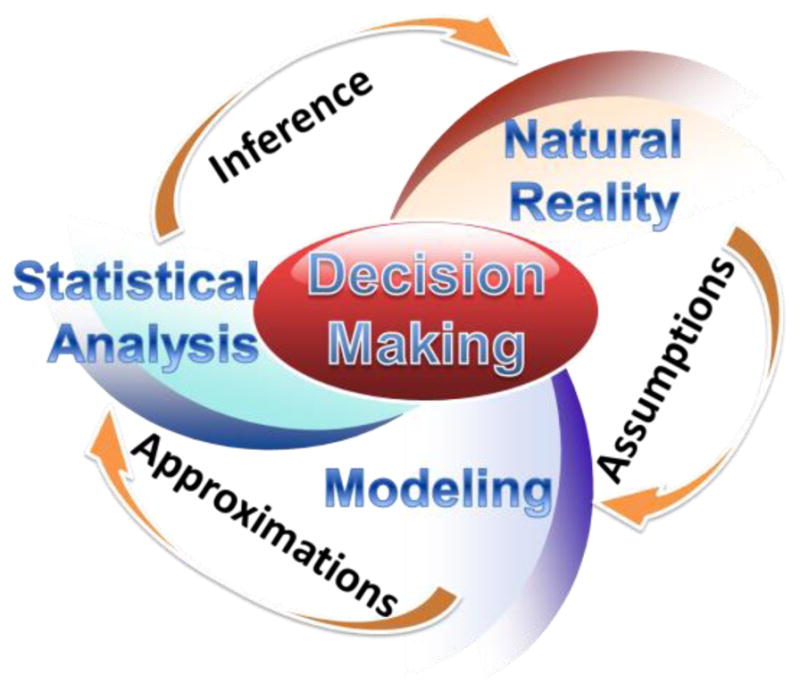
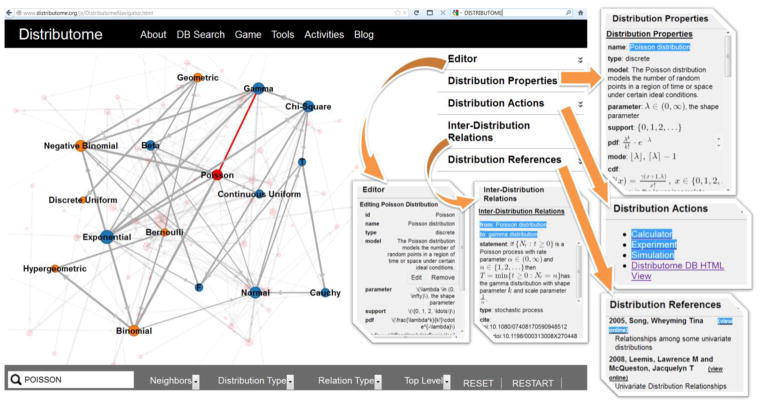
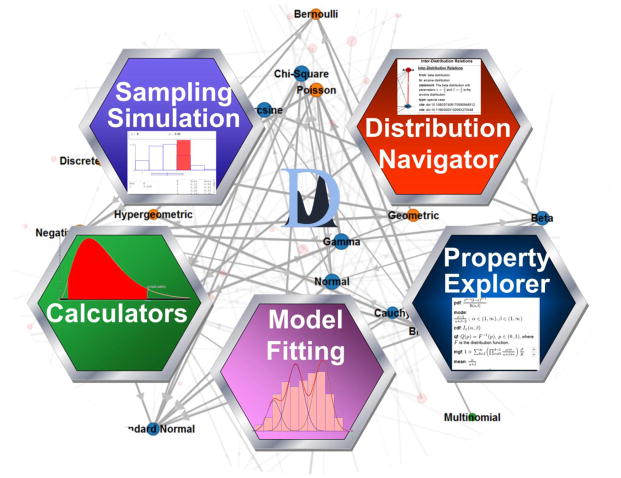
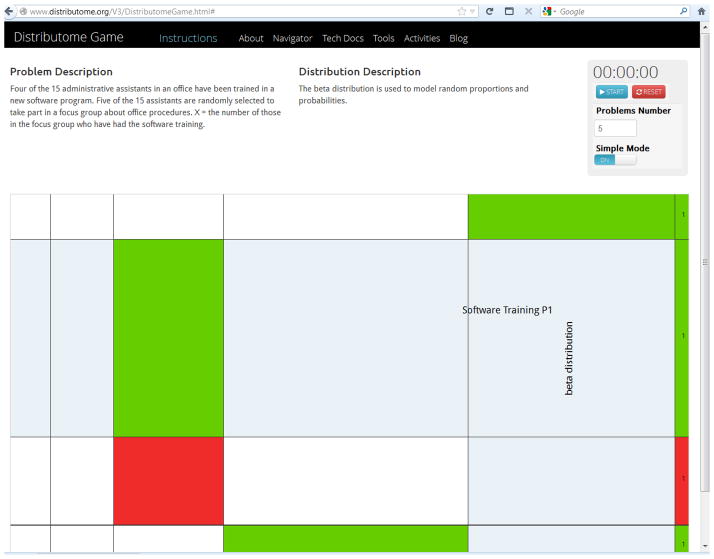
Probability distributions are useful for modeling, simulation, analysis, and inference on varieties of natural processes and physical phenomena. There are uncountably many probability distributions. However, a few dozen families of distributions are commonly defined and are frequently used in practice for problem solving, experimental applications, and theoretical studies. In this paper, we present a new computational and graphical infrastructure, the Distributome, which facilitates the discovery, exploration and application of diverse spectra of probability distributions. The extensible Distributome infrastructure provides interfaces for (human and machine) traversal, search, and navigation of all common probability distributions. It also enables distribution modeling, applications, investigation of inter-distribution relations, as well as their analytical representations and computational utilization. The entire Distributome framework is designed and implemented as an open-source, community-built, and Internet-accessible infrastructure. It is portable, extensible and compatible with HTML5 and Web2.0 standards (http://Distributome.org). We demonstrate two types of applications of the probability Distributome resources: computational research and science education. The Distributome tools may be employed to address five complementary computational modeling applications (simulation, data-analysis and inference, model-fitting, examination of the analytical, mathematical and computational properties of specific probability distributions, and exploration of the inter-distributional relations). Many high school and college science, technology, engineering and mathematics (STEM) courses may be enriched by the use of modern pedagogical approaches and technology-enhanced methods. The Distributome resources provide enhancements for blended STEM education by improving student motivation, augmenting the classical curriculum with interactive webapps, and overhauling the learning assessment protocols.
Keywords: Distributome; Probability distributions; applications; graphical user interface; inference; models; transformations.
Conflict of interest statement
The authors do not have potential conflicts of interest outside of the funding sources referred to in the acknowledgment section. The results of this research did not involve human participants, animals, or data derived from human or animal studies.
Figures

References
-
- Leo WR. Techniques for nuclear and particle physics experiments: a how-to approach. Springer Verlag; 1994.
-
- Nichols TE, et al. Spatiotemporal reconstruction of list-mode PET data. Medical Imaging, IEEE Transactions on. 2002;21(4):396–404. - PubMed
-
- Musa JD, Okumoto K. A logarithmic Poisson execution time model for software reliability measurement. Proceedings of the 7th international conference on Software engineering; IEEE Press; 1984.
Grants and funding
LinkOut - more resources
Full Text Sources
Other Literature Sources