. 2016 Apr 7;1(4):e86288.
doi: 10.1172/jci.insight.86288.

Chronic lymphocytic leukemia cells diversify and differentiate in vivo via a nonclassical Th1-dependent, Bcl-6-deficient process

Affiliations

Chronic lymphocytic leukemia cells diversify and differentiate in vivo via a nonclassical Th1-dependent, Bcl-6-deficient process

Piers E M Patten et al. JCI Insight. .

Abstract

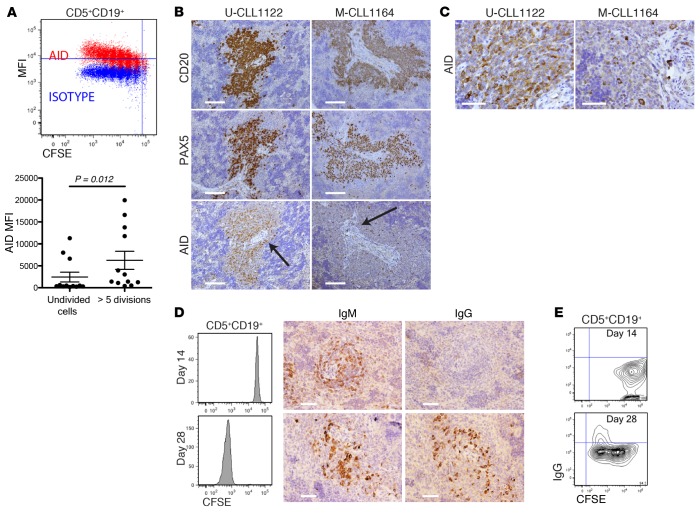
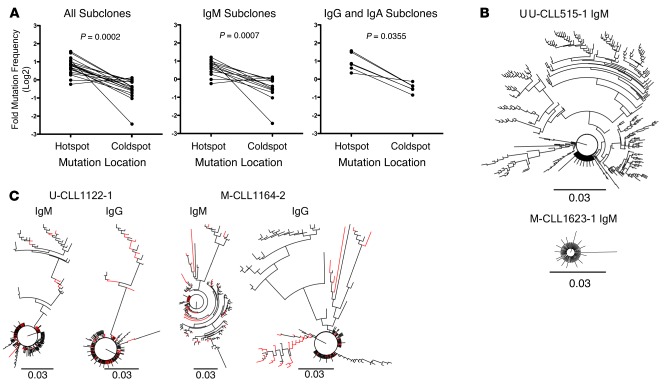
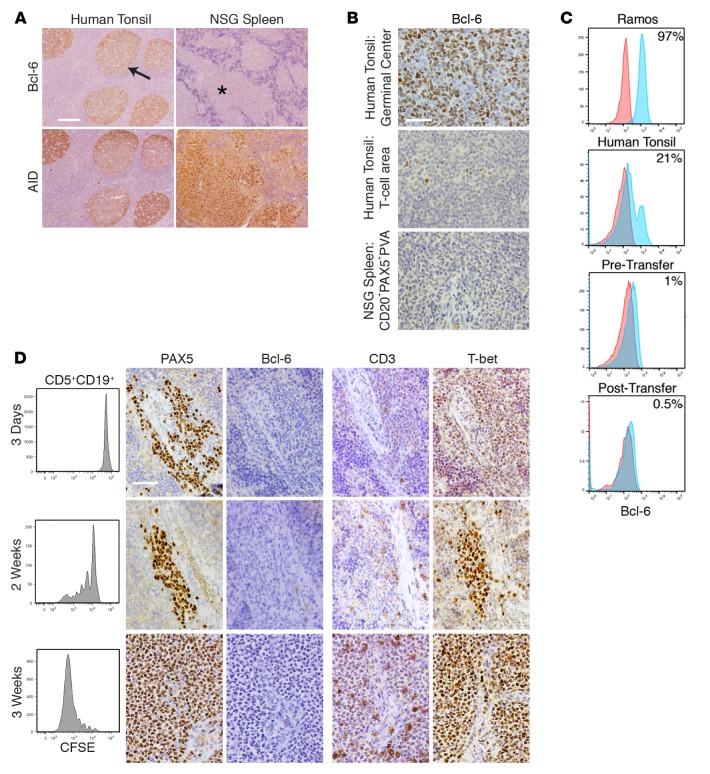
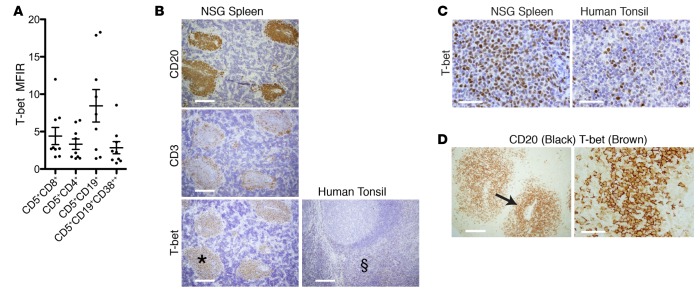
Xenografting primary tumor cells allows modeling of the heterogeneous natures of malignant diseases and the influences of the tissue microenvironment. Here, we demonstrate that xenografting primary chronic lymphocytic leukemia (CLL) B lymphocytes with activated autologous T cells into alymphoid mice results in considerable CLL B cell division and sizable T cell expansion. Nevertheless, most/all CD5+CD19+ cells are eventually lost, due in part to differentiation into antibody-secreting plasmablasts/plasma cells. CLL B cell differentiation is associated with isotype class switching and development of new IGHV-D-J mutations and occurs via an activation-induced deaminase-dependent pathway that upregulates IRF4 and Blimp-1 without appreciable levels of the expected Bcl-6. These processes were induced in IGHV-unmutated and IGHV-mutated clones by Th1-polarized T-bet+ T cells, not classical T follicular helper (Tfh) cells. Thus, the block in B cell maturation, defects in T cell action, and absence of antigen-receptor diversification, which are often cardinal characteristics of CLL, are not inherent but imposed by external signals and the microenvironment. Although these activities are not dominant features in human CLL, each occurs in tissue proliferation centers where the mechanisms responsible for clonal evolution operate. Thus, in this setting, CLL B cell diversification and differentiation develop by a nonclassical germinal center-like reaction that might reflect the cell of origin of this leukemia.


Figures

Figure 1
Figure 1. Transfer of CLL B cells into NSG mice can lead to terminal differentiation of cells into plasmablasts/plasma cells.
(A) Analysis of mCD45hCD4hCD8 cells from spleens reveals a hCD45+ subpopulation strongly expressing CD38 (CD38++) that are larger but with less CD19 (MFI: CD38++ = 1,178 vs. CD38 = 7,157) and CD5 (MFI: CD38++ = 8,508 vs. CD38 = 9,763) intensities. A CD38++ subset expresses CD138 (19.7%). When FACS-sorted, this population (*) used the clonal, patient-specific IGHV-D-J rearrangement. (B) Representative immunohistology (IH) of a CD20+PAX5+ perivascular aggregate (PVA). Arrow identifies vessel. Scale bar: 250 μm. (C) Representative IH of human IgM, IgG, Igκ, and Igλ in a CD20+PAX5+PVA. Scale bar: 250 μm. (D) Igκ staining of area indicated by arrow in C showing denser Ig at the CD20+PAX5+PVAs rims. H&E staining reveals a plasmablast/plasma cell (PC) morphology. Scale bar: 10 μm. (E) Representative H&E and IH of area with cells having PC morphology shows expression of CD38, PC-marker VS38c, and CD138 in a subset of cells. Scale bar: 50 μm. (F) Representative immunofluorescence staining of a CD20+PAX5+PVA rim, as indicated by arrows in C. Blue, nuclear stain; red, CD20; and green, Igκ. Scale bar: 10 μm. Preceding data derived from 13 chronic lymphocytic leukemia (CLL) cases in 13 independent experiments involving 51 mice with T cell expansion (Table 1). m, murine; h, human; MFI, mean fluorescence intensity; NSG, NOD/Shi-scid,γcnull; PVA, perivascular aggregate.
Figure 2
Figure 2. CLL-derived plasma cells and plasma Ig only become apparent after leukemic cells have undergone many divisions.
(A) Human (h) CD45+CD5+CD19+CD38++ cells are only identified in spleen-residing cells 21 days after chronic lymphocytic leukemia (CLL) cell transfer. Cells increase in number afterward. Mean and SEM shown; 1-way ANOVA; n = 60 mice. (B) Representative FC plots of CFSE-labeled hCD45+CD5+CD19+ cells in spleen following transfer of U-CLL1122 (upper) and M-CLL1164 (lower). Note development of CD38++ phenotype with progressive division. (C) hCD45+CD5+CD19+ cells with a CD38++ phenotype are only apparent after >60% of CLL cells have undergone ≥6 divisions. Curve shows exponential relationship (r2 = 0.76; n = 60). (D) Plasma Igs are not detectable until CD38++ cells appear. Mean μg/ml and SEM shown for IgM and IgG; n = 60 mice. Above results obtained from 5 mice euthanized at each time point in 2 independent experiments involving U-CLL1122 and M-CLL1164 (total mice = 60; Table 1 and Supplemental Table 2). U-CLL, CLL clone with IGHV sequence differing ≤2% from most similar germline gene; M-CLL, CLL clone with IGHV sequence differing >2% from most similar germline gene; FC, flow cytometry.
Figure 3
Figure 3. Dividing CLL B cells express activation-induced cytosine deaminase (AID) protein that correlates with class switch recombination (CSR).
(A) AID expression in spleen-residing human (h) CD45+CD5+CD19+ cells increases as cells divide. Representative FC of single cell splenic suspensions. Significantly higher AID protein is found in the most divided chronic lymphocytic leukemia (CLL) B cells. Mean and SEM shown. Data from 3 independent experiments involving 12 mice; mice euthanized between days 14 and 28; Mann-Whitney test result. (B) AID+ cells are localized in CD20+PAX5+PVAs. ×20 images of CD20, PAX5, and AID; scale bars: 125 μm. (C) ×60 images of AID in areas indicated by arrows in B for U-CLL1122 and M-CLL1164 showing approximately 50% and 5% AID+ cells, respectively. Scale bar: 50 μm. For B and C, representative data of mice sampled from 11 independent experiments showing approximately highest and lowest extremes of AID+ cells identified in vivo. (D) Switching to IgG becomes evident after CLL B cells have divided multiple times. FC and matching IH of CFSE-labeled CD5+CD19+ cells for IgM and IgG. Undivided cells produce only IgM and not IgG (upper), whereas multiply divided CLL B cells make both isotypes (lower). Representative data of mice sampled from 5 independent experiments. Scale bar: 50 μm (E). FC confirms splenic-residing hCD45+CD5+CD19+ cells undergo CSR. hCD5+CD19+ cells with only minimal division (day 14) do not express smIgG, whereas CD5+CD19+ cells from mice receiving the same CLL clone express smIgG after multiple divisions (day 28). Representative data of mice sampled from 3 independent experiments. U-CLL, CLL clone with IGHV sequence differing ≤2% from most similar germline gene; M-CLL, CLL clone with IGHV sequence differing >2% from most similar germline gene; FC, flow cytometry; IH, immunohistology; sm, surface membrane; MFI, mean fluorescence intensity.
Figure 4
Figure 4. Xenografted chronic lymphocytic leukemia (CLL) B cells demonstrate clonally related IgM and IgG IGHV-D-J mutations that exhibit hallmarks of AID action.
(A) AID hotspot and coldspot mutation frequencies were calculated from new IGHV-D-J mutations in 19 xenografted samples and log2 transformed for statistical analysis by Wilcoxon test (P = 0.0002, left). This indicated that AID hotspot mutation frequencies are significantly higher. The same was observed among IgM subclones (n = 13; P = 0.0007, center) and among Ig isotype-switched subclones (n = 6; P = 0.0355, right). (B) Representative phylogenetic relationships of new subclones are illustrated using a polar tree layout, with each branch tip representing a distinct subclone. The length that each branch extends from the circle is roughly proportional to the number of mutations (K80 phylogenetic distance, scale bar: 0.03). Subclones with single mutations are indicated by branch tips extending a short distance from the circle, while multiple-mutated subclones are represented by tips extending farther out. The branches connecting each tip illustrate the sequence-relatedness between subclones, with closely related sequences clustered together. Total number of subclones, defined by changes in DNA sequence from that of the initial clone and from those of subclones present in vivo at the time of sampling can be determined by counting the number of terminal branch tips at various lengths from the circle’s center. U-CLL515-1 IgM subclone IGHV-D-J sequences describe a tree with large multibranched relationships (386 subclones with 1–25 mutations). M-CLL1623-1 IgM subclone IGHV-D-J sequences define a tree with few branched relationships (91 subclones with 1–7 mutations).(C) Comparison of IgM and IgG phylogenetic relationships from same sample are shown as in B. IgM and IgG relationships are shown for U-CLL1122-1 (173 subclones with 1–26 mutations and 225 subclones with 1–28 mutations, respectively) and M-CLL1164-2 (135 subclones with 1–35 mutations and 144 subclones with 1–32 mutations, respectively) with shared sequences indicated as red branches. U-CLL, CLL clone with IGHV sequence differing ≤2% from most similar germline gene; M-CLL, CLL clone with IGHV sequence differing >2% from most similar germline gene.
Figure 5
Figure 5. CLL B cell diversification and differentiation occurs without appreciable levels of Bcl-6 protein but in the presence of increasing levels of T-bet protein.
(A) Bcl-6+ cells are rarely found in CD20+PAX5+PVAs and are found less than in tonsillar T cell areas. Human tonsil shows Bcl-6+ cells within germinal centers (GCs) (arrow), whereas chronic lymphocytic leukemia (CLL) cells within CD20+PAX5+PVAs (*) are Bcl-6. Conversely, AID+ cells are found on serial sections in both tissues. Scale bar: 250 μm. (B) High-power views of Bcl-6 staining in tonsillar GC, tonsillar T cell area, and xenografted CLL cells within CD20+PAX5+PVA. Scale bar: 50 μm. For A and B, representative data of mice sampled from 13 independent experiments. (C) Representative FC indicates that ≤1% Bcl-6+ cells are found among CD5+CD19+ cells before and after xenografting. This is compared with Ramos cells and from human tonsil cells (CD19+ only). Data are representative of 7 CLL samples analyzed pretransfer and 5 independent xenograft experiments sampling 41 mice. (D) Bcl-6 production does not appear/change upon commencement of B cell division. In contrast, T-bet expression within CD20+PAX5+PVAs becomes more intense. Analysis of CLL transfers at 3 days, 2 weeks, and 3 weeks. Each shows FC of CFSE-labeled CD5+CD19+ cells with companion IH images for PAX5, Bcl-6, CD3, and T-bet. Representative FC and IH images from 5 mice euthanized at each time point in 2 independent experiments involving U-CLL1122 and M-CLL1164. Scale bar: 50 μm. U-CLL, CLL clone with IGHV sequence differing ≤2% from most similar germline gene; M-CLL, CLL clone with IGHV sequence differing >2% from most similar germline gene; PVA, perivascular aggregate; FC, flow cytometry; IH, immunohistology; NSG, NOD/Shi-scid,γcnull; AID, activation-induced cytidine deaminase.
Figure 6
Figure 6. IRF4 and Blimp-1 protein are expressed during CLL B cell differentiation and diversification.
(A) Upper panels show FC of undivided CFSE-labeled human (h) CD45+CD5+CD19+ cells with companion IH images of IRF4 and PAX5 (day 3). Lower panels show FC of dividing CFSE-labeled hCD45+CD5+CD19+ cells with companion IH images of IRF4 and PAX5 (day 14). Scale bar: 50 μm. Representative data of mice sampled from 5 independent experiments. (B) IRF4 staining is seen within (arrow, upper left) and outside of (*, upper left) CD20+PAX5+PVAs, being expressed dimly by CD20+ cells and more intensely by cIg+ cells. Upper panels: dual IH images of CD20 (black) and IRF4 (brown); left hand panel (scale bar: 250 μm), with high-power view of area marked with arrow on right (scale bar: 50 μm). Lower panels: dual IH images of Igκ (black) and IRF4 (brown); left hand panel (scale bar: 250 μm), with high-power view of area marked with arrow on right (scale bar: 50 μm). Representative data of dual IH performed on mice sampled from 5 independent experiments. (C) Dual IH of spleen-residing cells 6 weeks following transfer indicates chronic lymphocytic leukemia (CLL) plasmablasts/plasma cells express IRF4 and Blimp-1. Scale bar: 10 μm. Representative data of mice sampled from 6 independent experiments. FC, flow cytometry; PVA, perivascular aggregate; IH, immunohistology; cIg, cytoplasmic immunoglobulin.
Figure 7
Figure 7. Th1 cells are involved in CLL B cell division and maturation.
(A) FC plots of pretransfer in vitro–activated chronic lymphocytic leukemia (CLL) CD4+ cells (upper) compared with spleen-residing CD4+ cells (lower) stained for ICOS, CXCR5, CD57 and PD1. Red, isotype control; blue, CD5+CD4+ cells. Numbers represent percentage of cells expressing each surface protein over isotype control. (B) IH of human tonsil and CLL cells from NSG spleen stained for ICOS, CD57, and PD1. Scale bar: 250 μm. Representative IH and FC from 5 (PD1), 6 (CD57), and 5 (ICOS) independent experiments. (C) IFNγ is the most frequent and abundant T cell–derived cytokine, and its levels correlate with T cell numbers and degree of expansion in mice. Better correlation exists for IFNγ than for IL-5. Data from 7 independent experiments, n = 77 mice. IFNγ becomes detectable (>10 pg/ml) 2 weeks following cell transfer and increases thereafter. Data from 30 mice for U-CLL1122, with 5 mice euthanized at each time point. Representative of 2 independent experiments. Dotted line indicates plasma level of 10 pg/ml. (D) Spleen-residing CD4+ cells express IFNγ from 2 weeks after transfer. Data from 2 independent experiments with 2 CLL cases (M-CLL0827 and M-CLL1024), 5 mice euthanized per case at 1 and 2 weeks after transfer, unpaired t test result, mean and SEM shown. Red, isotype control; blue, CD5+CD4+IFNγ+ cells. (E) T-bet expression increases in CD4+ cells and B cells and is maintained in CD8+ cells following xenografting. Pretransfer data from 8 CLL cases subsequently xenografted in 8 independent experiments. Wilcoxon test result. At euthanasia, all cases showed evidence for plasma cell maturation. U-CLL, CLL clone with IGHV sequence differing ≤2% from most similar germline gene; M-CLL, CLL clone with IGHV sequence differing >2% from most similar germline gene; FC, flow cytometry; IH, immunohistology; NSG, NOD/Shi-scid,γcnull.
Figure 8
Figure 8. Both B and T cells within CD20+PAX5+ perivascular aggregates (PVAs) express T-bet protein.
(A) T-bet is expressed by spleen-residing chronic lymphocytic leukemia (CLL) T cell and B cell populations at euthanasia. Data from 9 independent experiments with 9 CLL clones. Mean and SEM shown. (B and C) T-bet expression localizes to CD20+PAX5+PVAs and is of similar intensity to that in tonsillar T cell areas. (B) Human (h) CD20+, hCD3+, and hT-bet+ cells from NSG spleen. T-bet is also shown in tonsil. Scale bar: 250 μm. (C) High-power images of T-bet+ cells in a CD20+PAX5+PVA (area marked with * in B) and in the T cell area of tonsil (area marked with § in B). Scale bar: 250 μm. Spleen data representative of 13 independent experiments (n = 33 mice). (D) Dual IH shows that CD20+ and CD20 cells within CD20+PAX5+PVAs are T-bet+. Left panel: CD20 (black) and T-bet (brown) protein in CD20+PAX5+PVA. Scale bar: 250 μm. Right panel: High-power view of area marked by arrow. Scale bar: 50 μm. NSG, NOD/Shi-scid,γcnull; PVA, perivascular aggregate; IH, immunohistology; MFIR, mean fluorescence intensity ratio.

References

    1. Chiorazzi N, Rai KR, Ferrarini M. Chronic lymphocytic leukemia. N Engl J Med. 2005;352(8):804–815. doi: 10.1056/NEJMra041720. - DOI - PubMed
    1. Klein U, et al. Gene expression profiling of B cell chronic lymphocytic leukemia reveals a homogeneous phenotype related to memory B cells. J Exp Med. 2001;194(11):1625–1638. doi: 10.1084/jem.194.11.1625. - DOI - PMC - PubMed
    1. Rosenwald A, et al. Relation of gene expression phenotype to immunoglobulin mutation genotype in B cell chronic lymphocytic leukemia. J Exp Med. 2001;194(11):1639–1647. doi: 10.1084/jem.194.11.1639. - DOI - PMC - PubMed
    1. Damle RN, et al. B-cell chronic lymphocytic leukemia cells express a surface membrane phenotype of activated, antigen-experienced B lymphocytes. Blood. 2002;99(11):4087–4093. doi: 10.1182/blood.V99.11.4087. - DOI - PubMed
    1. Fais F, et al. Chronic lymphocytic leukemia B cells express restricted sets of mutated and unmutated antigen receptors. J Clin Invest. 1998;102(8):1515–1525. doi: 10.1172/JCI3009. - DOI - PMC - PubMed