. 2016 Apr;1(4):e86254.
doi: 10.1172/jci.insight.86254.

NFAT restricts osteochondroma formation from entheseal progenitors

Affiliations

NFAT restricts osteochondroma formation from entheseal progenitors

Xianpeng Ge et al. JCI Insight. 2016 Apr.

Abstract

Osteochondromas are common benign osteocartilaginous tumors in children and adolescents characterized by cartilage-capped bony projections on the surface of bones. These tumors often cause pain, deformity, fracture, and musculoskeletal dysfunction, and they occasionally undergo malignant transformation. The pathogenesis of osteochondromas remains poorly understood. Here, we demonstrate that nuclear factor of activated T cells c1 and c2 (NFATc1 and NFATc2) suppress osteochondromagenesis through individual and combinatorial mechanisms. In mice, conditional deletion of NFATc1 in mesenchymal limb progenitors, Scleraxis-expressing (Scx-expressing) tendoligamentous cells, or postnatally in Aggrecan-expressing cells resulted in osteochondroma formation at entheses, the insertion sites of ligaments and tendons onto bone. Combinatorial deletion of NFATc1 and NFATc2 gave rise to larger and more numerous osteochondromas in inverse proportion to gene dosage. A population of entheseal NFATc1- and Aggrecan-expressing cells was identified as the osteochondroma precursor, previously believed to be growth plate derived or perichondrium derived. Mechanistically, we show that NFATc1 restricts the proliferation and chondrogenesis of osteochondroma precursors. In contrast, NFATc2 preferentially inhibits chondrocyte hypertrophy and osteogenesis. Together, our findings identify and characterize a mechanism of osteochondroma formation and suggest that regulating NFAT activity is a new therapeutic approach for skeletal diseases characterized by defective or exaggerated osteochondral growth.


Figures

Figure 1
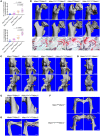
Figure 1. Ablation of nuclear factor of activated T cells c1 (NFATc1) in limb mesenchymal progenitors and postnatal Aggrecan-expressing cells causes osteochondromas at entheseal sites.
(A) Gross (left panels) and 3-D μCT images (right panels) showing ectopic osteocartilaginous outgrowths (arrows) at the proximal tibia of 16-week-old Nfatc1Prx1 mice. Scale bars: 1.0 mm. Images are representative of 8 mice per genotype. (B) Safranin O/fast green stain of coronal sections of mouse knee joints showing abnormal outgrowths in Nfatc1Prx1 mice located at the tibial medial collateral ligament (MCL) enthesis and displaying features of osteochondromas, including a cartilaginous cap (*) and the marrow cavity (#), continuous with that of underlying bone. Scale bars: 100 μm. (C) Illustration showing tamoxifen-induced Cre-mediated recombination of the mTmG reporter allele in Aggrecan+ cells from Aggrecan-CreERT2;Rosa26-mTmGfl/+ (AggCreER;mTmG) mice leading to membrane GFP expression (upper left panel). GFP fluorescence in the growth plate (GP, lower left panel), articular cartilage, meniscus (M, upper right panel), and a subset of cells at the tibial MCL enthesis (lower right panel) in AggCreER;mTmG mice 1 month after tamoxifen administration. Scale bars: 100 μm. CB, cortical bone. Images are representative of 5 mice. (D) In vivo (left and middle panels) and ex vivo (right panels) 3-D μCT images showing osteochondroma formation at the tibial MCL enthesis (arrows) 1 and 3 months after tamoxifen pulse of an 8-week-old Nfatc1AggCreER mouse. Scale bars: 5.0 mm (left and middle panels), 1.0 mm (right panels). Images are representative of 10 mice per genotype.
Figure 2
Figure 2. Nuclear factor of activated T cells (NFAT) gene dosage determines the severity of osteochondromas.
(A) One month after tamoxifen pulse in 8- or 12-week-old mice, representative μCT images and safranin O/fast green (SF) staining showing osteochondroma formation at the tibial medial collateral ligament (MCL) entheses in Nfatc1AggCreERNfatc2+/– and Nfatc1AggCreERNfatc2–/– mice. Images are representative of 10 (Nfatc1fl/flNfatc2+/–), 10 (Nfatc1AggCreERNfatc2+/–), 7 (Nfatc1fl/flNfatc2–/–), and 11 (Nfatc1AggCreERNfatc2–/–) animals. (B) Representative H&E staining locating the osteochondroma at the tibial MCL enthesis in Nfatc1AggCreERNfatc2+/– mice 1 month after tamoxifen pulse. (C) Representative μCT images and SF stain displaying faster progression of osteochondromas at the tibial MCL enthesis in Nfatc1AggCreERNfatc2–/– mice than those in Nfatc1AggCreERNfatc2+/–, and osteogenesis in Nfatc1fl/flNfatc2–/– mice 3 months after tamoxifen. (D) Penetrance of osteochondromas at the tibial MCL entheses is inversely proportional to the gene dosage of Nfatc1 and Nfatc2 three months after tamoxifen pulse in 8- or 12-week-old mice. In cases where the Nfatc2 genotype is not noted, the mice were Nfatc2+/+. Linear regression analysis was performed as indicated. * in B and C represent MCL. Scale bars: 1.0 mm (A and C, upper panels), 100 μm (A, lower panels; B; and C, middle and lower panels).
Figure 3
Figure 3. Timing of nuclear factors of activated T cells (NFAT) deletion affects the severity of osteochondromas.
In vivo and ex vivo μCT images showing progressive development of osteochondromas (arrows) at the tibial medial collateral ligament (MCL) enthesis in Nfatc1AggCreERNfatc2+/– and Nfatc1AggCreERNfatc2–/– but not Nfatc1fl/flNfatc2+/– and Nfatc1fl/flNfatc2–/– mice treated at 2 weeks of age with tamoxifen. Scale bars: 5.0 mm (left 3 panels), 1.0 mm (right panels). Images are representative of 4 or 5 mice per genotype.
Figure 4
Figure 4. Osteochondroma formation at other locations after combinatorial deletion of nuclear factor of activated T cells c1 and c2 (Nfatc1 and Nfatc2) in postnatal Aggrecan-expressing cells.
(A) Quantification of osteochondromas around hip joints 1 (n = 10, 10, 7, and 11 for Nfatc1fl/flNfatc2+/–, Nfatc1AggCreERNfatc2+/–, Nfatc1fl/flNfatc2–/–, and Nfatc1AggCreERNfatc2–/– mice, respectively) and 3 (n = 10, 10, 11, and 14 animals, respectively) months after tamoxifen pulse in 8- or 12-week-old mice. One-way ANOVA followed by Tukey’s test were performed. (B) Ex vivo μCT images and safranin O/fast green–stained histology of the hip joints of mice with the indicated genotypes 3 months after tamoxifen administration to 8- or 12-week-old mice. Arrows, osteochondromas. (C) Representative μCT images showing osteochondroma formation at the epiphyses of knee joints (arrows). (D and E) Representative μCT images of osteochondroma formation at distal and proximal femurs (arrows). (F and G) Representative μCT images of osteochondromas around shoulder joins (F, circles), at the proximal humerus (F, arrows), and at the scapula (G). Scale bars: 1.0 mm (except in B, lower panels, 100 μm).
Figure 5
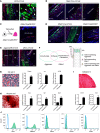
Figure 5. Aggrecan- and nuclear factor of activated T cells c1–expressing (NFATc1-expressing) cells at the enthesis are precursors of osteochondromas.
(A) Fluorescent images of frozen sections of the knee joints from Nfatc1AggCreERNfatc2–/–;Rosa26-mTmGfl/+ (DKO;mTmG) mice 1 month after tamoxifen showing the majority of cells in osteochondromas are GFP+ (left panel). The image of higher magnification (right panel) reveals that cells without Cre recombination (white arrowheads) are also present. (B) Fluorescent images of knee joints from Nfatc1Cre;mTmG mice displaying Nfatc1 not expressed in growth plate (GP) cells. (C) Illustration showing tamoxifen-induced Cre-mediated recombination of the red fluorescence protein (RFP) reporter allele in Nfatc1+ cells from Nfatc1-CreERT2;Rosa26-RFPfl/+ (Nfatc1CreER;RFP) mice leading to RFP expression (left panel). RFP fluorescence not detectable in GP cells 48 hours after tamoxifen pulse in 8-week-old Nfatc1CreER;RFP mice (right panel). (D) Fluorescent images of knee joints showing Nfatc1 expression in cells of the tibial medial collateral ligament (MCL) entheses and the perichondrium (PC)/periosteum (PO). (E) Fluorescent images of knee joints from AggCreER;mTmG and DKO;mTmG mice demonstrating cells in the periosteum adjacent to the MCL enthesis do not express Aggrecan (right panel, white arrowheads). GFP+ cells in left panel are in continuity with those at the MCL enthesis. OCM, osteochondroma. Images are representative of 4 or 5 mice per genotype except C, in which 2 mice are used. (F) Schematics showing a subpopulation of cells at the tibial MCL enthesis expressing both Nfatc1 and Aggrecan. (GI) Oil Red O, Alizarin Red S, and Safranin O staining, as well as quantitative PCR (qPCR) analyses, demonstrating adipogenic, osteogenic, and chondrogenic capacities of Aggrecan+ cells cultured ex vivo under lineage-specific differentiating conditions. (J) Flow cytometric analysis of stem cell (Sca1, CD90, and CD44), hematopoietic cell (CD45), and endothelial cell (CD31) markers in Aggrecan+ cells from AggCreER;mTmG mice. n = 3 animals per group. Scale bars: 100 μm (except in A, right panel, 25 μm).
Figure 6
Figure 6. Nuclear factor of activated T cells c1 (NFATc1) deletion in Scleraxis-expressing entheseal progenitors results in osteochondromas.
(A) μCT images and safranin O/fast green stain showing osteochondroma formation at the tibial medial collateral ligament (MCL) entheses of 16-week-old Nfatc1ScxNfatc2+/– and Nfatc1ScxNfatc2–/– mice (orange arrows; *, cartilage caps; #, marrow cavities), and osteogenesis in Nfatc1fl/fl Nfatc2–/– mice. (B) μCT images and quantification of the number of osteochondromas at the hip joints of 16-week-old mice. Images are representative of 8 (Nfatc1fl/flNfatc2+/–), 8 (Nfatc1ScxNfatc2+/–), 9 (Nfatc1fl/flNfatc2–/–), and 10 (Nfatc1ScxNfatc2–/–) animals. One-way ANOVA followed by Tukey’s test were performed. (C) Representative images of 18-day-old animals showing short stature of Nfatc1ScxNfatc2–/– mice compared with Nfatc1fl/flNfatc2–/– mice. (D) μCT images displaying dislocation of elbow joints in 18-day-old female Nfatc1ScxNfatc2–/– mice (arrow). (E) μCT images showing osteochondroma formation and dislocation of ankle joint in 4-week-old Nfatc1ScxNfatc2–/– mice (arrows). Scale bars: 1.0 mm (except in A, lower panels, 100 μm).
Figure 7
Figure 7. Ablation of nuclear factor of activated T cells c1 or c2 (NFATc1 or NFATc2) differentially affects proliferation of entheseal progenitors.
(A) Schematic for isolating GFP+ cells from the tibial medial collateral ligament (MCL) entheses of mice with indicated genotypes 1 week after tamoxifen. GFP+ cells were flow-sorted after 7 days of ex vivo expansion. (B and C) Cells from Nfatc1-KO;mTmG mice displaying increased proliferation as measured by cell count (B, n = 3) and alamarBlue reduction (C, n = 6). (D) Representative anti–proliferating cell nuclear antigen (PCNA) IHC and quantification of PCNA+ cells at the tibial entheses of Nfatc1fl/flNfatc2+/– and Nfatc1AggCreERNfatc2+/– mice 2 weeks after tamoxifen (n = 3 animals). Scale bars: 100 μm. (E) Cell proliferation assay of ATDC5 lines lacking Nfatc1, Nfatc2, or both under nondifferentiating conditions (n = 3 per sample). (F and G) Cell proliferation analyses by alamarBlue assay (F, n = 8 per sample), micromass diameter (G, n = 10 per sample), and representative micromass images after 2 weeks of micromass culture in chondrogenic media. Original magnification for the image in G: ×1. (H) Expression of cell cycle genes in ATDC5 cells overexpressing constitutively active NFATc1 (caNFATc1) by real-time PCR (n = 3 independent infections per sample). (I) Expression of c-Myc and P21 genes in ATDC5 lines lacking Nfatc1, Nfatc2, or both (n = 6 per sample). Representative results of 3 independent experiments are presented. Two-way ANOVA followed by Tukey’s (in B and E) or Sidak’s (in H) tests were performed. P values in C, F, G, and I were determined by 1-way ANOVA followed by Tukey’s tests. Two-tailed Student’s t tests were performed for D.
Figure 8
Figure 8. Nuclear factor of activated T cells c1 and c2 (NFATc1 and NFATc2) differentially repress genes characterizing endochondral ossification and osteogenesis.
(A and B) Expression of Col2a1, Col10a1, Mmp13, and Ibsp in ATDC5 cell lines with CRISP/Cas9-mediated deletion of Nfatc1 or Nfatc2 compared with Vector control after 2 weeks of micromass culture in chondrogenic media. (C and D) Expression of Col2a1, Col10a1, Mmp13, and Ibsp in GFP+ cells isolated from the tibial medial collateral ligament (MCL) entheses of AggCreER;mTmG, Nfatc1-KO;mTmG, and Nfatc2-KO;mTmG mice and cultured for 1 week ex vivo. (E and F) Expression of Tnsalp, Col1a1, Comp, and Bglap in the GFP+ cells from AggCreER;mTmG, Nfatc1-KO;mTmG, and Nfatc2-KO;mTmG mice. Gene expression was measured by real-time PCR using hypoxanthine phosphoribosyltransferase (Hprt) for normalization. n = 3 per sample. Results are representative of 5 (A and B) or 3 (CF) independent experiments. P values were determined by 1-way ANOVA followed by Tukey’s tests for multiple comparisons.

References

    1. Zhou S, et al. FGFR3 deficiency causes multiple chondroma-like lesions by upregulating hedgehog signaling. PLoS Genet. 2015;11(6):e86254. doi: 10.1371/journal.pgen.1005214. - DOI - PMC - PubMed
    1. Bovee JV, Hogendoom PC, Wunder JS, Alman BA. Cartilage tumours and bone development: molecular pathology and possible therapeutic targets. Nat Rev Cancer. 2010;10(7):481–488. doi: 10.1038/nrc2869. - DOI - PubMed
    1. Huegel J, Enomoto-Iwamoto M, Sgariglia F, Koyama E, Pacifici M. Heparanase stimulates chondrogenesis and is up-regulated in human ectopic cartilage: a mechanism possibly involved in hereditary multiple exostoses. Am J Pathol. 2015;185(6):1676–1685. doi: 10.1016/j.ajpath.2015.02.014. - DOI - PMC - PubMed
    1. Khurana J, Abdul-Karim F, Bovee JVMG. Osteochondroma. In: Fletcher CDM, Bridge JA, Hogendoorn PCW, Mertens F, eds. WHO Classification of Tumours of Soft Tissue and Bone. 4th ed. Lyon, France: International Agency for Research on Cancer; 2013:234–236.
    1. Kitsoulis P, et al. Osteochondromas: review of the clinical, radiological and pathological features. In Vivo. 2008;22(5):633–646. - PubMed