. 2016 Apr;1(4):e86355.
doi: 10.1172/jci.insight.86355.

Eosinophilic esophagitis-linked calpain 14 is an IL-13-induced protease that mediates esophageal epithelial barrier impairment

Affiliations

Eosinophilic esophagitis-linked calpain 14 is an IL-13-induced protease that mediates esophageal epithelial barrier impairment

Benjamin P Davis et al. JCI Insight. 2016 Apr.

Abstract

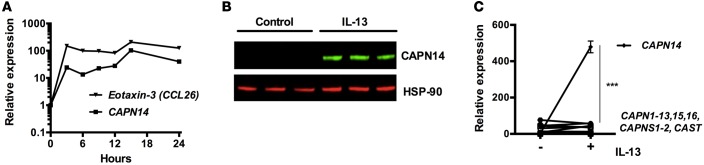
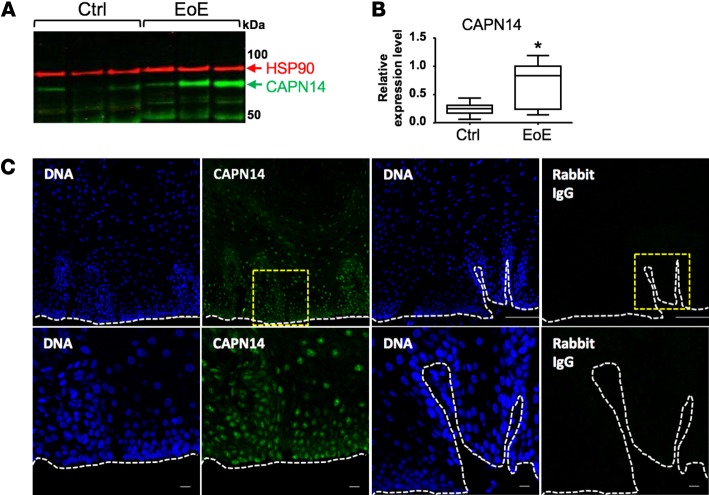
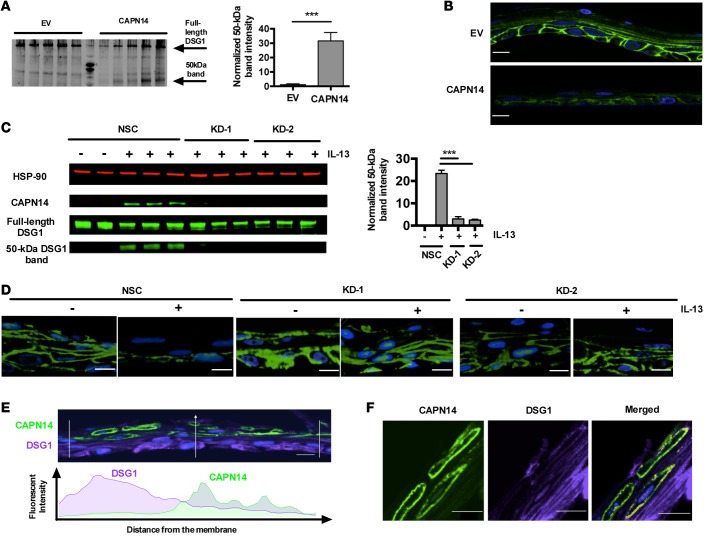
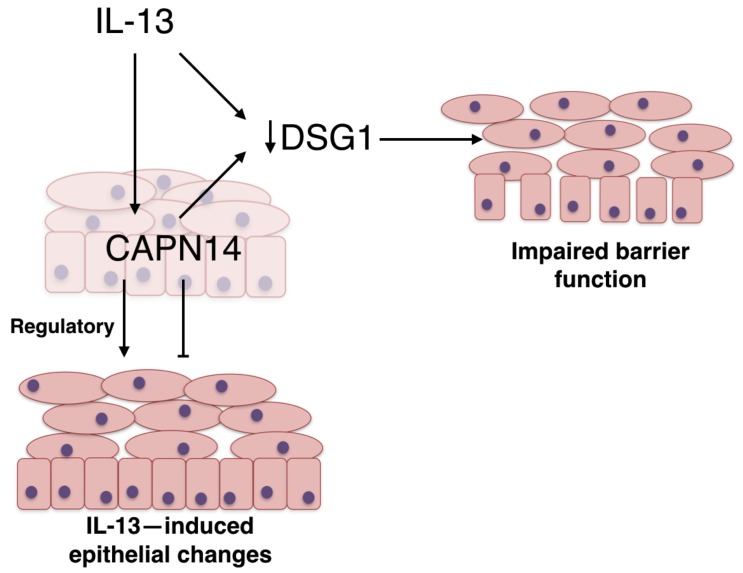
We recently identified a genome-wide genetic association of eosinophilic esophagitis (EoE) at 2p23 spanning the calpain 14 (CAPN14) gene, yet the causal mechanism has not been elucidated. We now show that recombinant CAPN14 cleaves a calpain-specific substrate and is inhibited by 4 classical calpain inhibitors: MDL-28170, acetyl-calpastatin, E-64, and PD151746. CAPN14 is specifically induced (>100-fold) in esophageal epithelium after IL-13 treatment. Epithelial cells overexpressing CAPN14 display impaired epithelial architecture, characterized by acantholysis, epidermal clefting, and epidermolysis. CAPN14 overexpression impairs epithelial barrier function, as demonstrated by decreased transepithelial resistance (2.1-fold) and increased FITC-dextran flux (2.6-fold). Epithelium with gene-silenced CAPN14 demonstrates increased dilated intercellular spaces (5.5-fold) and less organized basal cell layering (1.5-fold) following IL-13 treatment. Finally, CAPN14 overexpression results in loss of desmoglein 1 (DSG1) expression, whereas the IL-13-induced loss of DSG1 is normalized by CAPN14 gene silencing. Importantly, these findings were specific to CAPN14, as they were not observed with modulation of CAPN1 expression. These results, along with the potent induction of CAPN14 by IL-13 and genetic linkage of EoE to the CAPN14 gene locus, demonstrate a molecular and cellular pathway that contributes to T helper type 2 responses in mucosal epithelium.


Figures

Figure 1
Figure 1. Recombinant calpain 14 has protease activity.
Data from calpain activity assays comparing enzymatic activity of recombinant calpain 1 (rCAPN1), recombinant calpain 14 (rCAPN14), and rCAPN14 protease core are shown. (A) Calpain activity of rCAPN14 and rCAPN14 protease core as a function of protein amount (0.25–250 nM). (B) Calpain activity of rCAPN1 and rCAPN14 in the presence and absence of known reversible calpain inhibitors (n = 3). (C) Calpain activity of rCAPN1 and rCAPN14 in the presence and absence of known irreversible calpain inhibitor E-64. Data are representative of 3 independent experiments. Data are expressed as the mean ± SEM; ****P < 0.0001; statistical significance determined using a 2-tailed t test. (D) Reaction progress curves for cleavage of Suc-LLVY-AMC by rCAPN1 and rCAPN14 in the absence of inhibitors.
Figure 2
Figure 2. IL-13 induces calpain 14 in esophageal epithelial cells.
(A) Expression of calpain 14 (CAPN14) mRNA relative to GAPDH mRNA by quantitative PCR reaction in EPC2 cells exposed to IL-13 (100 ng/ml) for the indicated times. Eotaxin-3 is a positive control for IL-13 stimulation. (B) Western blot analysis of CAPN14 protein in air-liquid interface–cultured (ALI–cultured) EPC2 cells with or without (control) IL-13 for 96 hours; data are representative of 3 independent experiments, and HSP-90 is a loading control. (C) mRNA levels of calpain family members in ALI-cultured EPC2 cells with and without IL-13 treatment; data are derived from RNA-sequencing analysis, expressed as fragments per kilobase of exon per million, and representative of 3 independent experiments. For A and C, data are expressed as the mean or mean ± SEM; ***P < 0.001; statistical significance determined using a 2-tailed t test. CAST, calpastatin; CAPNS1, calpain small subunit 1.
Figure 3
Figure 3. Expression of calpain 14 in esophageal biopsies.
(A) A representative Western blot analysis of esophageal biopsies obtained from control and active patients with EoE. Each lane represents a separate patient. (B) Calpain 14 (CAPN14) band intensity was quantified in control (n = 10) and active EoE biopsies (n = 8) relative to HSP-90. *P < 0.05; statistical significance determined using Mann-Whitney test. (C) Immunofluorescence of esophageal biopsies from control individuals. Nuclei are indicated by DAPI (DNA) staining (blue). Green indicates staining with anti-CAPN14 antibody (second column) or rabbit IgG (fourth column). The bottom row contains high-powered views of the area enclosed in yellow square above. The dashed white line indicates basement membrane. Scale bar: 100 μm (top row); 10 μm (bottom row).
Figure 4
Figure 4. Characterization of calpain 14 overexpression.
(A) Calpain 14 (CAPN14) (green) immunofluorescence in EPC2 cells transduced with either empty vector (EV) or CAPN14 overexpression vector (CAPN14). (B) Data shown are from calpain activity assays of lysates from EPC2 cells transduced and selected for EV and CAPN14 overexpression lentivirus uptake (n = 3). (C) A model of the overexpression system is shown. Cells were transduced with either EV or CAPN14 overexpression vector by lentiviral transduction. Differentiated EPC2 esophageal epithelial cells were grown for 11 days in high-calcium media starting at day 2. Cells were brought to the air-liquid interface (ALI) starting at day 7 in the presence or absence of IL-13 treatment (100 ng/ml). Images of H&E-stained cells correspond to the time points above. Original magnification, ×20. (D) Expression of CAPN14 mRNA relative to GAPDH mRNA by quantitative PCR in ALI-cultured EPC2 cells. IL-13 stimulation is a positive control (n = 3). (E) Western blot analysis of CAPN14 protein overexpression in ALI-cultured EPC2 cells. (F) Immunofluorescence of CAPN14 (green) overexpression in ALI-cultured EPC2 cells. DAPI is shown in blue. Original magnification, ×20 (top and middle); ×100 (bottom). Scale bar: 10 μm. Data are representative of 3 independent experiments. For B and D, data are expressed as the mean ± SEM; ***P < 0.001, ****P < 0.0001; statistical significance determined using a 2-tailed t test.
Figure 5
Figure 5. Calpain 14 overexpression alters barrier function.
(A) Cultures of EPC2 cells transduced with empty vector (EV) or calpain 14 overexpression vector (CAPN14) and grown at air-liquid interface (ALI) for 6 days were analyzed by H&E stain. These ALI-cultured cells were analyzed by (B) transepithelial resistance (Rt, n = 3) and (C) FITC-dextran flux assay (n = 3). Data are representative of 3 independent experiments. Scale bar: 10 μm. For B and C, data are expressed as the mean ± SEM; ***P < 0.001; statistical significance determined using a 2-tailed t test.
Figure 6
Figure 6. Effect of calpain 14 gene silencing on epithelial cell responses to IL-13.
EPC2 cells transduced with either a nonsilencing control (NSC) or calpain 14 (CAPN14) gene silencing (KD-1 and KD-2) vector were grown at the air-liquid interface (ALI) with and without IL-13 and analyzed by (A) quantitative PCR of CAPN14 mRNA relative to GAPDH mRNA and normalized to NSC without IL-13 (n = 3). (B) Western blot analysis of CAPN14 protein in ALI culture (n = 3) with HSP-90 as a loading control. (C) H&E staining of ALI-cultured EPC2 cells. (D) Quantification of the percentage of total area of dilated intercellular spaces. (E) Quantification of nuclei of basal cells in contact with basolateral edge of ALI epithelium. (F) Transepithelial resistance (Rt, n = 3) and (G) FITC-dextran flux (n = 3) of ALI system. Data are representative of 3 independent experiments. Scale bar: 10 μm. For A and DG, data are represented as the mean ± SEM; *P < 0.05, **P < 0.01, ***P < 0.001, ****P < 0.0001; statistical significance determined using a 2-tailed t test.
Figure 7
Figure 7. Effect of calpain 14 overexpression on desmoglein 1 expression.
EPC2 cells transduced with empty vector (EV), calpain 14 overexpression vector (CAPN14), nonsilencing control (NSC), or CAPN14 gene-silencing (KD-1 and KD-2) vectors were grown at the air-liquid interface (ALI) and analyzed by (A) Western blot analysis for desmoglein 1 (DSG1). Quantitation of the 50-kDa DSG1 band intensity normalized to the full-length DSG1 band intensity is shown. (B) Immunofluorescence of DSG1 (green) in ALI culture; DAPI is shown in blue. (C) Western blot analysis of the CAPN14 gene-silencing effect on IL-13–mediated appearance of a DSG1 immunoreactive molecular species (50-kDa band) and quantitation of the 50-kDa DSG1 band intensity normalized to full-length DSG1 band intensity. (D) Immunofluorescence of DSG1 (green) in ALI-cultured EPC2 cells with and without IL-13 stimulation and CAPN14 gene silencing; DAPI is shown in blue. (E) ALI immunofluorescence intensity relationship of CAPN14 (green) and DSG1 (purple) and (F) colocalization of CAPN14 (green) and DSG1 (purple); DAPI is shown in blue. Data are representative of 3 independent experiments performed with replicates (n = 3–6). For A and C, data are expressed as the mean ± SEM; ***P < 0.001; statistical significance determined using a 2-tailed t test. Original magnification, ×20. Scale bar: 10 μm.
Figure 8
Figure 8. Model of calpain 14 function.
IL-13 stimulates calpain 14 (CAPN14) expression and desmoglein 1 (DSG1) downregulation. In addition, CAPN14 leads to the loss of DSG1 expression, which, together with IL-13–mediated effects, causes an impaired barrier function. In addition, CAPN14 has a regulatory role on the epithelial structure, as CAPN14 gene silencing induces disorder of the IL-13–mediated changes. We propose that CAPN14 acts as a regulator of IL-13–induced epithelial restructuring. The activity of CAPN14 is likely finely tuned to effect proper restructuring. If CAPN14 is overactive, there is a gross disruption of epithelial integrity. If CAPN14 is underactive, the restructuring process is likely constrained, leading to a disordered epithelial response to IL-13.

References

    1. Kottyan LC, et al. Genome-wide association analysis of eosinophilic esophagitis provides insight into the tissue specificity of this allergic disease. Nat Genet. 2014;46(8):895–900. doi: 10.1038/ng.3033. - DOI - PMC - PubMed
    1. Sleiman PM, et al. GWAS identifies four novel eosinophilic esophagitis loci. Nat Commun. 2014;5:e86355. - PMC - PubMed
    1. Goll DE, Thompson VF, Li H, Wei W, Cong J. The calpain system. Physiol Rev. 2003;83(3):731–801. doi: 10.1152/physrev.00029.2002. - DOI - PubMed
    1. Ono Y, Sorimachi H. Calpains: an elaborate proteolytic system. Biochim Biophys Acta. 2012;1824(1):224–236. - PubMed
    1. Sorimachi H, Hata H, Ono O. Calpain chronicle — an enzyme family under multidisciplinary characterization. Proc Jpn Acad Ser B Phys Biol Sci. 2011;87(6):287–327. doi: 10.2183/pjab.87.287. - DOI - PMC - PubMed