. 2016 Jun;48(6):607-16.
doi: 10.1038/ng.3564. Epub 2016 May 9.

Distinct patterns of somatic genome alterations in lung adenocarcinomas and squamous cell carcinomas

Collaborators, Affiliations

Distinct patterns of somatic genome alterations in lung adenocarcinomas and squamous cell carcinomas

Joshua D Campbell et al. Nat Genet. 2016 Jun.

Abstract

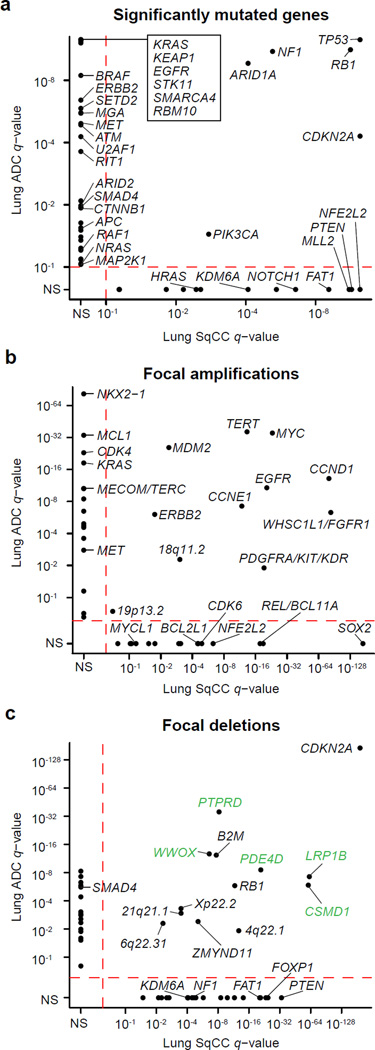
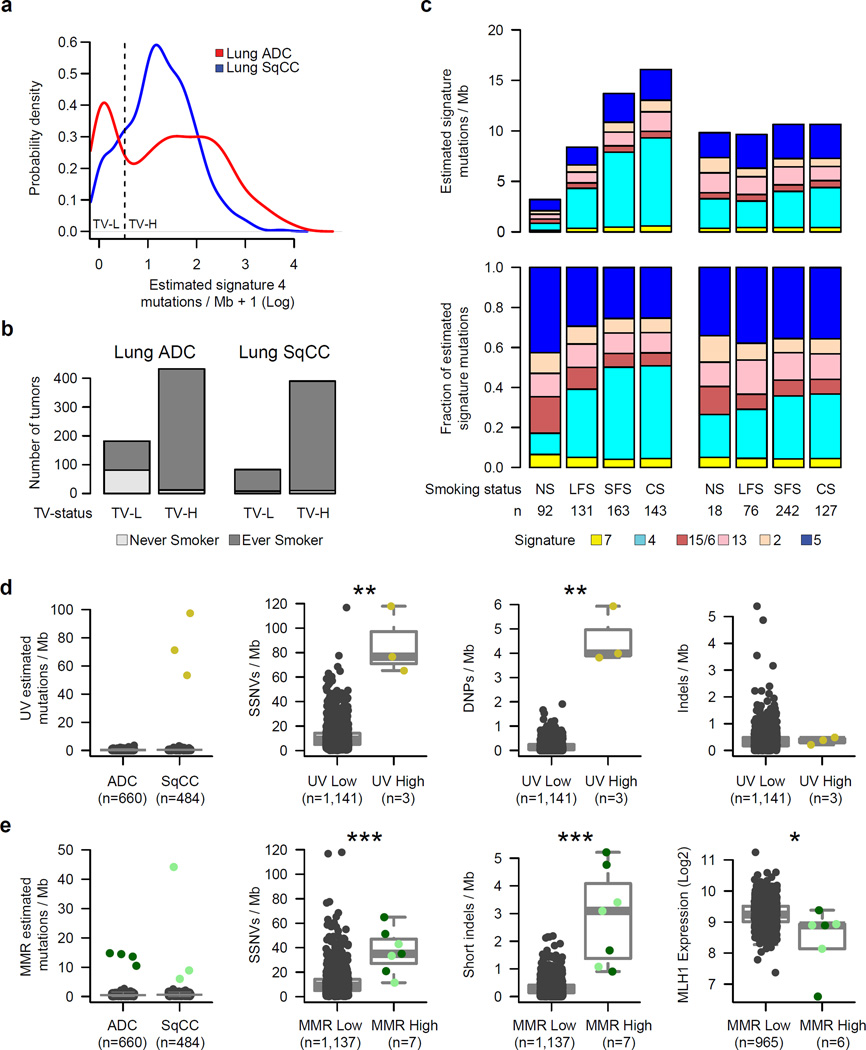
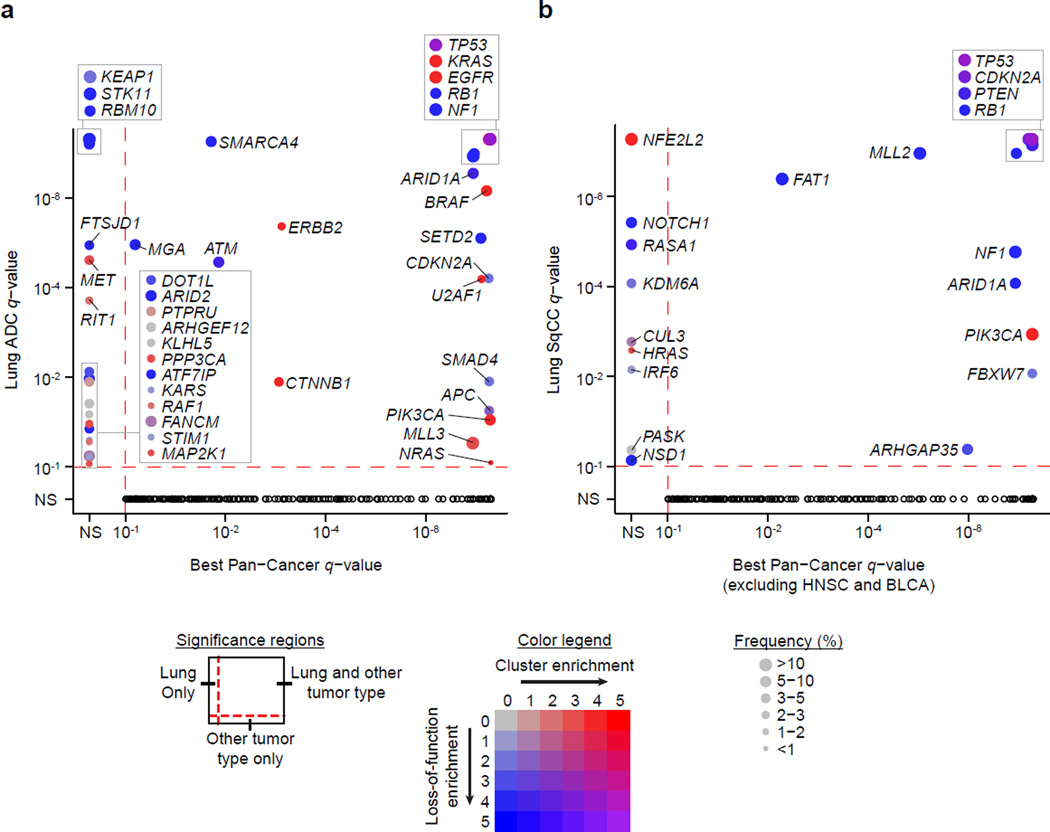
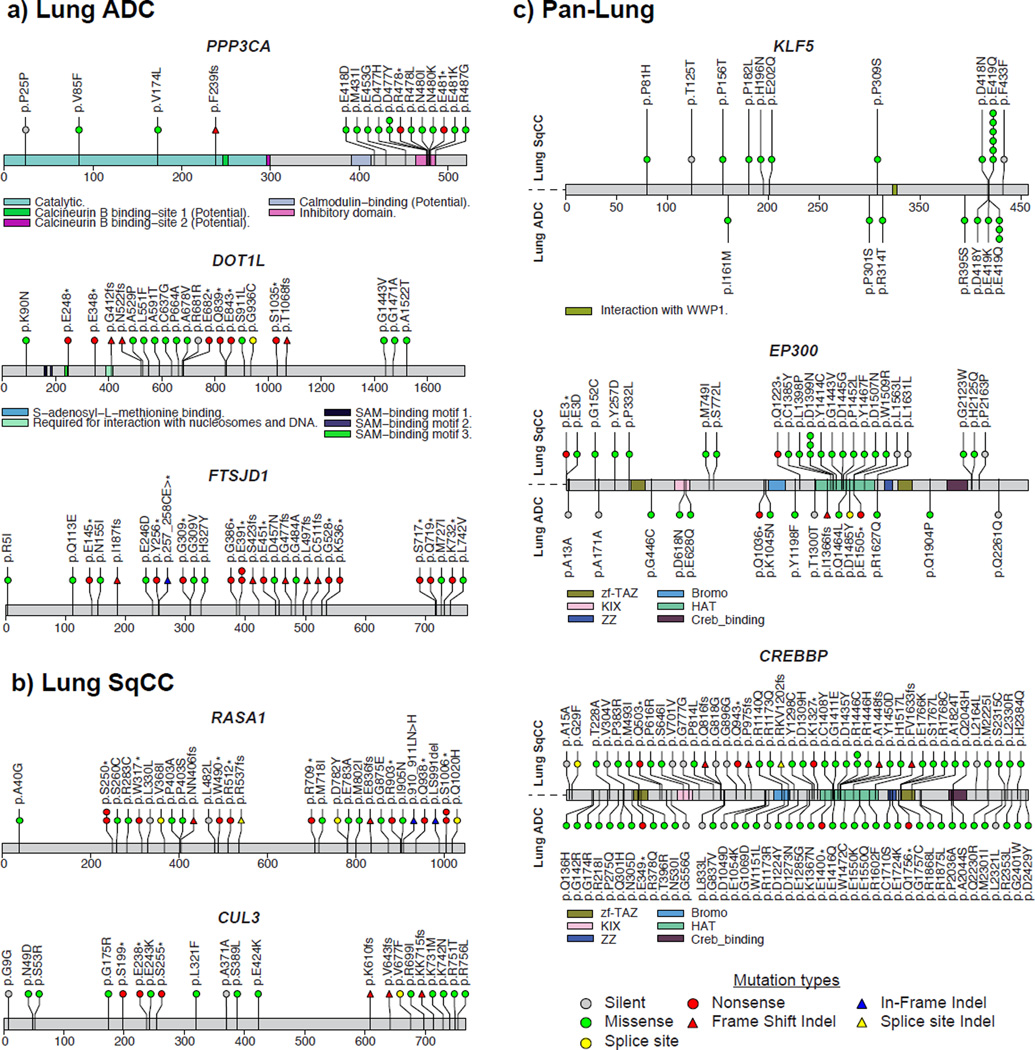
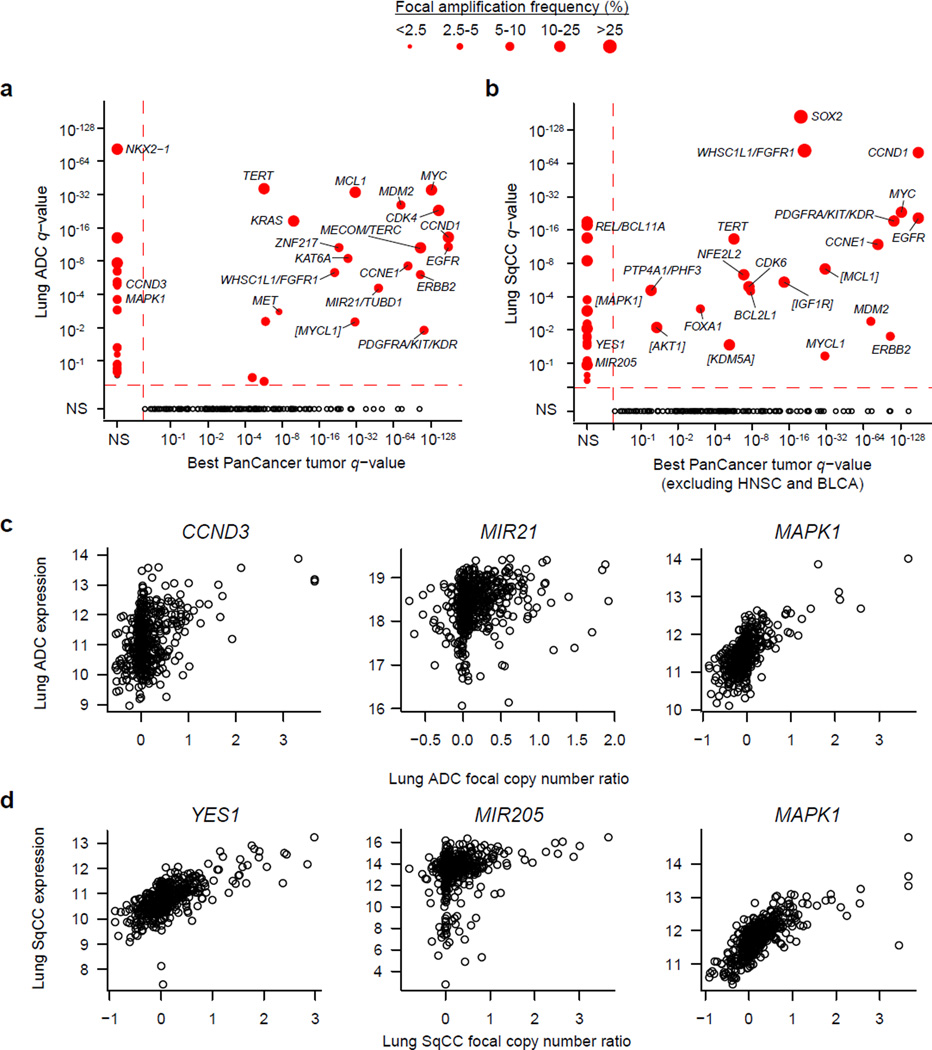
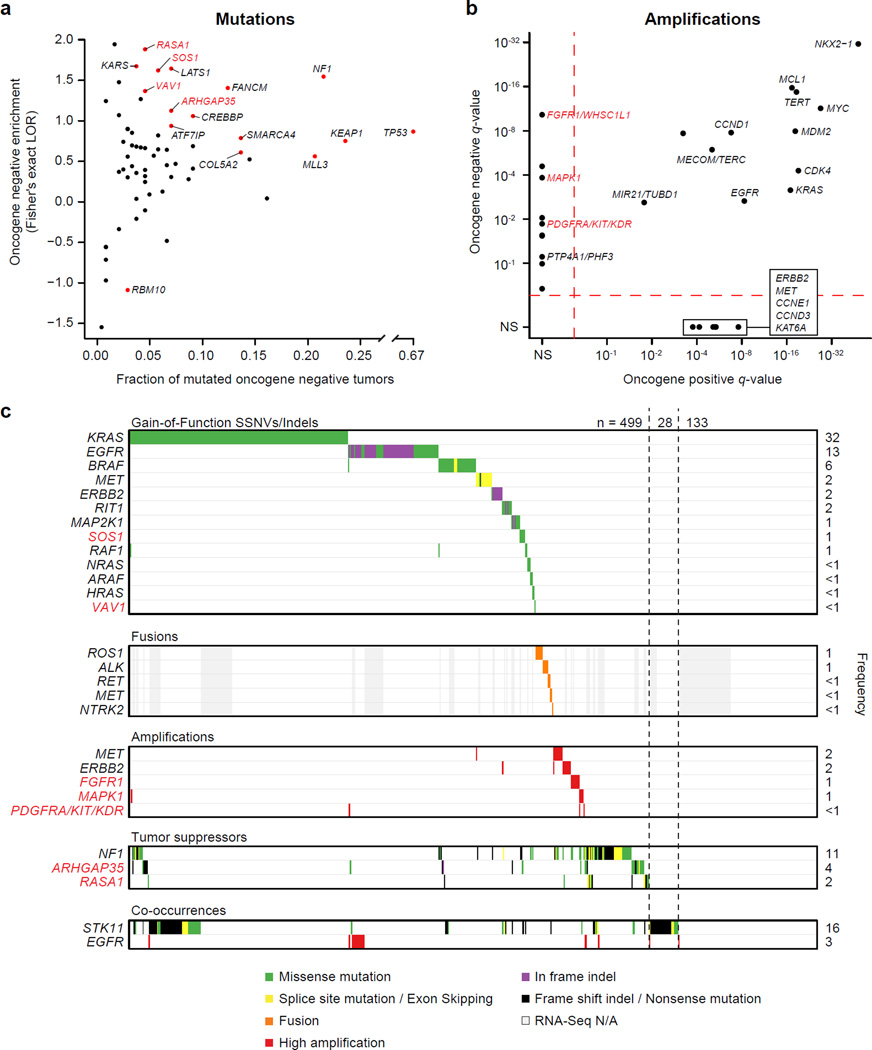
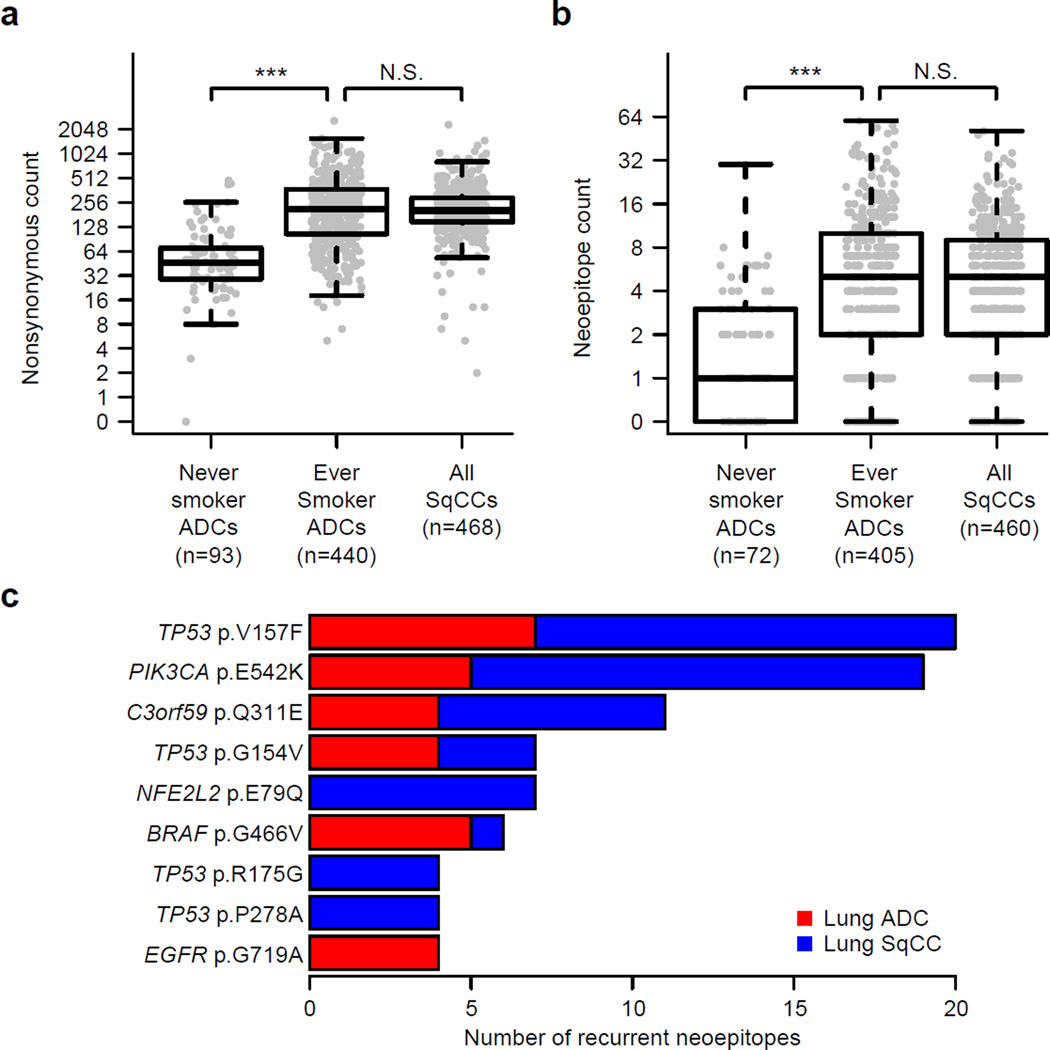
To compare lung adenocarcinoma (ADC) and lung squamous cell carcinoma (SqCC) and to identify new drivers of lung carcinogenesis, we examined the exome sequences and copy number profiles of 660 lung ADC and 484 lung SqCC tumor-normal pairs. Recurrent alterations in lung SqCCs were more similar to those of other squamous carcinomas than to alterations in lung ADCs. New significantly mutated genes included PPP3CA, DOT1L, and FTSJD1 in lung ADC, RASA1 in lung SqCC, and KLF5, EP300, and CREBBP in both tumor types. New amplification peaks encompassed MIR21 in lung ADC, MIR205 in lung SqCC, and MAPK1 in both. Lung ADCs lacking receptor tyrosine kinase-Ras-Raf pathway alterations had mutations in SOS1, VAV1, RASA1, and ARHGAP35. Regarding neoantigens, 47% of the lung ADC and 53% of the lung SqCC tumors had at least five predicted neoepitopes. Although targeted therapies for lung ADC and SqCC are largely distinct, immunotherapies may aid in treatment for both subtypes.


Figures

Figure 1
Figure 1. Distinct somatic alterations in lung ADC and SqCC
(a) The MutSig2CV algorithm was used to identify significantly mutated genes across 660 lung ADCs and 484 lung SqCCs. Genes with q-values < 0.1 were considered significant. The q-value for each gene in the lung ADC cohort is plotted against its respective q-value in the lung SqCC cohort. The majority of significantly mutated genes were unique to either tumor type. The GISTIC2.0 algorithm was used to identify significantly recurrent copy number gains and losses. The q-values for (b) amplifications and (c) deletions in the lung ADC cohort are plotted against the q-values in the lung SqCC cohort. Peaks with q-values < 0.25 were considered significant. Deletions located within putative fragile sites are indicated with green labels. Only points from previously characterized lung cancer genes are labeled. N.S. = Not Significant.
Figure 2
Figure 2. Comparison of mutational signatures in lung cancer
Six mutational signatures were identified using non-negative matrix factorization (NMF) on 192 distinct mutation types. (a) The estimated number of SI4 (smoking-related) mutations per Mb within each tumor displayed a bimodal pattern in lung ADC (red). (b) Lung ADCs categorized as transversion-low (TV-L) were enriched in clinically-annotated life-long never smokers (p = 8.5 × 10−37). (c) The estimated number of mutations for each signature per Mb (top) or the fraction of estimated mutations for each signature (bottom) was averaged across life-long never smokers (NS), longer-term former smokers (LFS), shorter-term former smokers (SFS), and current smokers (CS) for both lung ADCs and lung SqCCs (excluding UV-High and MMR-High tumors discussed below). (d) Three lung SqCCs had a high number of estimated mutations from a UV-associated signature commonly observed in melanoma. These tumors displayed a significantly higher overall rate of SSNVs and DNPs compared to all other lung tumors (p < 0.01). (e) Mutational profiles for another 7 tumors exhibited an MMR-like signature commonly observed in MSI colorectal carcinomas. These tumors had significantly higher rates of both SSNVs and short indels (p < 0.001), as well as lower levels of MHL1 expression (p = 0.011). Asterisks indicate significance level from a Wilcoxon rank-sum test (*p < 0.05, **p < 0.01, ***p < 0.001). Boxplots show median (middle bar), 1st quartile (bottom of box), 3rd quartile (top of box). Boxplot whiskers demark 1.5 times the interquartile range or minimum/maximum value.
Figure 3
Figure 3. Significantly mutated genes in lung cancer compared to other cancer types
(a) The q-value for each significantly mutated gene in the lung ADC cohort is plotted against the best q-value for the same gene from 19 other tumor types from a Pan-Cancer study. (b) The q-values from the lung SqCC cohort were similarly compared to the other tumor types excluding head and neck squamous cell (HNSC) and bladder urothelial carcinomas (BLCA). Size of the point is proportional to the frequency of mutations in the gene. The color of the point indicates enrichment for mutation clustering defined by MutSig2CV (−log10 pCL) and/or enrichment for loss-of-function mutations (−log10 p-value from a Fisher’s exact test, Online Methods). Black circles in the lower quadrant indicate genes significant in another cancer type but not in lung ADC and/or lung SqCC.
Figure 4
Figure 4. Novel significantly mutated genes in lung cancer
Mutation profiles of novel genes specific to each lung tumor type include (a) PPP3CA, DOT1L, and FTSJD1 in lung ADC and (b) RASA1 and CUL3 in lung SqCC. (c) Combined analysis of both tumor types (Pan-Lung) revealed additional significantly mutated genes with hotspots including KLF5 and two paralogs, EP300 and CREBBP.
Figure 5
Figure 5. Significant amplifications in lung cancer
(a) The q-value for amplifications in lung ADC are plotted against the best q-value for the same gene across 9 other non-lung tumor types. (b) The q-values for amplifications in lung SqCC are compared against 7 other tumor types excluding HNSC and BLCA. Size of the point is proportional to the frequency of focal alterations. Brackets around gene names indicate that the most likely target gene was inferred from Pan-Cancer copy number analysis across 11 tumor types or from the combined Pan-Lung copy number analysis. Black circles in the lower quadrant indicate genes significantly altered in another cancer type but not in lung ADC and/or lung SqCC. Gene expression is plotted against focal copy number ratios for novel amplification peaks that include (c) CCND3, MIR21, and MAPK1 in lung ADC and (d) YES1, MIR205, and MAPK1 in lung SqCC.
Figure 6
Figure 6. Fusions in MET and NTRK2
Two fusions in MET were identified which retained the receptor tyrosine kinase domain including one with its neighboring gene, CAPZA2. This fusion mostly likely arose via tandem duplication resulting in the 3’ end of MET being fused with the 5’ end of CAPZA2. Previously reported TRIM24, NTRK2 and KIF5B-MET fusions were observed in lung ADCs without other known Ras/Raf/RTK activating alterations. Another NTRK2 fusion with TP63 was also found in a lung SqCC. The expression of exons retained in the putative fusion transcript was relatively higher than the expression of exons not in the putative fusion transcript (as indicated by the grey box).
Figure 7
Figure 7. Novel alterations in the Ras/Raf/Rho/RTK pathway in lung ADC
Lung ADCs were classified as “oncogene positive” if they contained a known activating or recurrent alteration in previously characterized pathway members and classified as “oncogene negative” otherwise. (a) Mutations from 15 genes (red points) were significantly enriched among oncogene negative tumors (Fisher’s exact test; FDR q-value < 0.1; Supplementary Table 23). A log odds ratio (LOR) greater than zero indicates that the frequency of mutations was higher in the oncogene negative set. (B) Significant amplification peaks near FGFR1/WHSC1L1, PDGFRA/KIT/KDR, and MAPK1 were only found in the oncogene negative tumor set using GISTIC2.0 (q-value < 0.25). (c) Co-mutation plot for known and novel activators of this pathway. Tumors were considered to have high amplification for a given gene if they had a total log2 copy number ratio greater than 1. For genes with gain-of-function SSNVs or indels, only recurrently mutated sites or sites with previous experimental functional evidence are included. Novel oncogene negative enriched genes that are members of the Ras/Raf/Rho/RTK pathway are indicated with red labels in all panels.
Figure 8
Figure 8. Neoepitope load in lung cancer
The immunogenicity of each missense mutation was predicted after inferring HLA alleles within each tumor with available RNA-seq data (n=971). (a) Nonsynonymous mutation counts and (b) neoepitope counts were not significantly different between ever smokers from lung ADCs and lung SqCCs (p > 0.05). However, these counts were significantly lower in lung ADCs from never smokers compared to lung ADCs from ever smokers (p < 0.001). (c) Some of the most common mutations predicted to be neoepitopes included TP53 p.V157F, PIK3CA p.E542K and C3orf59 p.Q311E.

Comment in

  • Next-generation molecular therapy in lung cancer.
    Qian J, Massion PP. Qian J, et al. Transl Lung Cancer Res. 2018 Feb;7(Suppl 1):S31-S34. doi: 10.21037/tlcr.2018.01.03. Transl Lung Cancer Res. 2018. PMID: 29531901 Free PMC article. No abstract available.

References

    1. Stewart BW, Wild CP, editors. World Cancer Report 2014. International Agency for Research on Cancer; 2014. - PubMed
    1. Siegel RL, Miller KD, Jemal A. Cancer statistics, 2015. CA Cancer J Clin. 2015;65:5–29. - PubMed
    1. Samet JM, et al. Lung cancer in never smokers: clinical epidemiology and environmental risk factors. Clin Cancer Res. 2009;15:5626–5645. - PMC - PubMed
    1. Cardarella S, Johnson BE. The impact of genomic changes on treatment of lung cancer. Am J Respir Crit Care Med. 2013;188:770–775. - PMC - PubMed
    1. Vaishnavi A, et al. Oncogenic and drug-sensitive NTRK1 rearrangements in lung cancer. Nat Med. 2013;19:1469–1472. - PMC - PubMed

Methods-only references

    1. DePristo MA, et al. A framework for variation discovery and genotyping using next-generation DNA sequencing data. Nat Genet. 2011;43:491–498. - PMC - PubMed
    1. Cibulskis K, et al. ContEst: estimating cross-contamination of human samples in next-generation sequencing data. Bioinformatics. 2011;27:2601–2602. - PMC - PubMed
    1. Carter SL, et al. Absolute quantification of somatic DNA alterations in human cancer. Nat Biotechnol. 2012;30:413–421. - PMC - PubMed
    1. Cibulskis K, et al. Sensitive detection of somatic point mutations in impure and heterogeneous cancer samples. Nat Biotechnol. 2013;31:213–219. - PMC - PubMed
    1. Olshen AB, Venkatraman ES, Lucito R, Wigler M. Circular binary segmentation for the analysis of array-based DNA copy number data. Biostatistics. 2004;5:557–572. - PubMed

Publication types

Substances