Clinical Trial
. 2016 Jun;22(6):614-23.
doi: 10.1038/nm.4110. Epub 2016 May 9.

Protection against malaria at 1 year and immune correlates following PfSPZ vaccination

Affiliations
Clinical Trial

Protection against malaria at 1 year and immune correlates following PfSPZ vaccination

Andrew S Ishizuka et al. Nat Med. 2016 Jun.

Erratum in

  • Corrigendum: Protection against malaria at 1 year and immune correlates following PfSPZ vaccination.
    Ishizuka AS, Lyke KE, DeZure A, Berry AA, Richie TL, Mendoza FH, Enama ME, Gordon IJ, Chang LJ, Sarwar UN, Zephir KL, Holman LA, James ER, Billingsley PF, Gunasekera A, Chakravarty S, Manoj A, Li M, Ruben AJ, Li T, Eappen AG, Stafford RE, K C N, Murshedkar T, DeCederfelt H, Plummer SH, Hendel CS, Novik L, Costner PJ, Saunders JG, Laurens MB, Plowe CV, Flynn B, Whalen WR, Todd JP, Noor J, Rao S, Sierra-Davidson K, Lynn GM, Epstein JE, Kemp MA, Fahle GA, Mikolajczak SA, Fishbaugher M, Sack BK, Kappe SH, Davidson SA, Garver LS, Björkström NK, Nason MC, Graham BS, Roederer M, Sim BK, Hoffman SL, Ledgerwood JE, Seder RA; VRC 312 and VRC 314 Study Teams. Ishizuka AS, et al. Nat Med. 2016 Jun 7;22(6):692. doi: 10.1038/nm0616-692c. Nat Med. 2016. PMID: 27270781 No abstract available.

Abstract

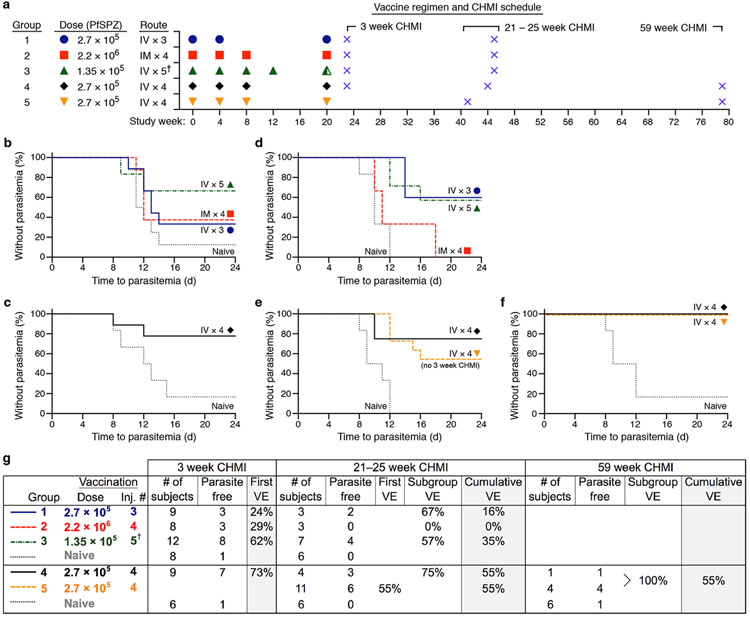
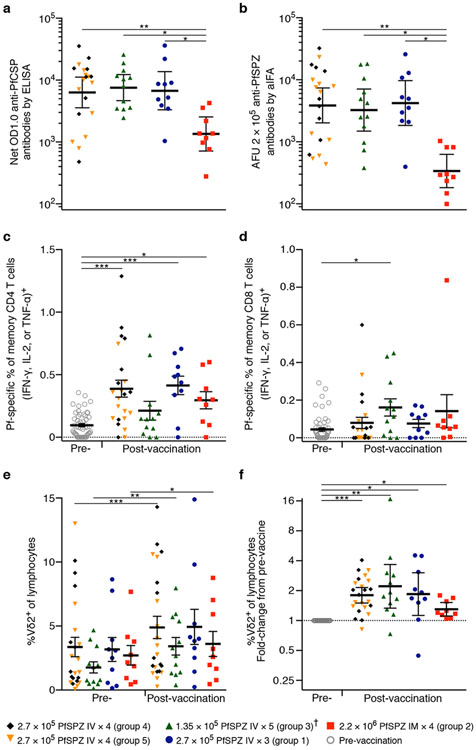
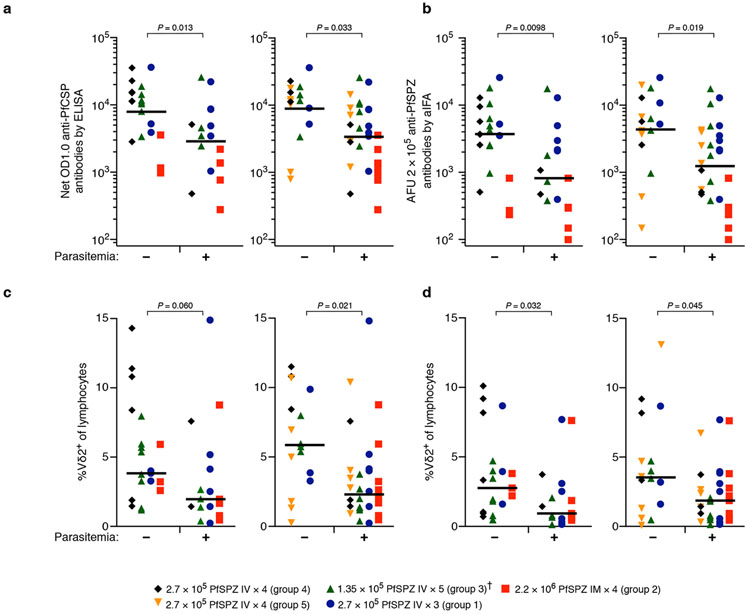
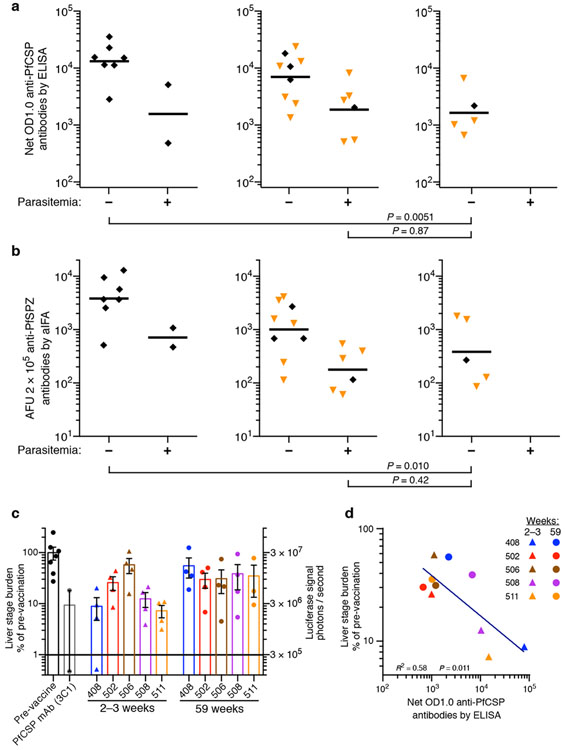
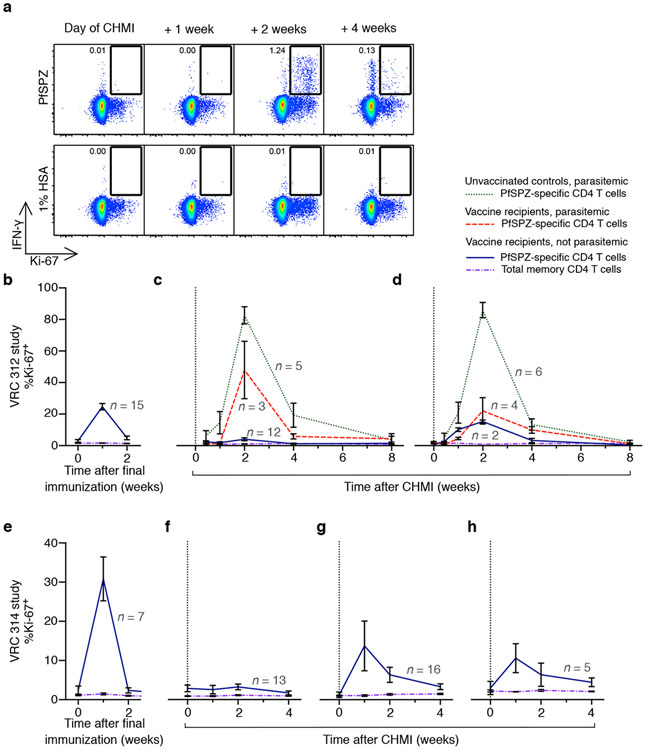
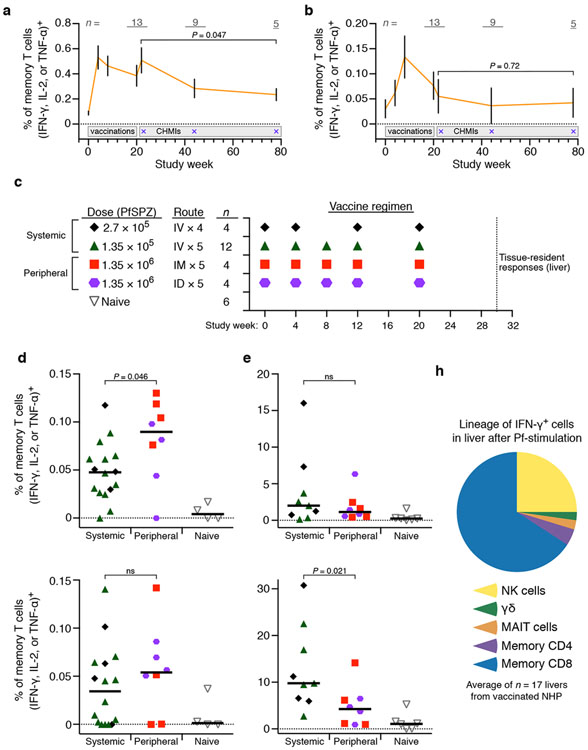
An attenuated Plasmodium falciparum (Pf) sporozoite (SPZ) vaccine, PfSPZ Vaccine, is highly protective against controlled human malaria infection (CHMI) 3 weeks after immunization, but the durability of protection is unknown. We assessed how vaccine dosage, regimen, and route of administration affected durable protection in malaria-naive adults. After four intravenous immunizations with 2.7 × 10(5) PfSPZ, 6/11 (55%) vaccinated subjects remained without parasitemia following CHMI 21 weeks after immunization. Five non-parasitemic subjects from this dosage group underwent repeat CHMI at 59 weeks, and none developed parasitemia. Although Pf-specific serum antibody levels correlated with protection up to 21-25 weeks after immunization, antibody levels waned substantially by 59 weeks. Pf-specific T cell responses also declined in blood by 59 weeks. To determine whether T cell responses in blood reflected responses in liver, we vaccinated nonhuman primates with PfSPZ Vaccine. Pf-specific interferon-γ-producing CD8 T cells were present at ∼100-fold higher frequencies in liver than in blood. Our findings suggest that PfSPZ Vaccine conferred durable protection to malaria through long-lived tissue-resident T cells and that administration of higher doses may further enhance protection.


Figures

Figure 1
Figure 1. Sterile protection following CHMI at 59 weeks after immunization with PfSPZ Vaccine.
(a) Timing of immunizations and CHMIs. Vaccinated subjects underwent CHMI 3, 21–25, and/or 59 weeks after final immunization. Half-filled green triangle denotes 4.5 × 10⁵ PfSPZ IV. †Group 3 received four doses of 1.35 × 10⁵ PfSPZ and a fifth dose of 4.5 × 10⁵ PfSPZ. (b–f) Kaplan-Meier curves showing the percent of volunteers who did not develop parasitemia after each of 5 separate CHMIs at 3 weeks (b,c), 21-25 weeks (d,e), or 59 weeks (f) after final immunization. New unvaccinated control subjects were enrolled for each CHMI. Day 0 indicates the time of exposure to infected mosquitoes. Monitoring for parasitemia was by once daily PCR. (g) Vaccine efficacy for each group after each CHMI. VE = 1 – relative risk, where relative risk is the infection rate in the vaccine group divided by the infection rate in the naive control group. First VE = VE at first CHMI; subgroup VE = VE among the subgroup of subjects that were not parasitemic at first CHMI; cumulative VE = first VE multiplied by subgroup VE. Subjects in group 5 underwent CHMI for the first time 21 weeks after final immunization and first VE was 55% (95% c.i. 0.13-0.76); P = 0.037, one-sided Fisher’s exact test. Five subjects from groups 4 and 5 underwent repeat CHMI 59 weeks after last immunization, and all were without parasitemia (P = 0.013).
Figure 2
Figure 2. Pf-specific antibody and cellular immune responses two weeks after final immunization.
(a) Antibodies to PfCSP were measured by ELISA. (b) Antibodies to PfSPZ were measured by automated immunofluorescence assay (aIFA). (c) Pf-specific memory CD4 T cells secreting IFN-γ, IL-2, and/or TNF-α were measured by intracellular cytokine staining (ICS). Results are the percent of cytokine-producing cells after incubation with PfSPZ minus percent of cytokine-producing cells after incubation with vaccine diluent (medium with 1% HSA). (d) Pf-specific memory CD8 T cells secreting IFN-γ, IL-2, and/or TNF-α by ICS after incubation with Pf-infected red blood cells (PfRBCs) or uninfected RBCs as control. Results calculated as in c. (e) Frequency of Vδ9+Vδ2+ (hereafter Vδ2+) γδ T cells among total lymphocytes. (f) Fold change from pre- to post-vaccination in the frequency of Vδ2+ T cells as a percentage of total lymphocytes. For a–b, between group differences were assessed by Kruskal-Wallis test with Dunn’s correction for multiple comparisons. For c–e, there were no differences between vaccine groups in the post-vaccination responses by Kruskal-Wallis test. Difference from pre-vaccine was assessed by Wilcoxon signed rank test (c–e) or one-sample t-test (f). For c–f, P-values were corrected by the Bonferroni method. * P < 0.05, ** P < 0.01, *** P < 0.001. Geometric mean ± 95% c.i. (a, b, f) or mean ± s.e.m. (c–e). Each dot represents one subject. †See Fig. 1 for doses.
Figure 3
Figure 3. Correlation between immune responses and CHMI outcome.
(a) Antibodies to PfCSP were measured by ELISA (net OD1.0) 2 weeks after final immunization in subjects who did (+) and did not (−) develop parasitemia at 3 (left) and 21–25 (right) week CHMIs. (b) Antibodies to PfSPZ were measured by aIFA (AFU 2 × 10⁵) 2 weeks after final immunization in subjects who did (+) and did not (−) develop parasitemia at 3 (left) and 21–25 (right) week CHMIs. (c) Frequency of Vδ2+ T cell subset among total lymphocytes 2 weeks after final immunization in subjects who did (+) and did not (−) develop parasitemia at 3 (left) and 21–25 (right) week CHMIs. (d) Frequency of Vδ2+ T cells among total lymphocytes prior to immunization in subjects who did (+) and did not (−) develop parasitemia at 3 (left) and 21–25 (right) week CHMIs. For a–d, since we expected subjects who were parasitemic at 3 weeks to again be parasitemic at 21–25 weeks, the immune data from individuals who were parasitemic at 3 weeks were included in the analysis for 21–25 week CHMI. Statistical significance for all correlations was determined by stratified Wilcoxon test with vaccine regimen as co-variate. Bar denotes geometric mean (a,b) or median (c,d). Each dot represents one subject. †See Fig. 1 for doses.
Figure 4
Figure 4. Functional role of PfSPZ-specific antibodies.
(a) Antibodies to PfCSP (net OD1.0) measured by ELISA at the time of CHMI in subjects who received 4 doses of 2.7 × 10⁵ PfSPZ IV and subsequently did (+) or did not (−) develop parasitemia at 3 (left), 21–24 (middle), or 59 (right) week CHMIs. (b) Antibodies to PfSPZ (AFU = 2 × 10⁵) measured by aIFA at the time of each CHMI in subjects who received 4 doses of 2.7 × 10⁵ PfSPZ IV and subsequently did (+) or did not (−) develop parasitemia at 3 (left), 21–24 (middle), or 59 (right) week CHMIs. (c) Effect of passive transfer of purified IgG on liver stage burden assessed by IVIS. The experiment was done once. Right Y-axis shows the raw luciferase signal. Left Y-axis shows percent signal in mice that received the IgG from each of the 5 subjects at each of the two time points as compared to the signal in the mice that received pre-vaccination IgG, which was set to be 100%. (d) Correlation between PfCSP antibody abundance (net OD1.0) and liver-stage burden measured by luciferase expression in the FRG-huHep mice. For a–b, comparison between groups was assessed by Mann-Whitney U test. Bar denotes geometric mean. Each dot represents one subject. For c, data are mean ± s.e.m.
Figure 5
Figure 5. Activation of PfSPZ-specific CD4 T cells following CHMI.
PBMCs were isolated before and after the final vaccination and each CHMI from vaccinated subjects and unvaccinated controls in the VRC 312 and VRC 314 studies. Cells were incubated with PfSPZ or vaccine diluent (1% HSA), and IFN-γ, IL-2, TNF-α, and Ki-67 expression were assessed by flow cytometry. (a) Gating example showing memory CD4 T cells at 0, 1, 2, and 4 weeks following CHMI in an unvaccinated control who developed parasitemia. PfSPZ-specific cells are identified by expression of IFN-γ following PfSPZ stimulation, and cells undergoing replication are identified by Ki-67. (b) Percentage of either total memory CD4 T cells (purple, dot-dash) expressing Ki-67 or PfSPZ-specific CD4 T cells (blue, solid) expressing Ki-67 after final immunization in vaccine recipients who received 1.35 × 10⁵ PfSPZ IV in the VRC 312 study. (c–d) Frequency of cells (see key) expressing Ki-67 in vaccine recipients who did or did not develop parasitemia following CHMI at 3 (c) and 21 (d) weeks after final vaccination. Unvaccinated controls are also shown. Subjects were from the VRC 312 study. (e) Same analysis as in b, for IV-vaccinated subjects in the VRC 314 study. (f–h) Same analysis as in c–d, except subjects are IV-vaccinated subjects from the VRC 314 study, and CHMIs occurred 3 (f), 21–25 (g), and 59 (h) weeks after final vaccination. For b–h, PfSPZ-specific cells are identified by any combination of IFN-γ, IL-2, or TNF-α. Data are mean ± s.e.m. Gray numbers on graph denote number of subjects in each group.
Figure 6
Figure 6. Circulating and liver-resident Pf-specific T cells in humans and NHPs.
(a–b) Longitudinal assessment of PfSPZ-specific CD4 T cell responses (a) and PfRBC-specific CD8 T cell responses (b) in subjects who received 4 doses of 2.7 × 10⁵ PfSPZ IV and did not develop parasitemia at the 3, 21–24 and 59 week CHMIs. Gray numbers on graph denote number of subjects included at each time point. Data are mean ± s.e.m. P-values are for comparisons between immune responses at 2 and 59 weeks after the final immunization by Mann-Whitney U test. (c) NHP study design. (d) PfSPZ-specific CD4 (top) and PfRBC-specific CD8 (bottom) T cell responses in PBMCs of NHPs 2 weeks after final vaccination. (e) PfSPZ-specific CD4 (top) and PfRBC-specific CD8 (bottom) T cell responses in livers of NHPs 10 weeks after final vaccination. (f) Lineage of liver-resident lymphocytes in vaccinated NHP expressing IFN-γ following stimulation with PfRBC. For d–e, bar denotes median, and between group comparisons were determined by Mann-Whitney U test. ns, non-significant (P > 0.05).

References

REFERENCES FOR MAIN TEXT

    1. World Malaria Report 2015. (World Health Organization, 2015).
    1. Richie TL, et al. Progress with Plasmodium falciparum sporozoite (PfSPZ)-based malaria vaccines. Vaccine 33, 7452–7461 (2015). - PMC - PubMed
    1. Kester KE, et al. Randomized, double-blind, phase 2a trial of falciparum malaria vaccines RTS,S/AS01B and RTS,S/AS02A in malaria-naive adults: safety, efficacy, and immunologic associates of protection. The Journal of infectious diseases 200, 337–346 (2009). - PubMed
    1. Rts SCTP Efficacy and safety of RTS,S/AS01 malaria vaccine with or without a booster dose in infants and children in Africa: final results of a phase 3, individually randomised, controlled trial. Lancet 386, 31–45 (2015). - PMC - PubMed
    1. Plowe CV, Alonso P & Hoffman SL The potential role of vaccines in the elimination of falciparum malaria and the eventual eradication of malaria. J Infect Dis 200, 1646–1649 (2009). - PubMed

METHODS-ONLY REFERENCES

    1. Gaziano TA, Young CR, Fitzmaurice G, Atwood S & Gaziano JM Laboratory-based versus non-laboratory-based method for assessment of cardiovascular disease risk: the NHANES I Follow-up Study cohort. Lancet 371, 923–931 (2008). - PMC - PubMed
    1. Lyke KE, et al. Plasmodium falciparum malaria challenge by the bite of aseptic Anopheles stephensi mosquitoes: results of a randomized infectivity trial. PLoS One 5, e13490 (2010). - PMC - PubMed
    1. Chulay JD, et al. Malaria transmitted to humans by mosquitoes infected from cultured Plasmodium falciparum. Am J Trop Med Hyg 35, 66–68 (1986). - PubMed
    1. Rickman LS, et al. Plasmodium falciparum-infected Anopheles stephensi inconsistently transmit malaria to humans. Am J Trop Med Hyg 43, 441–445 (1990). - PubMed
    1. Lamoreaux L, Roederer M & Koup R Intracellular cytokine optimization and standard operating procedure. Nat Protoc 1, 1507–1516 (2006). - PubMed

Publication types

MeSH terms