. 2016 Jul 15;11(7):2021-32.
doi: 10.1021/acschembio.6b00303. Epub 2016 May 20.

Cladribine and Fludarabine Nucleotides Induce Distinct Hexamers Defining a Common Mode of Reversible RNR Inhibition

Affiliations

Cladribine and Fludarabine Nucleotides Induce Distinct Hexamers Defining a Common Mode of Reversible RNR Inhibition

Somsinee Wisitpitthaya et al. ACS Chem Biol. .

Abstract

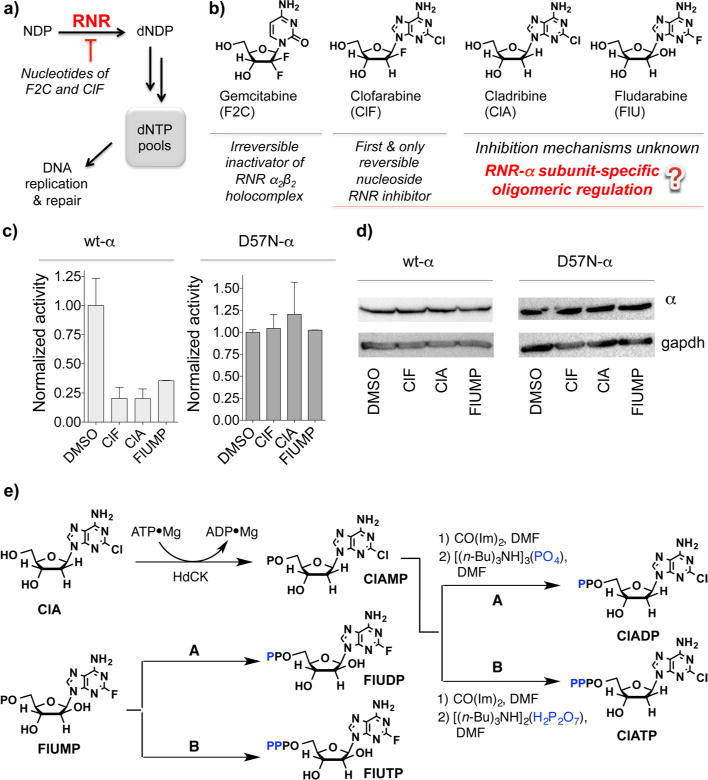
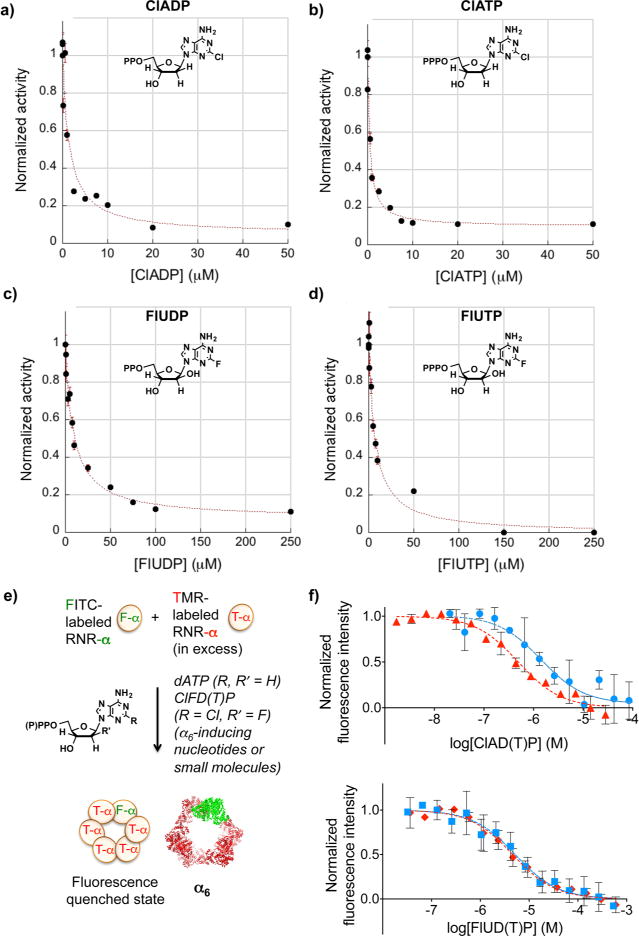
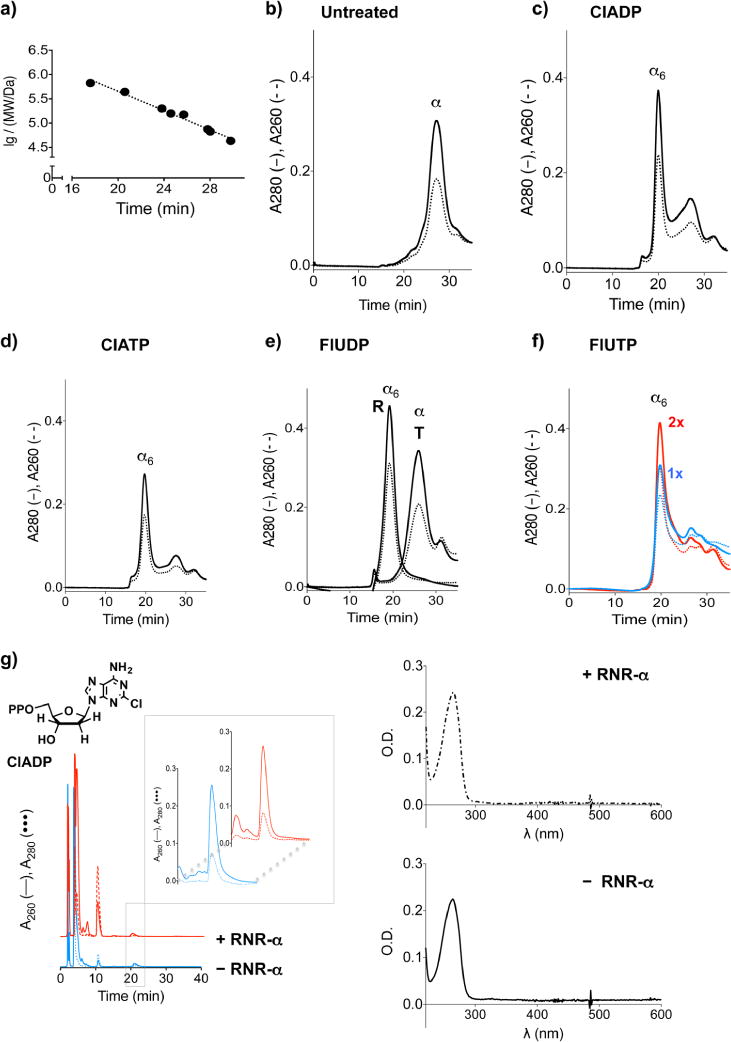
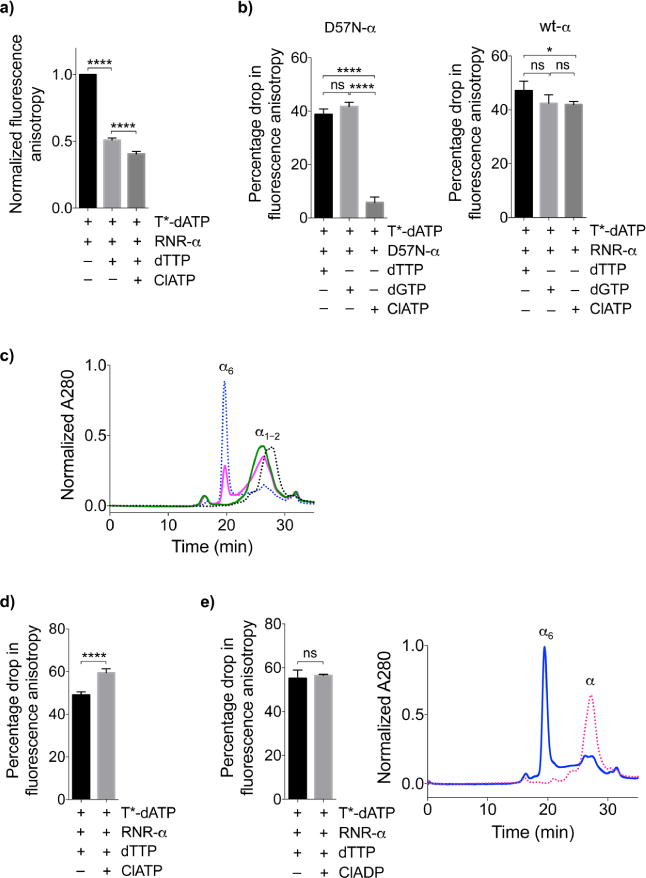
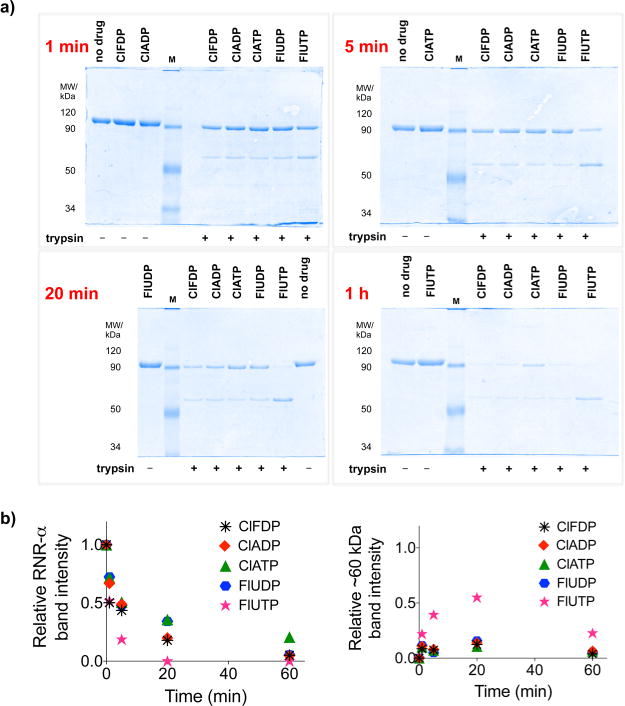
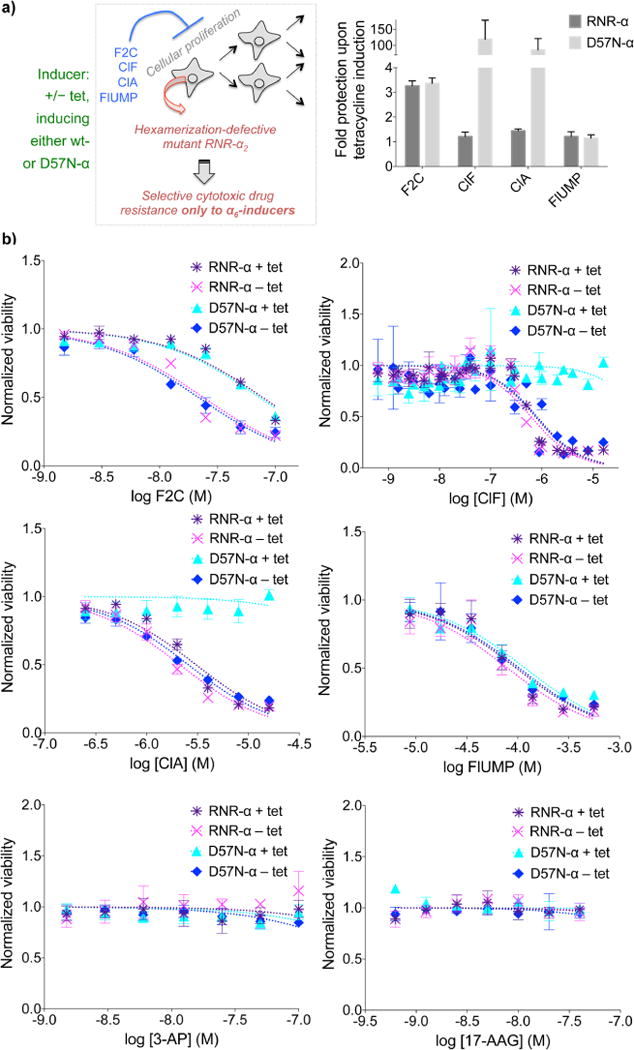
The enzyme ribonucleotide reductase (RNR) is a major target of anticancer drugs. Until recently, suicide inactivation in which synthetic substrate analogs (nucleoside diphosphates) irreversibly inactivate the RNR-α2β2 heterodimeric complex was the only clinically proven inhibition pathway. For instance, this mechanism is deployed by the multifactorial anticancer agent gemcitabine diphosphate. Recently reversible targeting of RNR-α-alone coupled with ligand-induced RNR-α-persistent hexamerization has emerged to be of clinical significance. To date, clofarabine nucleotides are the only known example of this mechanism. Herein, chemoenzymatic syntheses of the active forms of two other drugs, phosphorylated cladribine (ClA) and fludarabine (FlU), allow us to establish that reversible inhibition is common to numerous drugs in clinical use. Enzyme inhibition and fluorescence anisotropy assays show that the di- and triphosphates of the two nucleosides function as reversible (i.e., nonmechanism-based) inhibitors of RNR and interact with the catalytic (C site) and the allosteric activity (A site) sites of RNR-α, respectively. Gel filtration, protease digestion, and FRET assays demonstrate that inhibition is coupled with formation of conformationally diverse hexamers. Studies in 293T cells capable of selectively inducing either wild-type or oligomerization-defective mutant RNR-α overexpression delineate the central role of RNR-α oligomerization in drug activity, and highlight a potential resistance mechanism to these drugs. These data set the stage for new interventions targeting RNR oligomeric regulation.


Conflict of interest statement

Notes

The authors declare no competing financial interest.

Figures

Figure 1
Figure 1
(a) RNR catalyzes NDP reduction, central to DNA metabolism. Nucleoside anticancer agents F2C and ClF inhibit RNR via vastly different mechanisms. (b) RNR-inhibiting nucleosides for which mechanisms are known in vitro (F2C), as well as in cells (ClF) and unknown (ClA and FlU). (c) RNR-α subunit-specific CDP/ATP-reductase-activity (500 μg of total lysate, measured over four time points) post 3-h treatment of 3T3 cells stably expressing either wt- or mutant (D57N)-mouse(m)RNR-α by 5, 50, and 300 μM ClF, ClA, and FlUMP, respectively. Error bars, SD (n = 3). (d) mRNR-α protein levels in samples from c. GAPDH, loading control. Also see Figure S2. (e) Chemoenzymetic syntheses of mono-, di-, and triphosphates of ClA and FlU. See SI for characterizations.
Figure 2
Figure 2
(a–d) Dose-dependent inhibition of RNR-α-specific CDP/ATP-reductase-activity (assay period, 3 min). Fitting these data to tight-binding equation gives Ki’s as 1.4 ± 0.7, 0.5 ± 0.1, 9.4 ± 1.7, and 6.8 ± 1.3 μM for (a) ClADP, (b) ClATP, (c) FlUDP, and (d) FlUTP, respectively. Error bars designate SD., n = 3. (e,f) FRET-quenching assay reporting the ligand-driven RNR-α oligomerization. The ribbon structure represents the known 9.0 Å dATP-bound human α6 crystal structure (5D1Y). (f) ClADP (●), ClATP (▲), FlUDP (■), and FlUTP (⧫). Error bars designate SD (n = 3). See also Table 1 and Figures S3–S5.
Figure 3
Figure 3
(a–f) Representative gel filtration profiles. In b–f, — and ⋯ indicate A280 and A260 traces, respectively. (a) MW standards: thyroglobulin (669 kDa, 17.6 min); ferritin (440 kDa, 20.6 min); aldolase (158 kDa, 24.6 min); conalbumin (75 kDa, 27.8 min); ovalbumin (44 kDa, 29.8 min). Additional standards: β-amylase (200 kDa, 23.8 min); alcohol dehydrogenase (150 kDa, 25.7 min); and BSA (66 kDa, 28.0 min). (b) RNR-α alone. (c and d), RNR-α treated with ClADP or ClATP (250 μM, 2 min, 37 °C) was analyzed. Running buffer contained no nucleotides. (e) As in (c) and (d), except 250 M FlUDP replaced ClAD(T)P (Trace labeled T). Running buffer contained 20 M FlUDP (Trace labeled R). (f) Trace labeled “1x”: as in c and d, except 250 μM FlUTP replaced ClAD(T)P. Trace labeled “2x”: 500 μM FlUTP was used. (g) ClADP was recovered quantitatively post enzyme inhibition. Left panel: HPLC diode array traces of nucleotides and small molecules extracted from inhibition mixture. Inset shows expansion at the retention time expected for ClADP (21 min; by comparison to an authentic standard under otherwise identical conditions). Red and blue traces designate the reaction and control (identical conditions except no α), respectively. Right panel: UV–vis absorbance spectra corresponding to the peak maxima at the 21 min within red (⋯) and blue (—) traces.
Figure 4
Figure 4
Determination of binding site specificity by fluorescence anisotropy (FA). (a,b) ClATP A-site-binding specificity. Also see Figure S5 for independent validations by activity assays and Figure S6 for additional FA data and titration studies. (a) Addition of ClATP to a sample containing RNR-α, T*-dATP (S- and A-site binder) and dTTP (S-site-exclusive binder in saturating amounts) led to a further decrease in FA, suggesting ClATP interacts at the A site. Also see Figure S6. (b) Using the reduced-affinity-A-site-binding mutant D57N-α, the addition of ClATP to a sample containing this mutant and T*-dATP (binds S-site of the mutant) resulted in a minute decrease in FA compared to the values obtained when S-site-exclusive binders (dTTP or dGTP) were added (left panel). When wt-α was used in place of a mutant in which T*-dATP can interact with both A and S sites, higher levels of anisotropy drop were measured upon the addition of ClATP (right panel) compared to that obtained in the case with mutant (left panel). (c) ClADP C-site-binding specificity determined by size exclusion chromatography (SEC). Gel filtration analysis of RNR-α treated with buffer alone (⋯ dark), saturating amounts of dATP alone (— green), ClADP alone (⋯ blue), or both (— magenta). α6 peak observed only when ClADP treatment was additionally included, but not in dATP-saturated sample (A and S sites occupied), suggesting ClADP binds at the C site. (d,e) ClATP and ClADP A-site- and C-site-binding specificities, respectively. FA was first measured for a sample containing RNR-α, T*-dATP, and dTTP (saturating amounts at S site). Unlike treatment with ClATP, which resulted in a ~20% further drop in FA due to T*-dATP displacement, ClADP (e) caused no statistically significant changes in FA consistent with ClADP interacting with neither the S nor A site. By gel filtration, the sample treated with ClADP (right-hand bar in the plot) resulted in an appreciable fraction of hexamers, whereas the control sample (first bar in plot) eluted exclusively as a monomer. Error bars designate SD (n = 3). See text for discussion. The experimental data in this figure and Figure S6 are interpreted on the assumption that T*-dATP binds to the same site as dATP.
Figure 5
Figure 5
(a) Different nucleotides gave rise to conformationally distinct hexamers. SDS-PAGE analysis of the samples in which RNR-α pretreated with buffer (“no drug” control) or respective drugs was incubated with buffer (“no trypsin” control) or trypsin protease (1 mg mL−1) over the indicated time. M, MW marker. See also Figure S7. (b) Quantification of the designated band intensities relative to the 92 kDa band in the sample without drug or trypsin (left, 92 kDa monomer; right, ~ 60 kDa band).
Figure 6
Figure 6
(a,b) Proliferation inhibition assays show protection from drug-induced cytotoxicity is selectively achieved in cells expressing oligomerization-defective D57N-α provided inhibitors cause α-hexamerization (ClF, ClA, and not F2C). See text for discussion with FlUMP. See also Figure S8. (a) Quantification of the data in b. Inset shows the experimental hypothesis. (b) Dose-dependent viability assays. 3-AP is an RNR-β-specific inhibitor (also see Figure S3a). 17-AAG is an HSP90 inhibitor.

References

    1. Terstappen GC, Schlupen C, Raggiaschi R, Gaviraghi G. Target deconvolution strategies in drug discovery. Nat Rev Drug Discovery. 2007;6:891–903. - PubMed
    1. Stubbe J, van der Donk WA. Ribonucleotide reductases: radical enzymes with suicidal tendencies. Chem Biol. 1995;2:793–801. - PubMed
    1. Nordlund P, Reichard P. Ribonucleotide reductases. Annu Rev Biochem. 2006;75:681–706. - PubMed
    1. Aye Y, Li M, Long MJ, Weiss RS. Ribonucleotide reductase and cancer: biological mechanisms and targeted therapies. Oncogene. 2015;34:2011–2021. - PubMed
    1. Licht S, Stubbe J. In: Mechanistic Investigations of Ribonucleotide Reductases. Poulter CD, editor. Elsevier; Amsterdam: 1999. p. 163.p. 203.

Publication types

MeSH terms