Body Size Changes Among National Collegiate Athletic Association New England Division III Football Players, 1956-2014: Comparison With Age-Matched Population Controls
- PMID: 27159189
- PMCID: PMC5013707
- DOI: 10.4085/1062-6050-51.5.14
Body Size Changes Among National Collegiate Athletic Association New England Division III Football Players, 1956-2014: Comparison With Age-Matched Population Controls
Abstract
Context: Collegiate football programs encourage athletes to pursue high body weights.
Objective: To examine position-dependent trends over time in body size characteristics among football players in the National Collegiate Athletic Association Division III New England Small College Athletic Conference (NESCAC) from 1956 to 2014 and to compare the observed absolute and relative changes with those in age-matched male population controls.
Design: Descriptive laboratory study.
Setting: Medical school affiliated with a NESCAC institution.
Patients or other participants: Football team rosters from the 10-member NESCAC schools, available as public documents, were analyzed along with body size data from general population males aged 20 to 29 years from the National Health and Nutrition Examination Survey (NHANES).
Main outcome measure(s): Body weight, height, and calculated body mass index were evaluated using analysis of variance, linear regression, and nonlinear regression to determine the distribution features of size variables and changes associated with time (year), school, and position.
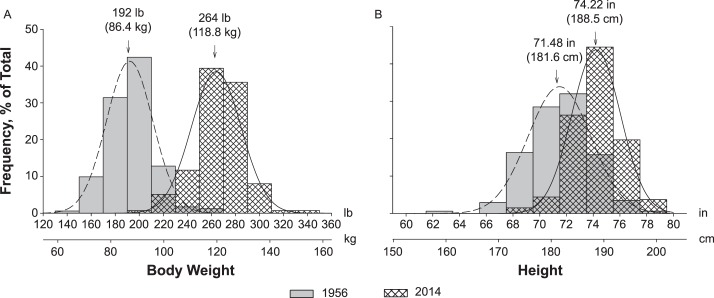
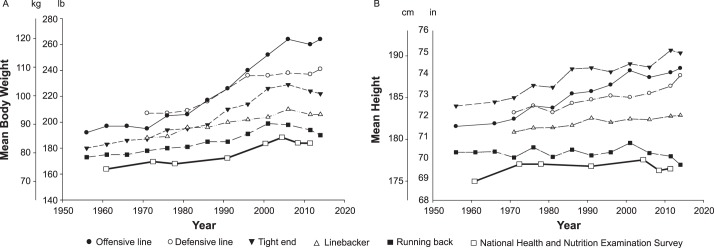
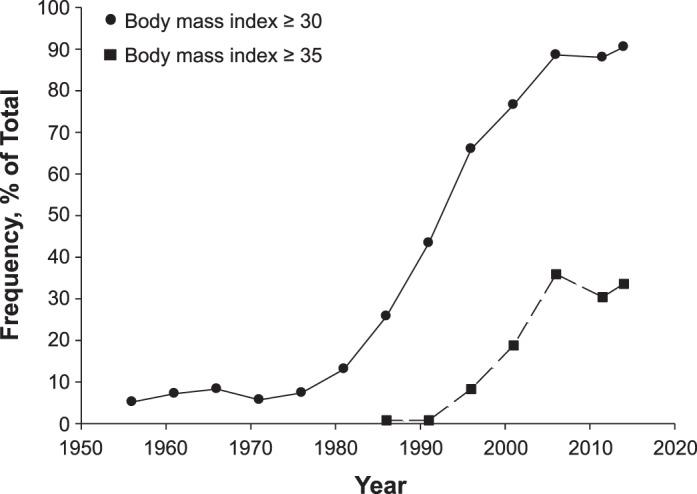
Results: Among NESCAC linemen, absolute and relative changes over time in body weight and body mass index exceeded corresponding changes in the NHANES population controls. New England Small College Athletic Conference offensive linemen body weights increased by 37.5% from 1956 to 2014 (192 to 264 lb [86.4 to 118.8 kg]), compared with a 12% increase (164 to 184 lb [73.8 to 82.8 kg]) since 1961 in the NHANES population controls. Body mass index changed in parallel with body weight and exceeded 35 kg/m(2) in more than 30% of contemporary NESCAC offensive linemen. Among skill players in the NESCAC group, time-related changes in body size characteristics generally paralleled those in the NHANES controls.
Conclusions: High body weight and body mass indices were evident in offensive linemen, even among those in Division III football programs with no athletic scholarships. These characteristics may be associated with adverse cardiovascular and metabolic outcomes. We need approaches to encourage risk modification in the postfootball lifestyles of these individuals.
Keywords: Division III football; body mass index; body weight; obesity; offensive linemen.
Figures
References
-
- Greenblatt DJ. The seventy-kilogram fantasy. Clin Pharmacol Drug Dev. 2013; 2 2: 101– 102. - PubMed
-
- Flegal KM, Carroll MD, Kit BK, Ogden CL. Prevalence of obesity and trends in the distribution of body mass index among US adults, 1999−2010. JAMA. 2012; 307 5: 491– 497. - PubMed
-
- Ogden CL, Fryar CD, Carroll MD, Flegal KM. Mean body weight, height, and body mass index, United States 1960−2002. Adv Data. 2004; 347: 1– 17. - PubMed
-
- McDowell MA, Fryar CD, Ogden CL. Anthropometric reference data for children and adults: United States, 1988−1994. Vital Health Stat 11. 2009; 249: 1– 68. - PubMed
MeSH terms
LinkOut - more resources
Full Text Sources
Other Literature Sources