. 2016 Jul 1;73(7):836-845.
doi: 10.1001/jamaneurol.2016.0363.

Association of MTOR Mutations With Developmental Brain Disorders, Including Megalencephaly, Focal Cortical Dysplasia, and Pigmentary Mosaicism

Affiliations

Association of MTOR Mutations With Developmental Brain Disorders, Including Megalencephaly, Focal Cortical Dysplasia, and Pigmentary Mosaicism

Ghayda M Mirzaa et al. JAMA Neurol. .

Abstract

Importance: Focal cortical dysplasia (FCD), hemimegalencephaly, and megalencephaly constitute a spectrum of malformations of cortical development with shared neuropathologic features. These disorders are associated with significant childhood morbidity and mortality.

Objective: To identify the underlying molecular cause of FCD, hemimegalencephaly, and diffuse megalencephaly.

Design, setting, and participants: Patients with FCD, hemimegalencephaly, or megalencephaly (mean age, 11.7 years; range, 2-32 years) were recruited from Pediatric Hospital A. Meyer, the University of Hong Kong, and Seattle Children's Research Institute from June 2012 to June 2014. Whole-exome sequencing (WES) was performed on 8 children with FCD or hemimegalencephaly using standard-depth (50-60X) sequencing in peripheral samples (blood, saliva, or skin) from the affected child and their parents and deep (150-180X) sequencing in affected brain tissue. Targeted sequencing and WES were used to screen 93 children with molecularly unexplained diffuse or focal brain overgrowth. Histopathologic and functional assays of phosphatidylinositol 3-kinase-AKT (serine/threonine kinase)-mammalian target of rapamycin (mTOR) pathway activity in resected brain tissue and cultured neurons were performed to validate mutations.

Main outcomes and measures: Whole-exome sequencing and targeted sequencing identified variants associated with this spectrum of developmental brain disorders.

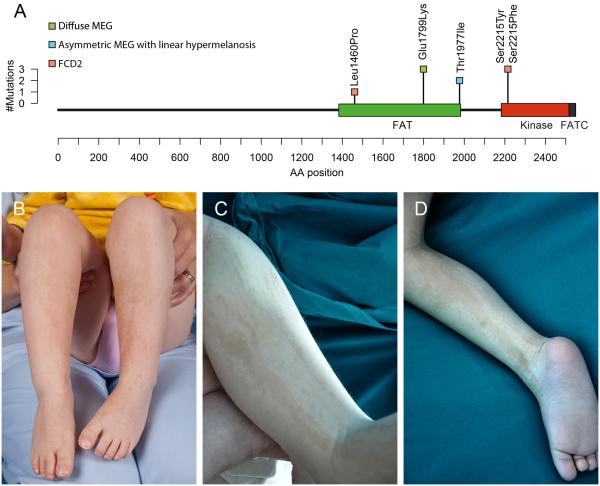
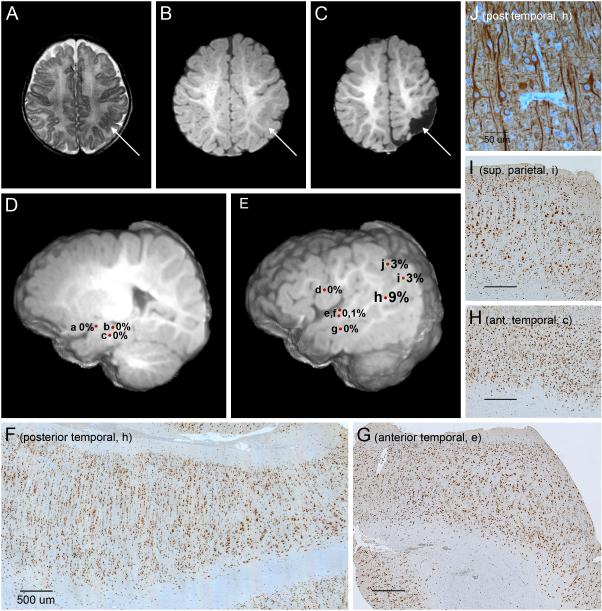
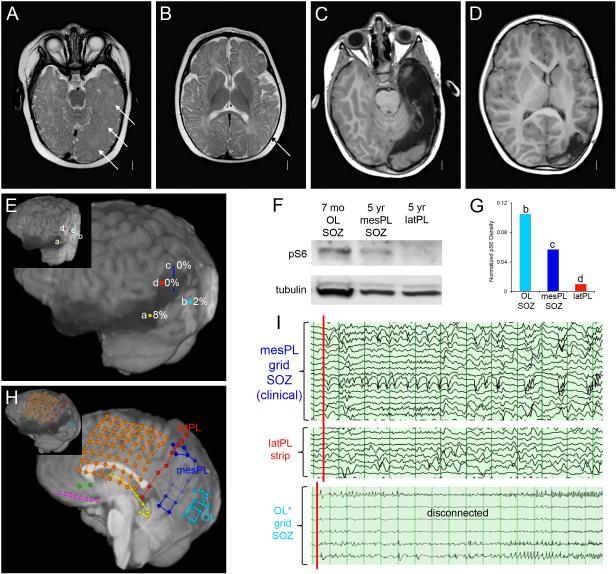
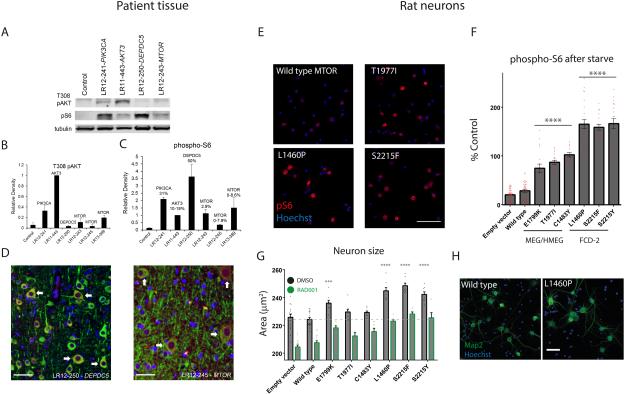
Results: Low-level mosaic mutations of MTOR were identified in brain tissue in 4 children with FCD type 2a with alternative allele fractions ranging from 0.012 to 0.086. Intermediate-level mosaic mutation of MTOR (p.Thr1977Ile) was also identified in 3 unrelated children with diffuse megalencephaly and pigmentary mosaicism in skin. Finally, a constitutional de novo mutation of MTOR (p.Glu1799Lys) was identified in 3 unrelated children with diffuse megalencephaly and intellectual disability. Molecular and functional analysis in 2 children with FCD2a from whom multiple affected brain tissue samples were available revealed a mutation gradient with an epicenter in the most epileptogenic area. When expressed in cultured neurons, all MTOR mutations identified here drive constitutive activation of mTOR complex 1 and enlarged neuronal size.

Conclusions and relevance: In this study, mutations of MTOR were associated with a spectrum of brain overgrowth phenotypes extending from FCD type 2a to diffuse megalencephaly, distinguished by different mutations and levels of mosaicism. These mutations may be sufficient to cause cellular hypertrophy in cultured neurons and may provide a demonstration of the pattern of mosaicism in brain and substantiate the link between mosaic mutations of MTOR and pigmentary mosaicism in skin.


Figures

Figure 1
Figure 1. MTOR mutations (A) and clinical photographs of patients with MTOR mutations, megalencephaly and cutis tricolor of the Blaschko-linear type (B–D)
Panel A shows the positions of MTOR coding mutations identified in this report relative to their locations within the MTOR protein domain structure. The height of the bar indicates the number of patients with mutations at that amino acid position, and the color of the square indicates the phenotype of the patient(s). Green=diffuse MEG; blue=asymmetric MEG with linear hyper‐ and hypomelanosis; pink=FCD2. Panels B (patient LR13-310) and C‐D (LR14-326) show alternating, predominatly linear streaks of hyper‐ and hypopigmented skin, which correpond to cutis tricolor of the Blaschko-linear type.
Figure 2
Figure 2. Brain imaging and histopathology in patient LR13-389 with MTOR p.Ser2215Phe mutation
Panels A‐C show an area of cortical infolding and thickening in the left posterior temporal and parietal lobes (arrows) on preoperative T2 (A) and T1-weighted (B) images, that has been excised on a postsurgical T2-weighted image (C). Panels D and E are preoperative deep (D) and superficial (E) 3-dimensional images that show the locations and levels of mosaicism (alternate allele fractions) of specimens collected during surgery. These include the amygdala (a), hippocampus (b), deep anterior temporal lobe (c), frontal operculum (d), anterior temporal lobe – superior temporal gyrus (e and f), anterior temporal lobe – middle temporal gyrus (g), posterior temporal lobe (h), inferior parietal lobe (i), and superior parietal lobe (j). The levels of mosaicism, while all low, are highest in the center of the dysplasia (h at 9%), intermediate along the posterior border (i and j at 3%), and too low to detect consistently along the anterior border of the lesion (a-g at 0-1%) even though all sections show changes of focal cortical dysplasia type 2a. Panels F through I are brain sections stained with NeuN, which all show loss of cortical lamination, excessive tall vertical columns of neurons (especially prominent in F), numerous maloriented large neurons, and blurring of the cortical-white matter boundary. The proportion of large dysplastic neurons appears higher in sections with higher mutation levels (F and I) compared to regions with undetected mutations (G and H). In the section from the center of the dysplasia with the highest level of mutation, a transition can be seen with less severe dysplasia on the left of the image and more severe dysplasia with more numerous large dysplastic neurons on the right (F). Panel J is the same section as panel F stained with MAP2 at higher power, and shows several large dysplastic neurons with disorganized processes, excessive cytoskeletal elements within cell bodies and abnormally oriented dendrites that often crowd together.
Figure 3
Figure 3. Differential MTOR mutation burden and phosphorylated ribosomal protein S6 expression in a girl (LR12-245) with both early- and later-onset seizures due to FCD2a
Panels A and B show MRI images performed at 6 months just before the first surgical procedure. The findings include increased volume of the left mid-temporal lobe, mild thickening and irregularity of the cortex (arrows in A) and similar but more focal changes in the superior temporal lobe (arrow in B). Panels C and D show MRI images performed just before the second surgery at 5 years. They demonstrate the surgical defect and subtle changes in the left parietal lobe (C‐D). Panel E shows the locations of the four surgical specimens used for both genetic and tissue analysis as indicated by colored circles: temporal lobe from the first surgery (a, yellow), occipital lobe seizure onset zone (SOZ) disconnected during the first surgery but not removed till the second surgery (b, light blue), medial parietal SOZ from the second surgery (c, dark blue) and lateral parietal cortex also from second surgery (d, red) that was not involved in seizure onset. The inset shows the locations in 3 dimensions. Panels F and G show Western blots for phospho-S6 from the occipital lobe (OL, location b in panel E), mesial parietal lobe (mesPL, c) and lateral parietal lobe (latPL, d). This analysis demonstrated a higher level of phospho-S6 in the occipital lobe compared to the mesial and lateral parietal lobes. Panel H is a 3D brain rendering trimmed to midline to display medial electrodes, and shows grid and strip placement for intracranial EEG monitoring at 5 years. Dark blue = medial parietal grid, red = lateral parietal strip, light blue = occipital grid. The inset provides a better 3D view of the locations. Panel I shows EEG tracings from intraoperative grids placed over the temporal, parietal and occipital regions just prior to the second resection. The tracings show several seizure onset zones (SOZ). The most active interictal discharges came from the most inferior leads on the mesial parietal grid (dark blue grid in H, leads 1-3 and 9-11), marking a SOZ. These events spread quickly to other mesial parietal leads as well as the lateral parietal strip (red strip in E, leads 1-8). Several independent SOZ were seen in the occipital lobe, which had been disconnected several years before. The voltages are lower as the grid was not as closely apposed to the brain surface. Overall, the highest levels of phospho-S6 expression were seen in the occipital lobe (OL) SOZ responsible for early-onset seizures, with lower expression in the medial parietal cortex SOZ responsible for later-onset seizures, and nearly undetectable levels in the lateral parietal cortex that was not involved in seizure generation. These findings correlate with MTOR mutation burden determined from these same samples (panel E and Supplementary Table 4).
Figure 4
Figure 4. Functional consequences of PI3K-AKT-mTOR pathway mutations in patient tissue and rodent neurons
Panel A shows representative Western blots comparing levels of T308 AKT phosphorylation (PI3K-PDK1-dependent) to ribosomal protein S6 phosphorylation (mTORC1-dependent) in control and dysplastic brain specimens containing the indicated mutations. Specimens with “upstream” pathway mutations (PIK3CA, AKT3) have the highest levels of AKT phosphorylation, while specimens with “downstream” mutations (DEPDC5, MTOR) exhibit elevation of phospho-S6 with lesser elevation of T308 phospho-AKT. Panels B and C show averaged results from five blots for T308 phospho-AKT (B) and phospho-S6 (C). Panels in D show phosphorylated ribosomal protein S6 expression at high power, indicating activation of the PI3K-AKT-mTOR pathway, in a subset of neurons in dysplastic human cortex with DEPDC5 or MTOR mutations. Green = MAP2 neuronal marker, Red = phospho-S6, Blue = DAPI nuclear stain. Arrows indicate dysmorphic neurons co-expressing MAP2 and phospho-S6, which appear orange in color. Scale bars = 50 μm. Panel E shows representative images of phospho-S6 indirect immunofluorescence of rat neurons electroporated with indicated wild-type or mutant MTOR constructs. Scale bar = 100 μm. Panel F quantifies average phospho-S6 immunofluorescence intensity for DIV12 neurons transfected (NeuN positive, HA-tag/ZsGreen positive) with MTOR or empty vector constructs as indicated, and treated with amino acid and growth factor starvation for 2 hours. Data are baseline subtracted (phospho-S6 values in empty vector transfected neurons treated with 200 nM RAD001) and normalized to phospho-S6 immunofluorescence intensities in wild-type MTOR neurons in normal media. Data points represent averages per individual wells; columns and error bars are means across wells and standard error of means. Asterisks and lines represent significant differences between genotypes (ANOVA, Tukey’s test for multiple comparisons, comparing each condition to every other condition). Within each group (E1799K, T1977I, C1483Y; or S2215F, S2215Y, L1460P), data for individual genotypes are significantly different from genotypes in each other group or controls (empty vector and wild type MTOR electroporated neurons) at a significance level of p < 10-4. Panel G shows average neuronal size (cell body area encompassed by NeuN stain) for transfected neurons treated from DIV7-DIV14 with DMSO or 200 nM RAD001. 1 nM RAD001 intermediately reduced size (not shown). Asterisks denote significant difference of neuronal size for a given genotype compared to wild-type MTOR (ANOVA, Dunnett’s test for multiple comparisons). For every genotype, RAD001 significantly reduced neuronal size (p < 10-3 or less). See also figure 8 in supplemental appendix for size analysis of neurons at DIV12, distributions of phospho-S6 and cell sizes across cells, and representative NeuN immunostaining. Panel H shows representative fields of immunostaining for Map2 and Hoechst. Scale bar = 50 μm.

Comment in

References

    1. Harvey AS, Cross JH, Shinnar S, Mathern BW. Defining the spectrum of international practice in pediatric epilepsy surgery patients. Epilepsia. 2008;49:146–55. - PubMed
    1. Blümcke I, Thom M, Aronica E, et al. The clinicopathologic spectrum of focal cortical dysplasias: a consensus classification proposed by an ad hoc Task Force of the ILAE Diagnostic Methods Commission. Epilepsia. 2011;52(1):158–174. - PMC - PubMed
    1. Jansen LA, Mirzaa GM, Ishak GE, et al. PI3K/AKT pathway mutations cause a spectrum of brain malformations from megalencephaly to focal cortical dysplasia. Brain J. Neurol. 2015 - PMC - PubMed
    1. Ljungberg MC, Bhattacharjee MB, Lu Y, et al. Activation of mammalian target of rapamycin in cytomegalic neurons of human cortical dysplasia. Ann. Neurol. 2006;60(4):420–429. - PubMed
    1. Wong M. Mammalian target of rapamycin (mTOR) activation in focal cortical dysplasia and related focal cortical malformations. Exp. Neurol. 2013;244:22–26. - PMC - PubMed

MeSH terms

Substances