. 2016 Jul;12(7):482-9.
doi: 10.1038/nchembio.2077. Epub 2016 May 2.

Metabolite concentrations, fluxes and free energies imply efficient enzyme usage

Affiliations

Metabolite concentrations, fluxes and free energies imply efficient enzyme usage

Junyoung O Park et al. Nat Chem Biol. 2016 Jul.

Abstract

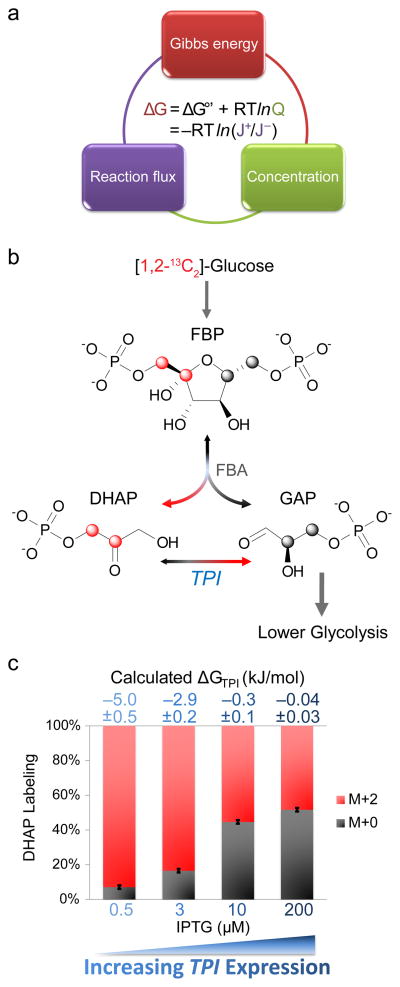
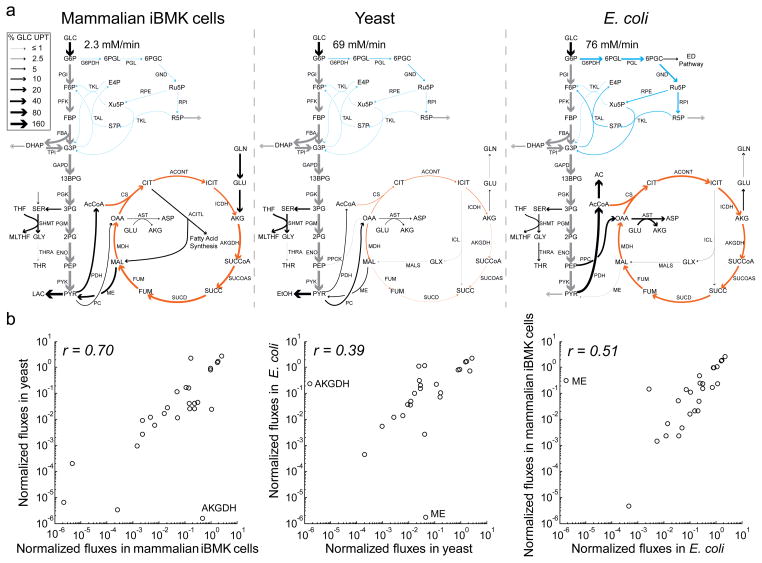
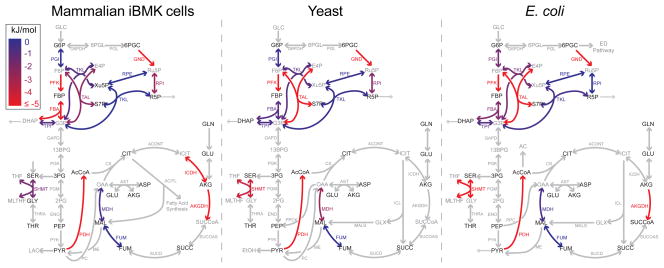
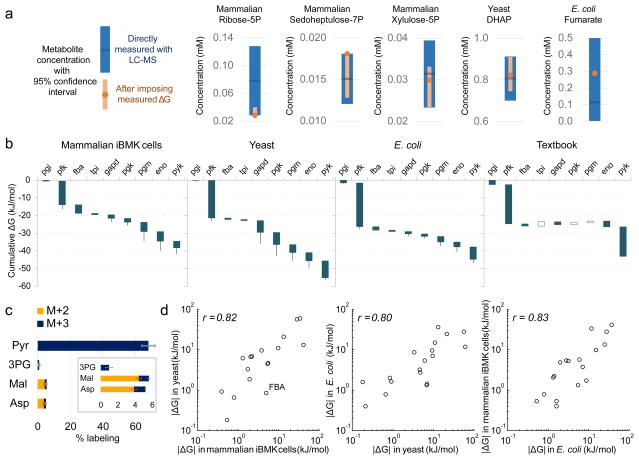
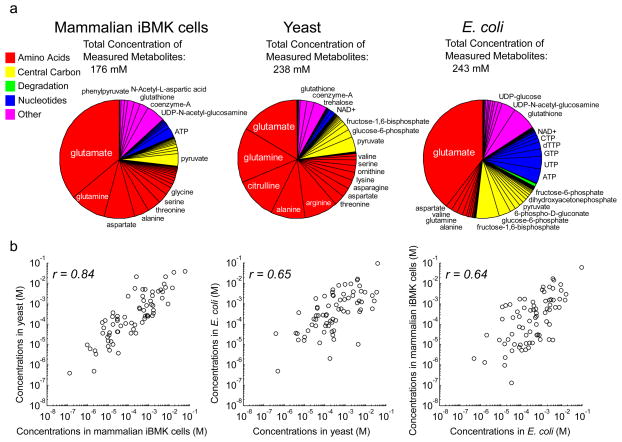
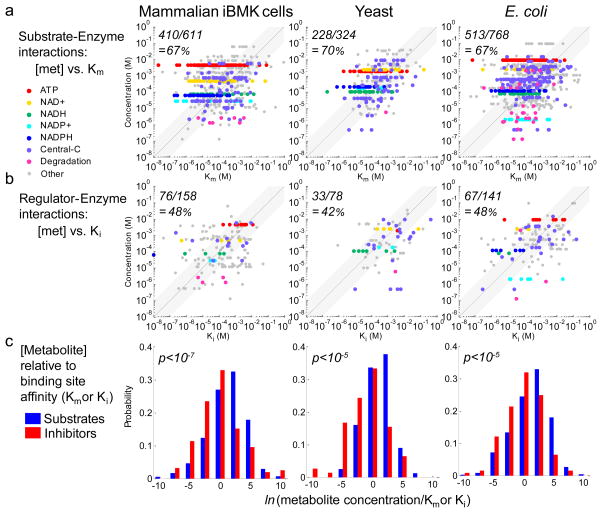
In metabolism, available free energy is limited and must be divided across pathway steps to maintain a negative ΔG throughout. For each reaction, ΔG is log proportional both to a concentration ratio (reaction quotient to equilibrium constant) and to a flux ratio (backward to forward flux). Here we use isotope labeling to measure absolute metabolite concentrations and fluxes in Escherichia coli, yeast and a mammalian cell line. We then integrate this information to obtain a unified set of concentrations and ΔG for each organism. In glycolysis, we find that free energy is partitioned so as to mitigate unproductive backward fluxes associated with ΔG near zero. Across metabolism, we observe that absolute metabolite concentrations and ΔG are substantially conserved and that most substrate (but not inhibitor) concentrations exceed the associated enzyme binding site dissociation constant (Km or Ki). The observed conservation of metabolite concentrations is consistent with an evolutionary drive to utilize enzymes efficiently given thermodynamic and osmotic constraints.


Conflict of interest statement

Competing Financial Interests

The authors declare no competing financial interests.

Figures

Figure 1
Figure 1. Tracing forward-to-backward flux through triose phosphate isomerase (TPI)
(a) The free energy of cellular reactions (ΔG) is independently determined by i) the reaction standard free energy adjusted for substrate and product concentrations and ii) the ratio of forward-to-backward fluxes. The integration of experimental measurements of forward-to-backward reaction fluxes and of metabolite concentrations results in more coherent and precise determination of both concentrations and ΔG. (b) [1,2-13C]-glucose (red atom: 13C) yields [1,2-13C]-fructose-1,6-bisphosphate (FBP), the parent molecule of dihydroxyacetone phosphate (DHAP) and glyceraldehyde-3-phosphate (GAP). FBP carbons 1–3 form DHAP. Thus, in the absence of backwards flux through triose phosphate isomerase (TPI), all DHAP molecules would be labeled (M+2). Reverse flux through TPI results in the appearance of unlabeled DHAP. (c) To verify that we can measure different extents of reversibility, we knocked out in E. coli the chromosomal TPI and introduced a plasmid containing TPI under the control of inducer IPTG. The fraction of unlabeled DHAP progressively increased with IPTG addition. The extent of DHAP labeling at pseudo-steady state was used to determine the ratio of forward-to-backward TPI flux by isotopomer balancing. The flux ratio then yields ΔG as per (a). Labeling fraction error bars represent standard deviations (n=3) and calculated ΔG errors represent 95% confidence intervals.
Figure 2
Figure 2. Metabolic flux distributions in mammalian iBMK cells, yeast, and E. coli
Fluxes were determined by integrating direct nutrient uptake and waste secretion rate measurements and data from multiple isotope tracers by metabolic flux analysis. (a) Net fluxes. Arrow widths indicate absolute magnitudes of fluxes, normalized to glucose uptake, as per the legend. Absolute magnitude of glucose uptake is shown for each organism. Grey, glycolysis; blue, pentose phosphate pathway; orange, TCA cycle; black, other. (b) Comparison of normalized net fluxes across organisms. Fluxes were normalized to the organism’s glucose uptake rate. Plotted data are restricted to linearly independent fluxes (e.g., lower glycolysis is shown once per graph, not repeatedly for each pathway enzyme).
Figure 3
Figure 3. Reaction free energy determined with isotope tracers in mammalian iBMK cells, yeast, and E. coli
Flux reversibility and ΔG were determined from forward and backward fluxes. Blue, equilibrium (ΔG ≈ 0 kJ/mol); red, substantially forward driven (ΔG ≤ −5 kJ/mol); grey, not measured based solely on isotope tracer data (for reversibility of glycolytic reactions inferred from combined flux and concentration data, see Fig. 4b).
Figure 4
Figure 4. Integration of flux and concentration measurements via ΔG
(a) The absolute concentrations of those metabolites involved in reactions with ΔG determined from reaction reversibility (Fig. 3b) were refined by combining confidence intervals from direct LC-MS measurement of their concentrations (blue) with thermodynamic constraints to obtained more precise values (orange). For example, the concentration of fumarate is informed also by that of malate, in combination with the reversibility of fumarase. (b) ΔG for glycolysis based on integration of metabolite concentrations and reaction reversibilities. Blue and white bars depict negative and positive ΔG, respectively. Whiskers show 95% confidence limits (see Methods). (c) An unexpected finding from the thermodynamic analysis in (b) is partial reversibility of pyruvate kinase. To demonstrate directly this reversibility, [U-13C]-pyruvate (0.45 mM) was added to the media of growing iBMK cells for 20 min and upstream and downstream metabolites were analyzed for labeling. Error bars represent standard errors of the means (n=3). (d) Comparison of ΔG across organisms. Plotted data are for all measured reactions with ΔG < −0.1 kJ/mol.
Figure 5
Figure 5. Conservation of absolute metabolite concentrations
(a) Pie chart showing fractional contribution of each measured metabolite in each organism. Concentrations were obtained by the integrative analysis as per Fig. 4a. Names are shown for metabolites whose fractional concentration exceeds 1%. (b) Comparison of absolute metabolite concentrations across organisms. Plotted data are for all measured metabolites.
Figure 6
Figure 6. Comparison of absolute concentrations to enzyme binding site affinities for substrates and for inhibitors
(a, b) Comparison of absolute metabolite concentrations (Y-axis) to enzyme binding site affinities (X-axis). The fraction of concentrations exceeding Km or Ki (i.e., data points above the line of unity) is shown in the top left of each graph. (c) Enzyme active sites are in general more saturated than inhibitor sites (p-values are from the Kolmogorov-Smirnov test).

References

    1. Bennett BD, et al. Absolute metabolite concentrations and implied enzyme active site occupancy in Escherichia coli. Nat Chem Biol. 2009;5:593–599. - PMC - PubMed
    1. Henry CS, Broadbelt LJ, Hatzimanikatis V. Thermodynamics-based metabolic flux analysis. Biophysical journal. 2007;92:1792–1805. - PMC - PubMed
    1. Joshi A, Palsson BO. Metabolic dynamics in the human red cell. Part III—Metabolic reaction rates. Journal of Theoretical Biology. 1990;142:41–68. - PubMed
    1. Chassagnole C, Noisommit-Rizzi N, Schmid JW, Mauch K, Reuss M. Dynamic modeling of the central carbon metabolism of Escherichia coli. Biotechnol Bioeng. 2002;79:53–73. - PubMed
    1. van Eunen K, et al. Measuring enzyme activities under standardized in vivo-like conditions for systems biology. FEBS J. 2010;277:749–760. - PubMed