. 2016 May 10;16(1):110.
doi: 10.1186/s12870-016-0797-1.

Single-cell-type quantitative proteomic and ionomic analysis of epidermal bladder cells from the halophyte model plant Mesembryanthemum crystallinum to identify salt-responsive proteins

Affiliations

Single-cell-type quantitative proteomic and ionomic analysis of epidermal bladder cells from the halophyte model plant Mesembryanthemum crystallinum to identify salt-responsive proteins

Bronwyn J Barkla et al. BMC Plant Biol. .

Abstract

Background: Epidermal bladder cells (EBC) are large single-celled, specialized, and modified trichomes found on the aerial parts of the halophyte Mesembryanthemum crystallinum. Recent development of a simple but high throughput technique to extract the contents from these cells has provided an opportunity to conduct detailed single-cell-type analyses of their molecular characteristics at high resolution to gain insight into the role of these cells in the salt tolerance of the plant.

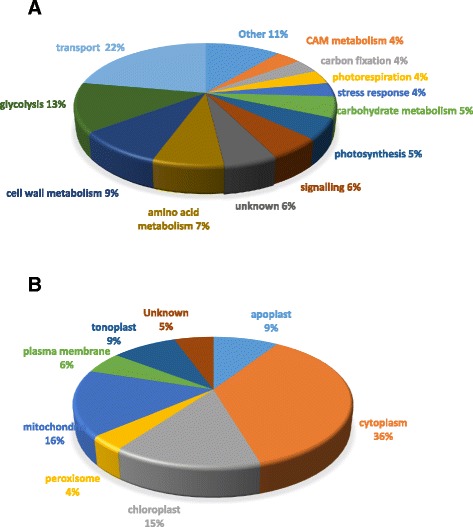
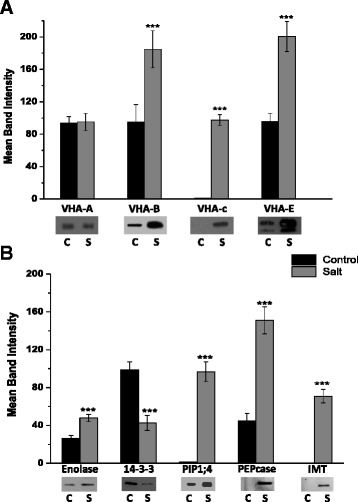
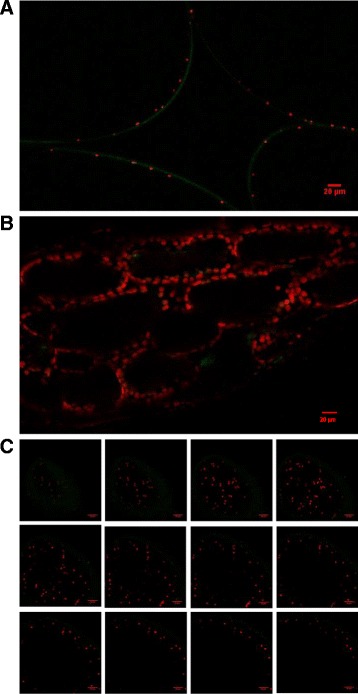
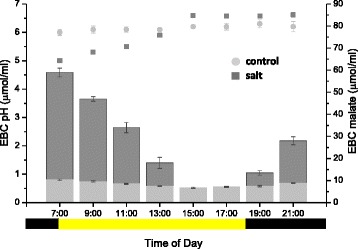
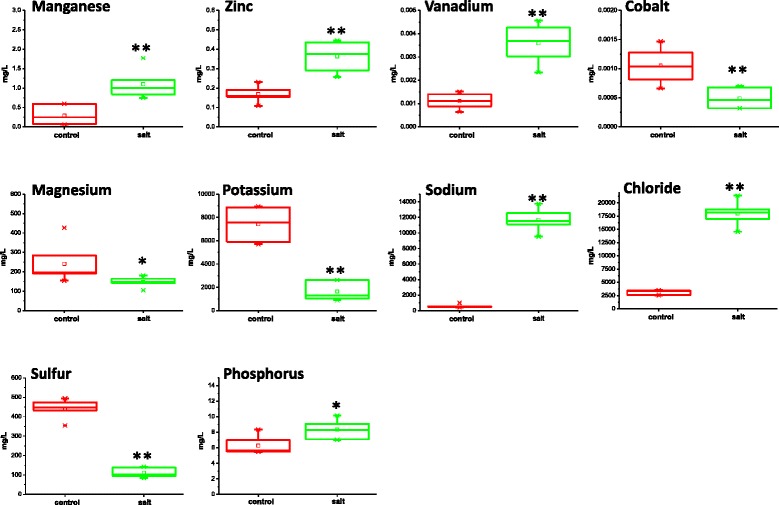
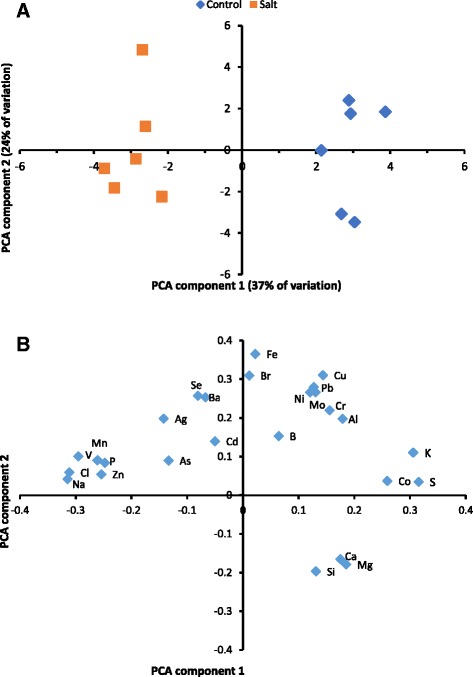
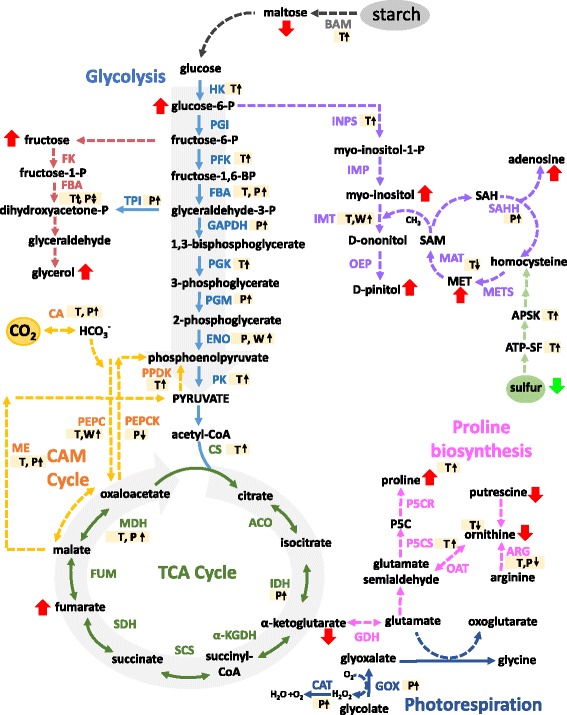
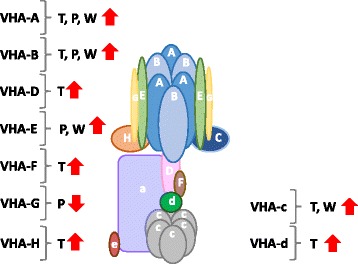
Results: In this study, we carry out large-scale complementary quantitative proteomic studies using both a label (DIGE) and label-free (GeLC-MS) approach to identify salt-responsive proteins in the EBC extract. Additionally we perform an ionomics analysis (ICP-MS) to follow changes in the amounts of 27 different elements. Using these methods, we were able to identify 54 proteins and nine elements that showed statistically significant changes in the EBC from salt-treated plants. GO enrichment analysis identified a large number of transport proteins but also proteins involved in photosynthesis, primary metabolism and Crassulacean acid metabolism (CAM). Validation of results by western blot, confocal microscopy and enzyme analysis helped to strengthen findings and further our understanding into the role of these specialized cells. As expected EBC accumulated large quantities of sodium, however, the most abundant element was chloride suggesting the sequestration of this ion into the EBC vacuole is just as important for salt tolerance.

Conclusions: This single-cell type omics approach shows that epidermal bladder cells of M. crystallinum are metabolically active modified trichomes, with primary metabolism supporting cell growth, ion accumulation, compatible solute synthesis and CAM. Data are available via ProteomeXchange with identifier PXD004045.

Keywords: Chloride; Crassulacean acid metabolism (CAM); Ionomics; Proteomics; Salinity; Salt tolerance; Single cell-type; Sodium; Trichome; V-ATPase.


Figures

Fig. 1
Fig. 1
Gene Ontology (GO) term enrichment analysis of identified proteins in the category of (a), biological function and (b), cellular location. According to UniProtKB GO annotations
Fig. 2
Fig. 2
Western blot analysis of EBC extracts for validation of proteomics results. Graphical representation of mean band intensity (top) and western blots (below) of EBC extract total protein isolated from control (C, black bars) and salt-treated (S, grey bars) M. crystallinum plants. Blots were probed with; (a) polyclonal antibodies against the subunits of the V-ATPase (VHA-A, VHA-B, VHA-c and VHA-E), or (b) polyclonal antibodies against the glycolytic enzyme enolase, ENO; the 14-3-3 general regulatory factor protein, 14-3-3; the plasma membrane aquaporin, PIP1;4; the CAM enzyme phosphoenolpyruvate carboxylase, PEPC and inositol methyl transferase, IMT. Western blot analysis was carried out as described in the Methods section. Blots are representative of three independent experiments. Unpaired two-tailed Student’s t-test (p ≤ 0.05) was performed on the mean band intensity data to determine the significance difference
Fig. 3
Fig. 3
Visualization of EBC chloroplast autofluorescence by confocal laser scanning microscopy. Stem sections from salt-treated plants were submerged in water and images were obtained using an Olympus FV1000 confocal laser scanning microscope using an XLPLN 25X W NA:1.05 water immersion objective lens. Laser wavelength 1 = 488 (green) cell wall autofluorescence, Laser wavelength 2 = 635 (red) chloroplast autofluorescence. (a) Chloroplasts in EBC and (b), mesophyll cells. (c) Each panel is a single confocal section taken from a Z-stack of 12 confocal images acquired at 20 μm intervals
Fig. 4
Fig. 4
Measurement of pH and malate in EBC extract. Malate (bar graphs) and pH (scatter plot) were measured in leaves of control (light grey bars and symbols) and salt-treated (dark grey bars and symbols) plants at 2 h intervals from 7:00 to 21:00. The yellow horizontal bar represents the light period and black bars represent the dark period. Values are expressed as means of three independent experiments with standard deviation (SD) shown not exceeding 10 %
Fig. 5
Fig. 5
Box plots of the significant changes in ion concentration of EBC from control and salt-treated plants. For each concentration, the box represents the interquartile range (IQR), the bisecting line represents the median, the square symbol represents the mean, the whiskers represent the 95th and 5th percentiles, and the X symbols represent the maximum and minimum values. Elements which are significantly different between treatments with a P < .01 are designated **, while those significantly different with P < 0.05 are designated *
Fig. 6
Fig. 6
Results from principal components analysis (PCA) of mineral data with (a) scores for each plant and (b) loadings for each element plotted for the first two PCA components
Fig. 7
Fig. 7
Integration of transcript, protein, metabolite and ionome data into EBC metabolic pathways. Data from all studies was obtained from 6-week-old plants treated for 2 weeks with 200 mM NaCl. Bladder cell extract was collected at the end of the dark period. Transcriptomic data from Oh et al., [24] and metabolomics data from Barkla and Vera-Estrella, [28]. T, transcript; P, protein and W, western blot analysis. Red arrows indicate changes in metabolites. Enzyme abbreviations: BAM – ϐ-amylase, HK – hexokinase, PGI – glucose-6P-isomerase, PFK – phosphofructokinase, FBA – aldolase, TPI – triose-P-isomerase, G3PD – glyceraldehyde-3P-dehydrogenase, PGK – phosphoglycerate kinase, PGM – phosphoglycerate mutase, ENO – enolase, PK- pyruvate kinase, FK – fructokinase, CS – citrate synthase, ACO – aconitase, IDH – isocitrate dehydrogenase, α-KGDH - α-ketoglutarate dehydrogenase, SCS – succinyl-CoA synthetase, SDH – succinate dehydrogenase, FUM – fumerase, MDH – malate dehydrogenase, PEPCK – PEP carboxykinase, ME – malic enzyme, PEPC – phosphoenolpyruvate carboxylase, PPDK – pyruvate-Pi-dikinase, CA – carbonic anhydrase, GDH – glutamate dehydrogenase, P5CS - pyrroline-5-carboxylate synthase, P5CR - pyrroline-5-carboxylase reductase, OAT - ornithine aminotransferase, ARG – arginase, INSP - myo-inositol 1-phosphate synthase, IMP – myo-inositol monophosphatase, IMT – inositol methyl transferase, OEP - ononitol epimerase, MAT – methionine adenosyltransferase, SAM - S-adenosyl methionine, SAH - S-adenosylhomocysteine, SAHH – S-adenosylhomocysteine hydrolase, MET – methionine, METS – methionine synthase, ATP-SF - ATP-sulfurylase, APSK - 5’-adenylylsulfate kinase, GOX - glucose oxidase, CAT – catalase
Fig. 8
Fig. 8
Integrated analysis of changes in transcript and protein abundance in EBC V-ATPase subunits. V-ATPase structure was adapted from Forgac, [57]. Changes in transcript abundance were taken from Oh et al., [24]. T, transcript; P, protein and W, western blot analysis

Similar articles

Cited by

References

    1. Misra BB, Assmann SM, Chen S. Plant single-cell and single-cell-type metabolomics. Trends Plant Sci. 2014;19:637–646. doi: 10.1016/j.tplants.2014.05.005. - DOI - PubMed
    1. Wagner GJ, Wang E, Shepherd RW. New approaches for studying and exploiting an old protuberance, the plant trichome. Ann Bot. 2004;93:3–11. doi: 10.1093/aob/mch011. - DOI - PMC - PubMed
    1. Dai X, Wang G, Yang DS, Tang Y, Broun P, Marks MD, Sumner LW, Dixon RA, Zhao PX. TrichOME: A comparative omics database for plant trichomes. Plant Physiol. 2010;152:44–54. doi: 10.1104/pp.109.145813. - DOI - PMC - PubMed
    1. Lüttge U. Structure and function of plant glands. Annu Rev Plant Physiol. 1971;22:23–44. doi: 10.1146/annurev.pp.22.060171.000323. - DOI
    1. Schilmiller AL, Last RL, Pichersky E. Harnessing plant trichome biochemistry for the production of useful compounds. Plant J. 2008;54:702–711. doi: 10.1111/j.1365-313X.2008.03432.x. - DOI - PubMed

Publication types

MeSH terms