

Removing entorhinal cortex input to the dentate gyrus does not impede low frequency oscillations, an EEG-biomarker of hippocampal epileptogenesis
- PMID: 27160925
- PMCID: PMC4861965
- DOI: 10.1038/srep25660
Removing entorhinal cortex input to the dentate gyrus does not impede low frequency oscillations, an EEG-biomarker of hippocampal epileptogenesis
Abstract
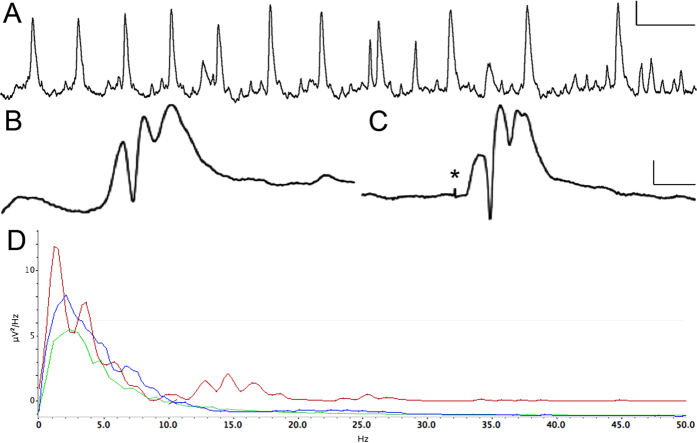
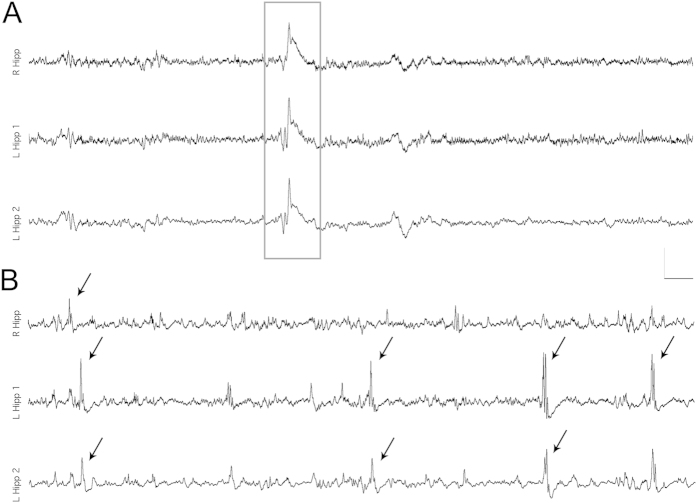
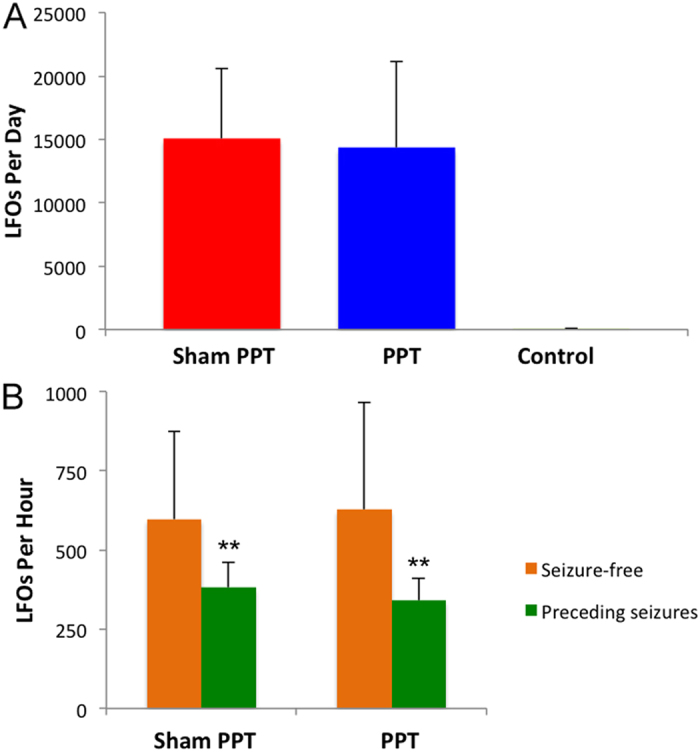
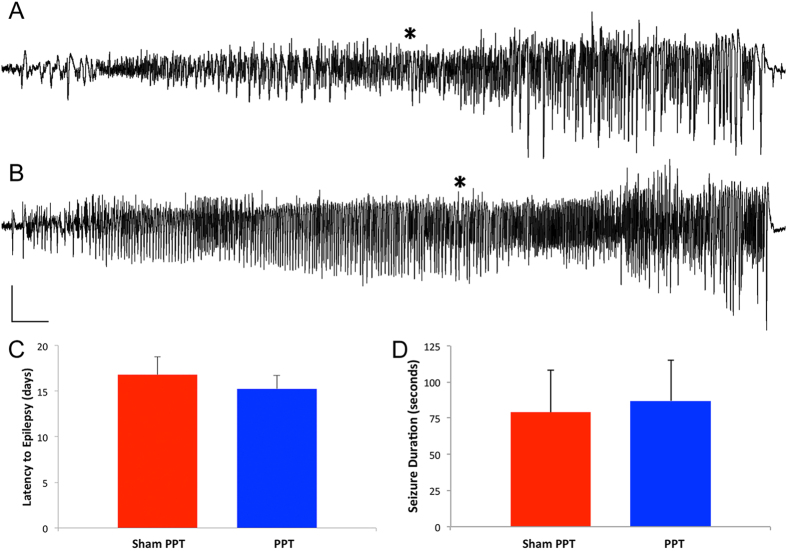
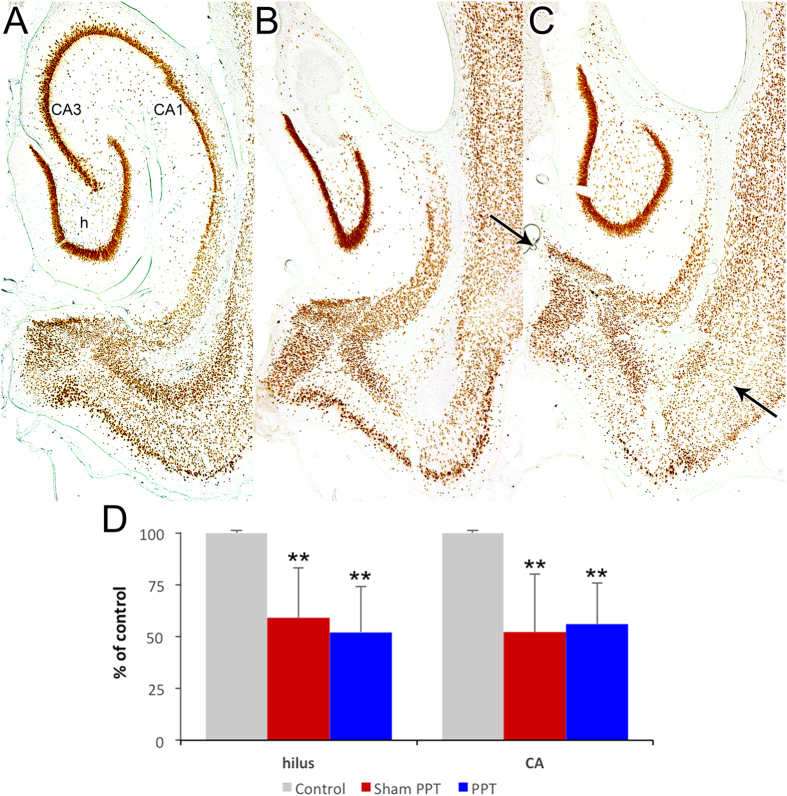
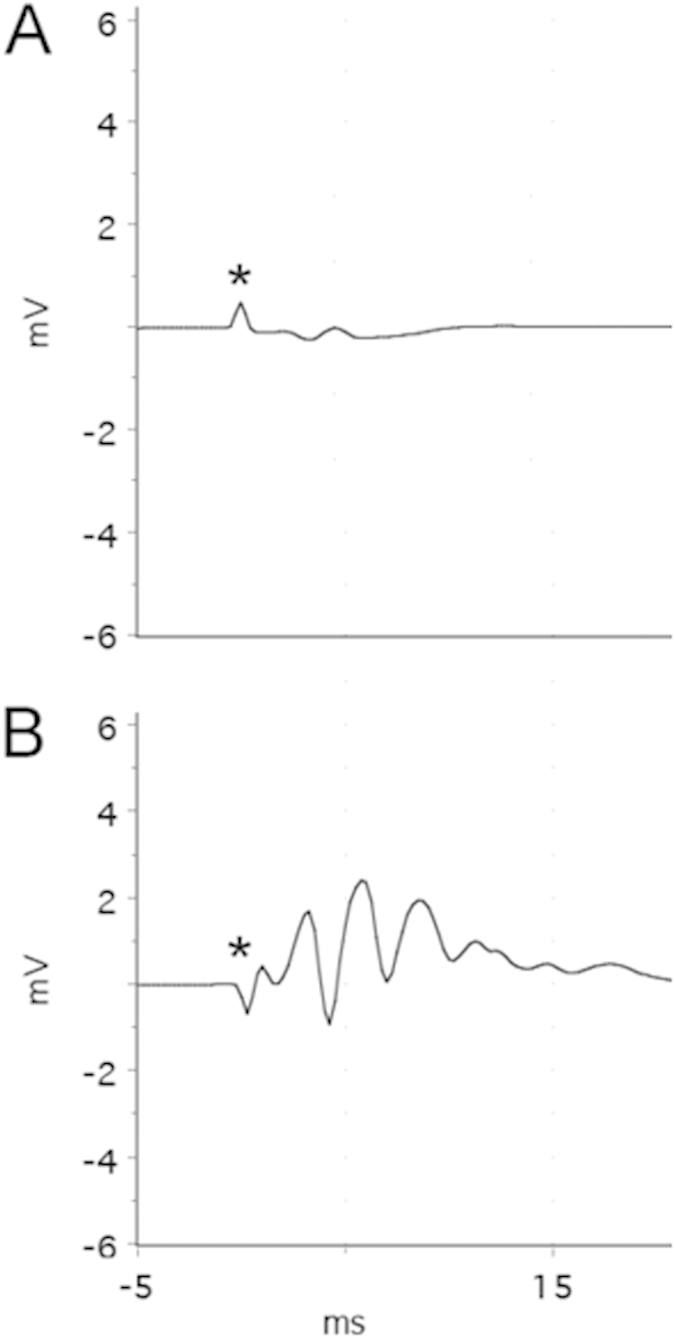
Following prolonged perforant pathway stimulation (PPS) in rats, a seizure-free "latent period" is observed that lasts around 3 weeks. During this time, aberrant neuronal activity occurs, which has been hypothesized to contribute to the generation of an "epileptic" network. This study was designed to 1) examine the pathological network activity that occurs in the dentate gyrus during the latent period, and 2) determine whether suppressing this activity by removing the main input to the dentate gyrus could stop or prolong epileptogenesis. Immediately following PPS, continuous video-EEG monitoring was used to record spontaneous neuronal activity and detect seizures. During the latent period, low frequency oscillations (LFOs), occurring at a rate of approximately 1 Hz, were detected in the dentate gyrus of all rats that developed epilepsy. LFO incidence was apparently random, but often decreased in the hour preceding a spontaneous seizure. Bilateral transection of the perforant pathway did not impact the incidence of hippocampal LFOs, the latency to epilepsy, or hippocampal neuropathology. Our main findings are: 1) LFOs are a reliable biomarker of hippocampal epileptogenesis, and 2) removing entorhinal cortex input to the hippocampus neither reduces the occurrence of LFOs nor has a demonstrable antiepileptogenic effect.
Figures
Similar articles
-
Local generation of fast ripples in epileptic brain.J Neurosci. 2002 Mar 1;22(5):2012-21. doi: 10.1523/JNEUROSCI.22-05-02012.2002. J Neurosci. 2002. PMID: 11880532 Free PMC article.
-
Chronic epileptogenesis requires development of a network of pathologically interconnected neuron clusters: a hypothesis.Epilepsia. 2000;41 Suppl 6:S144-52. doi: 10.1111/j.1528-1157.2000.tb01573.x. Epilepsia. 2000. PMID: 10999536
-
CA3-driven hippocampal-entorhinal loop controls rather than sustains in vitro limbic seizures.J Neurosci. 1997 Dec 1;17(23):9308-14. doi: 10.1523/JNEUROSCI.17-23-09308.1997. J Neurosci. 1997. PMID: 9364076 Free PMC article.
-
Do interictal discharges promote or control seizures? Experimental evidence from an in vitro model of epileptiform discharge.Epilepsia. 2001;42 Suppl 3:2-4. doi: 10.1046/j.1528-1157.2001.042suppl.3002.x. Epilepsia. 2001. PMID: 11520313 Review.
-
Network and pharmacological mechanisms leading to epileptiform synchronization in the limbic system in vitro.Prog Neurobiol. 2002 Oct;68(3):167-207. doi: 10.1016/s0301-0082(02)00077-1. Prog Neurobiol. 2002. PMID: 12450487 Review.
Cited by
-
Specificity, Versatility, and Continual Development: The Power of Optogenetics for Epilepsy Research.Front Cell Neurosci. 2018 Jun 14;12:151. doi: 10.3389/fncel.2018.00151. eCollection 2018. Front Cell Neurosci. 2018. PMID: 29962936 Free PMC article. Review.
-
Hippocampal low-frequency stimulation prevents seizure generation in a mouse model of mesial temporal lobe epilepsy.Elife. 2020 Dec 22;9:e54518. doi: 10.7554/eLife.54518. Elife. 2020. PMID: 33349333 Free PMC article.
-
The Gate and the Source? The Dentate Gyrus Takes Central Stage in Temporal Lobe Epilepsy.Epilepsy Curr. 2017 Jan-Feb;17(1):48-49. doi: 10.5698/1535-7511-17.1.48. Epilepsy Curr. 2017. PMID: 28331472 Free PMC article. No abstract available.
-
BAD and KATP channels regulate neuron excitability and epileptiform activity.Elife. 2018 Jan 25;7:e32721. doi: 10.7554/eLife.32721. Elife. 2018. PMID: 29368690 Free PMC article.
-
Potent Anti-seizure Effects of Locked Nucleic Acid Antagomirs Targeting miR-134 in Multiple Mouse and Rat Models of Epilepsy.Mol Ther Nucleic Acids. 2017 Mar 17;6:45-56. doi: 10.1016/j.omtn.2016.11.002. Epub 2016 Dec 10. Mol Ther Nucleic Acids. 2017. PMID: 28325299 Free PMC article.
References
MeSH terms
LinkOut - more resources
Full Text Sources
Other Literature Sources
Medical
