. 2016 Aug:70:123-35.
doi: 10.1016/j.ultras.2016.04.022. Epub 2016 Apr 27.

Adaptive windowing in contrast-enhanced intravascular ultrasound imaging

Affiliations

Adaptive windowing in contrast-enhanced intravascular ultrasound imaging

Brooks D Lindsey et al. Ultrasonics. 2016 Aug.

Abstract

Intravascular ultrasound (IVUS) is one of the most commonly-used interventional imaging techniques and has seen recent innovations which attempt to characterize the risk posed by atherosclerotic plaques. One such development is the use of microbubble contrast agents to image vasa vasorum, fine vessels which supply oxygen and nutrients to the walls of coronary arteries and typically have diameters less than 200μm. The degree of vasa vasorum neovascularization within plaques is positively correlated with plaque vulnerability. Having recently presented a prototype dual-frequency transducer for contrast agent-specific intravascular imaging, here we describe signal processing approaches based on minimum variance (MV) beamforming and the phase coherence factor (PCF) for improving the spatial resolution and contrast-to-tissue ratio (CTR) in IVUS imaging. These approaches are examined through simulations, phantom studies, ex vivo studies in porcine arteries, and in vivo studies in chicken embryos. In phantom studies, PCF processing improved CTR by a mean of 4.2dB, while combined MV and PCF processing improved spatial resolution by 41.7%. Improvements of 2.2dB in CTR and 37.2% in resolution were observed in vivo. Applying these processing strategies can enhance image quality in conventional B-mode IVUS or in contrast-enhanced IVUS, where signal-to-noise ratio is relatively low and resolution is at a premium.

Keywords: Adaptive beamforming; Contrast-enhanced ultrasound; High frequency ultrasound; Intravascular ultrasound; Phase coherence factor; Superharmonic.


Figures

Figure 1
Figure 1
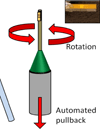
Diagram of dual-frequency mechanically-steered transducer and (inset)) photograph of prototype transducer used in this study. The lighter central region is the receive element, which is positioned in front of longer transmit element. The total length of the transmit element is 3 mm.
Figure 2
Figure 2
Contours of PSFs at −6 dB, −10 dB, and −20 dB are shown for processing with no summation, summation with a rectangular window, MV window, rectangular window and PCF, and MV window and PCF, all with 15 dB of SNR at 0.5 cm depth. Each PSF is normalized to its own peak. −6 dB beam areas (bottom right) are given for each PSF. The central of 7 acquisitions occurs at 0°.
Figure 3
Figure 3
Example image simulated using Field II with a single point target at a depth of 5 mm (SNR=15 dB). All images are displayed on the same scale with a dynamic range of 40 dB. Entire simulated image with conventional processing (region of interest indicated by the white box) and magnified views of the point target with (B) conventional processing (no summation), (C) Summation with a rectangular window, (D) Summation with a minimum variance window, (E) Summation with a rectangular window and application of the phase coherence factor, and (F) Summation with a minimum variance window and application of the phase coherence factor.
Figure 4
Figure 4
Simulated lateral resolution as a function of SNR for 4 different values of PCF tuning parameter γ. (A) γ = 0.25, (B) γ = 0.50, (C) γ = 0.75, and (D) γ =1.0. Lateral resolution is determined by measuring the lateral extent of a sub-resolution point target as in Figure 1. The theoretical diffraction-limited resolution λz/D = 535 µm at f0 = 28 MHz, z = 5 mm, D = 0.5 mm. Each point represents 50 simulations.
Figure 5
Figure 5
Simulated image contrast as a function of SNR for 4 different values of PCF tuning parameter γ. (A) γ = 0.25, (B) γ = 0.50, (C) γ = 0.75, and (D) γ =1.0. Contrast is determined by applying Equation 11 within a region containing a known target and at a second region at an equivalent depth.
Figure 6
Figure 6
Illustrative slices through the center of the tissue-mimicking phantom (A) with three parallel tubes filled with microbubble contrast agent at distances of (1) 7.1 mm, (2) 4.5 mm, and (3) 4.1 mm. (B) Full image view (no summation) indicating the region of interest, and magnified views of the center tube with (C) no summation, (D) summation with a rectangular window, (E) MV window, (F) rectangular window with PCF, and (G) MV window with PCF.
Figure 7
Figure 7
(A) Mean vessel diameter in a tissue mimicking phantom (Figure 6) as a function of processing type across all slices in the acquired 3D phantom pullback. Improvements in resolution due to application of MV, PCF, and MV+PCF weighting are statistically significant relative to the rectangular window case (p<0.01 in all cases). (B) Contrast-to-tissue ratio as a function of processing type across all slices in the acquired 3D phantom pullback.
Figure 8
Figure 8
In vivo slices through vessels of the chorioallantoic membrane in a 15-day-old chicken embryo with (A) no summation, (B) rectangular window, (C) minimum variance window, (D) rectangular window and phase coherence factor, and (E) minimum variance window and phase coherence factor. Scale bar indicates 1 mm.
Figure 9
Figure 9
Cross-section views of ex vivo porcine arteries (grayscale) and an adjacent tube filled with microbubble contrast agent (red) positioned outside of the vessel to mimic vasa vasorum. Scale bar indicates 1 mm.
Figure 10
Figure 10
3D renderings of imaging data acquired via motorized pullback in a porcine artery with a tube filled with microbubble contrast agent positioned outside of the vessel to mimic vasa vasorum.

References

    1. World Health Organization. Fact sheet no. 310: The top 10 causes of death. 2014 May; 2014.
    1. Mintz GS, Nissen SE, Anderson WD, Bailey SR, Erbel R, Fitzgerald PJ, et al. American College of Cardiology Clinical Expert Consensus Document on Standards for Acquisition, Measurement and Reporting of Intravascular Ultrasound Studies (IVUS). A report of the American College of Cardiology Task Force on Clinical Expert Consensus Documents. J Am Coll Cardiol. 2001 Apr;37:1478–1492. - PubMed
    1. Maehara A, Mintz GS, Weissman NJ. Advances in intravascular imaging. Circ Cardiovasc Interv. 2009 Oct;2:482–490. - PubMed
    1. Falk E. Why Do Plaques Rupture. Circulation. 1992 Dec;86:30–42. - PubMed
    1. Finn AV, Nakano M, Narula J, Kolodgie FD, Virmani R. Concept of vulnerable/unstable plaque. Arterioscler Thromb Vasc Biol. 2010 Jul;30:1282–1292. - PubMed

Publication types