. 2016 Jun;91(6):755-62.
doi: 10.1016/j.mayocp.2016.04.002. Epub 2016 May 6.

Sex Differences in Cardiorespiratory Fitness and All-Cause Mortality: The Henry Ford ExercIse Testing (FIT) Project

Affiliations

Sex Differences in Cardiorespiratory Fitness and All-Cause Mortality: The Henry Ford ExercIse Testing (FIT) Project

Mouaz H Al-Mallah et al. Mayo Clin Proc. 2016 Jun.

Abstract

Objective: To determine whether sex modifies the relationship between fitness and mortality.

Patients and methods: We included 57,284 patients without coronary artery disease or heart failure who completed a routine treadmill exercise test between 1991 and 2009. We determined metabolic equivalent tasks (METs) and linked patient records with mortality data via the Social Security Death Index. Multivariable Cox regression was used to determine the association between sex, fitness, and all-cause mortality.

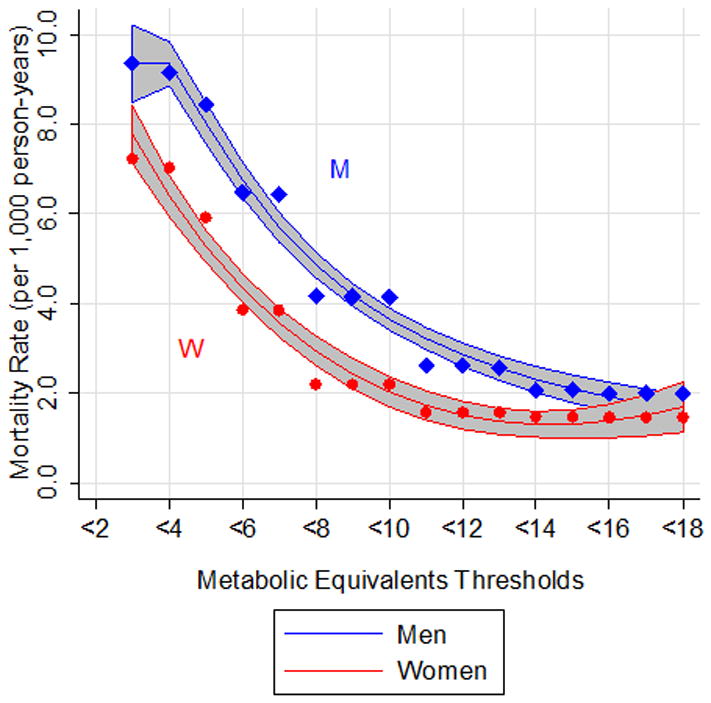
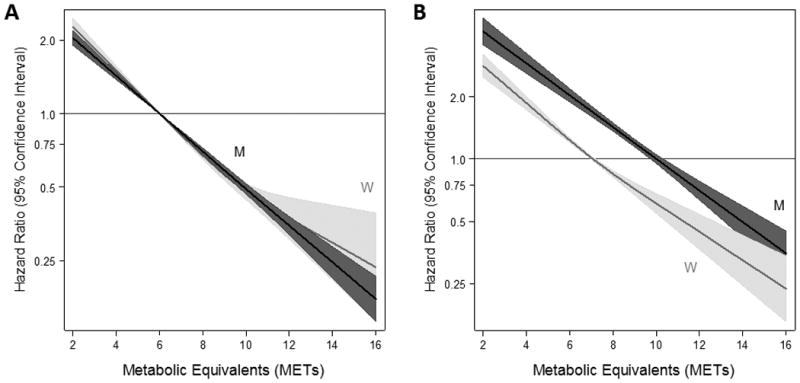
Results: There were 29,470 men (51.4%) and 27,814 women (48.6%) with mean ages of 53 and 54 years, respectively. Overall, men achieved 1.7 METs higher than women (P<.001). During median follow-up of 10 years, there were 6402 deaths. The mortality rate for men in each MET group was similar to that for women, who achieved an average of 2.6 METs lower (P=.004). Fitness was inversely associated with mortality in both men (hazard ratio [HR], 0.84 per 1 MET; 95% CI, 0.83-0.85) and women (HR, 0.83 per 1 MET; 95% CI, 0.81-0.84). This relationship did not plateau at high or low MET values.

Conclusion: Although men demonstrated 1.7 METs higher than women, their survival was equivalent to that of women demonstrating 2.6 METs lower. Furthermore, higher MET values were associated with lower mortality for both men and women across the range of MET values. These findings are useful for tailoring prognostic information and lifestyle guidance to men and women undergoing stress testing.


Conflict of interest statement

Disclosures: The authors declare that there is no conflict of interest associated with this manuscript.

Figures

Figure 1
Figure 1
Mortality rate per 1,000 person-years corresponding to metabolic equivalent (METs) thresholds (i.e. achieving a METs value < each number between 3 and 18) The time axis is age. Fractional polynomials are used to fit a curve for both men (blue) and women (red). Gray shade represents 95% confidence interval. Points represent mortality rate (per 1,000 person-years) at each threshold (circles for women; diamonds for men).
Figure 2
Figure 2
Adjusted hazard ratios (solid line) from restricted cubic spline models for mortality stratified by men (M) and women (W) using categories of metabolic equivalents (METs). Men are depicted in black; women are depicted in gray. Shading and dashed lines are the 95% confidence intervals. The models were expressed in the following fashion: (A) relative the median values for men and women (10 for men, 7 for women) with three knots based on the population distribution (5, 7, 10 for women; 5, 10, 13 for men); and (B) relative to a METs value of 6 with knots specified at values of 6, 10, and 12. Models were adjusted for age, race, resting systolic blood pressure, resting diastolic blood pressure, history of hypertension, history of diabetes, history of hyperlipidemia, history of obesity, family history of coronary heart disease, current smoking status, beta blocker medication use, lipid-lowering medication use, pulmonary medication use, depression medication use, and indication for stress testing. The hazard ratios are shown on a natural log scale.

References

    1. Sui X, LaMonte MJ, Laditka JN, et al. Cardiorespiratory fitness and adiposity as mortality predictors in older adults. JAMA. 2007;298(21):2507–2516. doi: 10.1001/jama.298.21.2507. - DOI - PMC - PubMed
    1. Shiroma EJ, Lee IM. Physical activity and cardiovascular health: lessons learned from epidemiological studies across age, gender, and race/ethnicity. Circulation. 2010;122(7):743–752. doi: 10.1161/CIRCULATIONAHA.109.914721. - DOI - PubMed
    1. Bouchard C, An P, Rice T, et al. Familial aggregation of VO(2max) response to exercise training: results from the HERITAGE Family Study. J Appl Physiol. 1999;87(3):1003–1008. - PubMed
    1. Wang CY, Haskell WL, Farrell SW, et al. Cardiorespiratory fitness levels among US adults 20-49 years of age: findings from the 1999-2004 National Health and Nutrition Examination Survey. Am J Epidemiol. 2010;171(4):426–435. doi: 10.1093/aje/kwp412. - DOI - PubMed
    1. Weltman A, Weltman JY, Hartman ML, et al. Relationship between age, percentage body fat, fitness, and 24-hour growth hormone release in healthy young adults: effects of gender. J Clin Endocrinol Metab. 1994;78(3):543–548. doi: 10.1210/jcem.78.3.8126124. - DOI - PubMed

Publication types

MeSH terms