. 2016 May 10:7:11298.
doi: 10.1038/ncomms11298.

Myelinating satellite oligodendrocytes are integrated in a glial syncytium constraining neuronal high-frequency activity

Affiliations

Myelinating satellite oligodendrocytes are integrated in a glial syncytium constraining neuronal high-frequency activity

Arne Battefeld et al. Nat Commun. .

Abstract

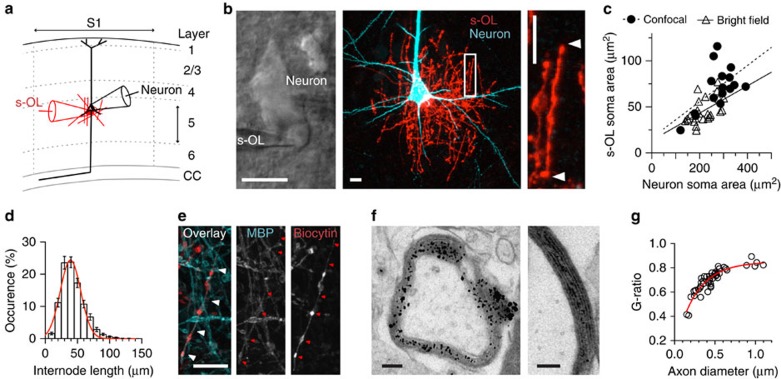
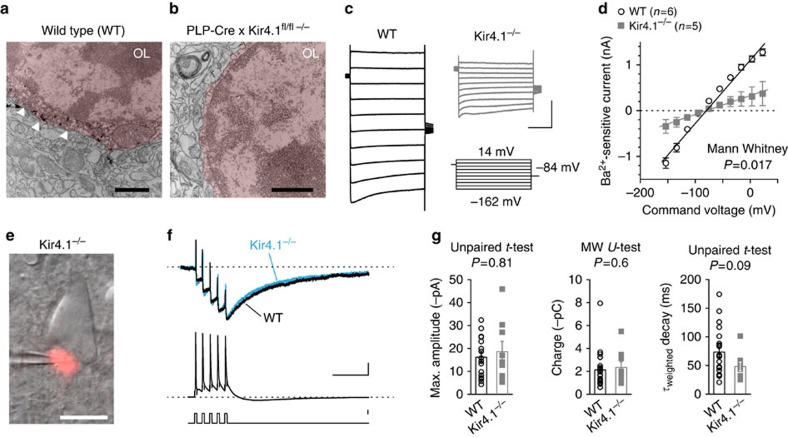
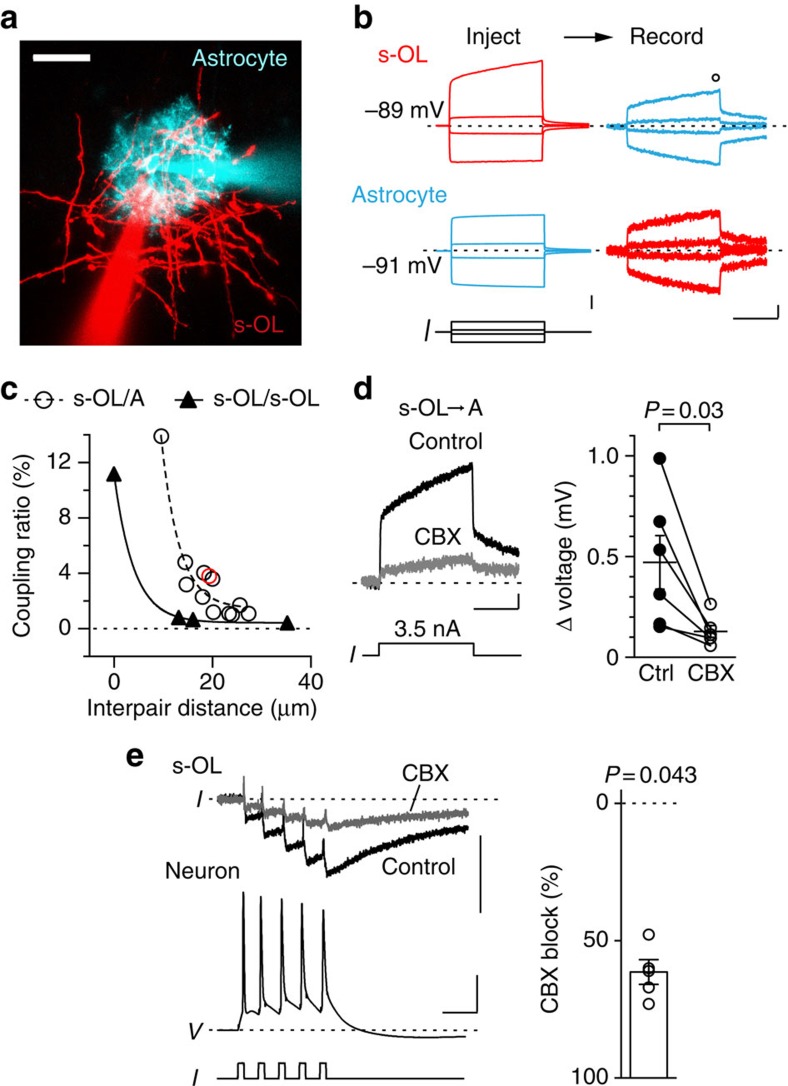
Satellite oligodendrocytes (s-OLs) are closely apposed to the soma of neocortical layer 5 pyramidal neurons but their properties and functional roles remain unresolved. Here we show that s-OLs form compact myelin and action potentials of the host neuron evoke precisely timed Ba(2+)-sensitive K(+) inward rectifying (Kir) currents in the s-OL. Unexpectedly, the glial K(+) inward current does not require oligodendrocytic Kir4.1. Action potential-evoked Kir currents are in part mediated by gap-junction coupling with neighbouring OLs and astrocytes that form a syncytium around the pyramidal cell body. Computational modelling predicts that glial Kir constrains the perisomatic [K(+)]o increase most importantly during high-frequency action potentials. Consistent with these predictions neurons with s-OLs showed a reduced probability for action potential burst firing during [K(+)]o elevations. These data suggest that s-OLs are integrated into a glial syncytium for the millisecond rapid K(+) uptake limiting activity-dependent [K(+)]o increase in the perisomatic neuron domain.


Figures

Figure 1
Figure 1. Identification and distribution of s-OLs around pyramidal neurons.
(a) Overview image of oligodendrocytes in the somatosensory neocortex labelled for ECFP in the transgenic PLP-ECFP mouse. Scale bar, 150 μm. (b) Left: s-OL (red pseudo-colour) in a PLP-ECFP mouse neocortex exhibits positive immuno-gold labelling in the cell body. The host neuron is pseudocoloured in light green and nuclei are labelled with N. Scale bar, 3 μm. Right: higher magnification image of the box indicated in the left image, which shows a distinct and confined location of gold particle-labelled ECFP in the cell body (black dots). Scale bar, 200 nm. (c) Confocal image of labelled OLs in a PLP-ECFP mouse and two biocytin-filled L5 neurons and corresponding orthogonal views. The s-OL cell body is in direct contact with the neuronal soma. Processes of OLs are not visible because laser intensity was reduced to a minimum. Scale bar, 10 μm. Also, see Supplementary Movie 1. (d) Heatmap illustrating the location probability of 145 s-OLs in relation to the soma of an example L5 neuron (grey). s-OLs were positioned at multiple locations around the soma, but the highest percentages were found around the base of neurons close to the AIS and the basal dendrites. See also Supplementary Fig. 1.
Figure 2
Figure 2. Experimental targeting of s-OLs reveals compact myelin and wrapping of surrounding axons.
(a) Illustration of the experimental approach. s-OL (red) and layer 5 neuron (black) targeted with patch-clamp pipettes in mouse primary somatosensory neocortex. (b) Left: Bright-field image of a neuron–s-OL pair. Patch pipettes are visible. Middle, right: Confocal maximum z-projected image of a neuron–s-OL pair after intracellular loading with Alexa 488 (neuron) and Alexa 594 (s-OL) dyes. The white box is displayed at higher magnification on the right. White arrows indicate one internode. All scale bars, 10 μm. See Supplementary Movie 2. (c) Correlation of soma size between neurons and s-OLs as estimated from two separate data sets. Closed circles display data from maximum z-projected live-confocal scans and open triangles are measurements from bright-field images. Both data sets were fit by linear regressions (confocal scans: n=16, correlation coefficient r2=0.33, P=0.02; bright field: n=24, r2=0.29, P=0.007). (d) Distribution histogram of s-OL internode length measured from confocal live image z-stacks (n=32 cells). The data were fit by a Gaussian function (red line, y=24.36*e(−0.5*((x-39.30)/15.93)2)). Data presented are mean±s.e.m. (e) A s-OL was filled with biocytin and Alexa 594 during recordings and subsequently post hoc labelled for myelin basic protein (MBP). Internodal structures are positively co-labelled by MBP and biocytin (red and white arrowheads). Scale bar, 10 μm. (f) Left: electron microscopy image of an identified horseradish peroxidase (HRP)-filled transversal cut s-OL process shows multiple layers of myelin wrapped around an axon. Gold particles are visible as black dots in the outer tongue and all myelin layers, suggesting a direct cytoplasmic connection with the cell body. Right: a putatively different axon at higher magnification shows about seven gold-labelled compact myelin wraps. See also Supplementary Fig. 2. Scale bars, 100 nm. (g) The g-ratio measured from single identified s-OL axons (n=45) plotted as function of the axon diameter. s-OLs myelinate axons of variable diameter. The data were fitted with an exponential equation (y=−0.723 × e (−0.0038 × x)+0.85).
Figure 3
Figure 3. Action potentials evoke time-locked inward currents in s-OLs.
(a) Confocal z-projected image of dual-whole-cell recording from L5 neuron–s-OL pair in the somatosensory neocortex. Scale bar, 20 μm. (b) The dV/dt of the AP aligns with the fast current transient in the s-OL, reflecting the capacitive charge of the s-OL membrane during the rising phase of the AP. In current clamp, the s-OL membrane voltage change is slow (dV/dt) compared with the neuronal AP. Note the dV/dt is from a different recording and filtered for display. The other traces are from the same cell as in c and d. Scale bars, (top to bottom) 10 pA, 1 V s−1, 30 mV (middle), 100 V s−1 and 0.1 ms. (c) AP repolarization temporally aligns with a rapid inward current in the s-OL. Average of 35 trials; scale bars, 5 pA, 30 mV, 500 μs and 0.7 nA. Capacitive current transient clipped for clarity. (d) The single AP evoked a rapid inward current in the s-OL (red trace, top) that decayed slowly (held at –91 mV; black fit, τ1=78 ms, τ2=451 ms). Traces displayed are the average of 25 trials. Scale bars, 2 pA, 30 mV, 50 ms and 1 nA. (e) Five APs evoked at 100 Hz potentiated the inward current amplitude in the s-OL (clamped to –88 mV, upper red trace). In current clamp (lower trace), the s-OL was depolarized by ∼500 μV. Traces are average of 26 trials. Scale bars, 10 pA, 500 μV, 30 mV and 50 ms, respectively. (f) Illustration of the targeted activation of layer 5 neurons by ChR2 while simultaneously recording from s-OL–neuron pairs. (g) Single light-evoked neuronal AP led to a capacitive transient (clipped) in the s-OL, followed by an inward current that activated during AP repolarization similar to electrical evoked AP. Scale bars, 2 pA, 30 mV and 0.5 ms. (h) The synchronised network activation of layer 5 neurons by ChR2 led to a large AP evoked inward current in a simultaneous recorded single s-OL. Scale bars, 20 pA (top), and 30 mV and 0.2 s (bottom).
Figure 4
Figure 4. Inward currents are glial specific and Ba2+ sensitive.
(a) Left: Z-projected confocal images of paired neuron–astrocyte and neuron–interneuron recordings. Scale bars, 20 μm. Right: traces from paired recordings show that astrocytes in satellite position show similar inward currents as s-OLs, but interneurons exhibit no inward currents; capacitive transients are still visible. The electrophysiology traces do not correspond to the image shown on the left. Scale bars, 10 pA (top and middle) and 30 mV, and 50 ms and 1 nA (bottom). (b) Summary data of the charge for five APs for s-OLs (n=22), oligodendrocytes not in satellite position (n=8), astrocytes (n=5) and interneurons (n=4) reveal that only glia in close proximity to the firing neuron exhibit a substantial inward current. Mann–Whitney test, P=0.0004 and P=0.129. Data are mean±s.e.m. (c) Left: extracellular application of 100 μM Ba2+ (orange) blocks the AP-induced inward current in s-OLs. Scale bars, 20 pA, 40 mV and 20 ms. (d) Population data of blocking experiments. Neither glutamatergic (50 μM D-AP5, n=3; 20 μM CNQX, n=2) nor GABAergic receptor blockers (5 μM gabazine, n=3; 50 μM CGP-35348, n=2) affected the inward current (for all Wilcoxon signed-rank test, P>0.18). In contrast, 100 μM Ba2+ led to an ∼80% reduction of the s-OL inward current (Wilcoxon signed-rank test, n=5, P=0.043). Data shown are mean±s.e.m.
Figure 5
Figure 5. Oligodendrocytic Kir4.1 does not contribute to AP-evoked inward currents in s-OLs.
(a,b) Electron microscopy images of WT and Kir4.1−/− tissue immuno-gold labelled with an antibody against Kir4.1. In the WT tissue, gold particles are present (white arrowheads) at the soma that were absent in the Kir4.1−/− OLs. Scale bars, 1 μm. (c) Ba2+-sensitive currents from WT (black) and Kir4.1−/− (grey) s-OLs evoked by the displayed voltage steps. Scale bars, 0.5 nA and 0.1 s. (d) Summary of the experiments in c shown in an IV curve. Kir4.1−/− s-OLs have a reduced Ba2+-sensitive conductance. Data are mean±s.e.m. (e) Combined bright-field and tdTomato fluorescence example image of a Kir4.1−/− s-OL–neuron pair in layer 5. Scale bar, 10 μm. (f) Recording of the Kir4.1−/− s-OL–neuron pair shown in e overlaid with a recording from a WT experiment and the inward current evoked by five APs. s-OL currents were normalized to the maximum amplitude. Scale bars, 30 mV, 50 ms and 1 nA. (g) Summary data of the maximum amplitude, charge and weighted decay time constant reveal no differences of the action potential-evoked inward current properties between wild-type and Kir4.1−/− s-OLs. Data are mean±s.e.m.
Figure 6
Figure 6. s-OLs are gap–junction coupled to other s-OLs and astrocytes.
(a) Confocal z-projected image of a s-OL and astrocyte. Scale bar, 30 μm. (b) Gap–junction coupling between s-OL and astrocytes was estimated by bidirectional current injections into s-OLs or adjacent astrocytes and simultaneous recordings of the response in the corresponding cell. Traces are averages of 10 trials from pair in a. Open circle indicate the measurement region at the end of the pulse. Scale bars, (inject) 5 mV, (record) 200 μV and 50 ms, respectively. (c) Summary plot of the coupling ratio in the steady state as a function of the distance between recorded s-OL/astrocyte (n=12) and s-OL/s-OL (n=4) pairs. The open red circle indicates the experiment shown in a and b. Data were fitted by single exponential equations: s-OL/astrocyte: y=165.2 × e(−0.27 × x)+1.46 (dotted line); s-OL/s-OL: y=10.76 × e(−0.249 × x)+0.435 (black line). (d) Left: the gap–junction blocker carbenoxolone (CBX) reduced the cross gap–junctional current between s-OLs and astrocytes compared with control conditions. Scale bars, 0.1 mV and 50 ms. Right: summary data showing the inhibition of the gap–junction-mediated current (n=6, Wilcoxon signed-rank test, P=0.03). Data are mean±s.e.m. (e) Left: CBX reduced the AP-mediated inward current between neuron–s-OL pairs by 60%. Scale bars, 20 pA, 40 mV and 20 ms. Right: summary plot showing the reduction of the inward current in s-OLs in the presence of CBX in response to five APs (n=5). Data are mean±s.e.m.
Figure 7
Figure 7. Glial Kir constraints high-frequency-dependent [K+]o elevations.
(a) Sketch of experimental [K+]o application. (b) Left: average current responses to puffs of various [K+]o at a constant holding voltage of −84 mV. Scale bars, 0.1 nA and 0.2 s. Right: Summary plot for all experiments fitted by a linear equation y=−19.2x+61.6 (1 mM: n=5; 3 mM: n=6; 10 mM: n=4; 30 mM: n=9). Dotted line indicates estimated [K+]o from experimental data of five APs. Data presented as mean±s.e.m. (c) Response to local puff application of 30 mM [K+]o and inhibition by 100 μM CBX. Scale bars, 0.1 nA and 0.2 s. Summary bar graphs for the total charge of the inward current during 30 mM [K+]o and percentage of block after application of carbenoxolone (n=2). Data shown as mean±s.e.m. (d) Computer simulations of changes in [K+]o at the soma evoked by a single AP, as a function of the intercellular distance (δ) between glia and neuron. Scale bar, 1 ms. (e) Summary plot of [K+]o change in relation to the intercellular distances between neuron and glia to determine the modelling parameter (δ=110 nm). (f) Simulated Kir reduction can generate additional APs. Top to bottom: the Kir current in the glial compartment, extracellular [K+]o, neuronal EK and neuronal membrane potential for high (black) and low (red) conductance densities of Kir. Reducing Kir increases the K+ reversal potential. Scale bars, (top to bottom) 20 μA cm−2, 2 mM, 5 mV, 100 ms and 20 mV. Inset: the onset of additional APs triggered by impaired Kir (red) shows the reduced fast AP afterhyperpolarization. Scale bars, 5 mV and 5 ms. (g) Input–output function of AP number within the high-frequency cluster versus current injection. Impact of glial Kir reduction only becomes apparent when APs occur at high frequencies (>∼170 Hz) with no impact on low-frequency AP generation (see Supplementary Fig. 6). (h) The positive feedback on AP firing by impaired Kir (closed dots) uptake becomes prominent in narrow interstitial spacing <100 nm (fixed current injection of 58 pA).
Figure 8
Figure 8. s-OLs limit high-frequency firing probability.
(a) Maximum z-projected images of targeted L5 neurons (cyan) and surrounding oligodendrocytes (red). White arrowhead indicates s-OL. Scale bar, 20 μm. See also Supplementary Fig. 7a. (b) Distances of oligodendrocytes from the centre of neurons with or without s-OLs show differences in their spatial distances. (c) Left: trains of APs elicited by current injection steps for neurons with and without s-OL. Scale bars, 30 mV and 0.1 s. Top right: high temporal resolution of the first high-frequency AP cluster generated by L5 neurons with or without s-OL. Scale bar, 10 mV and 5 ms. Bottom right: summary data of the average APs per cluster for neurons with (n=6) and without s-OL (n=10, Mann–Whitney test, P=0.02). Data are mean±s.e.m. (d) Summary FI plot of neurons with and without s-OL that generated high-frequency cluster APs. Differences in the average firing rate were observed at 250 pA (two-way ANOVA, P=0.0038). Data are mean±s.e.m. See also Supplementary Fig. 7b. (e) Left: APs evoked by steady-current injections from neurons with and without s-OL at normal extracellular K+ for selected regular firing neurons. Right: after increasing [K+]o to 8 mM neurons depolarized and fired more APs with the same current injection. Arrowheads indicate cluster APs. Scale bar, 30 mV and 0.1 s. (f) Increased timescale of the traces in d in the presence of 8 mM [K+]o shows more clustered APs in neurons without a s-OL. Scale bars, 30 mV and 25 ms. (g) Summary plot of the sum of cluster APs for neurons with and without s-OL indicate that the largest difference is observed for current steps between 200 and 300 pA (two-way ANOVA, P=0.0001, n=7 cells per group). Data are mean±s.e.m. (h) Summary plot displaying burst probability for neurons with and without s-OL in 3 and 8 mM [K+]o. at a current step of 200 pA. Data are single paired experiments and mean±s.e.m. Interaction significance was assessed with a two-way ANOVA-repeated measures.

References

    1. Henneberger C., Papouin T., Oliet S. H. R. & Rusakov D. A. Long-term potentiation depends on release of D-serine from astrocytes. Nature 463, 232–236 (2010). - PMC - PubMed
    1. Min R. & Nevian T. Astrocyte signaling controls spike timing-dependent depression at neocortical synapses. Nat. Neurosci. 15, 746–753 (2012). - PubMed
    1. Chen J. et al.. Heterosynaptic long-term depression mediated by ATP released from astrocytes. Glia 61, 178–191 (2013). - PubMed
    1. Morquette P. et al.. An astrocyte-dependent mechanism for neuronal rhythmogenesis. Nat. Neurosci. 18, 844–854 (2015). - PubMed
    1. Tong X. et al.. Astrocyte Kir4.1 ion channel deficits contribute to neuronal dysfunction in Huntington's disease model mice. Nat. Neurosci. 17, 694–703 (2014). - PMC - PubMed

Publication types

MeSH terms

LinkOut - more resources