. 2016 May 9:17:99.
doi: 10.1186/s13059-016-0963-7.

A comprehensive survey of the mutagenic impact of common cancer cytotoxics

Affiliations

A comprehensive survey of the mutagenic impact of common cancer cytotoxics

Bernadett Szikriszt et al. Genome Biol. .

Abstract

Background: Genomic mutations caused by cytotoxic agents used in cancer chemotherapy may cause secondary malignancies as well as contribute to the evolution of treatment-resistant tumour cells. The stable diploid genome of the chicken DT40 lymphoblast cell line, an established DNA repair model system, is well suited to accurately assay genomic mutations.

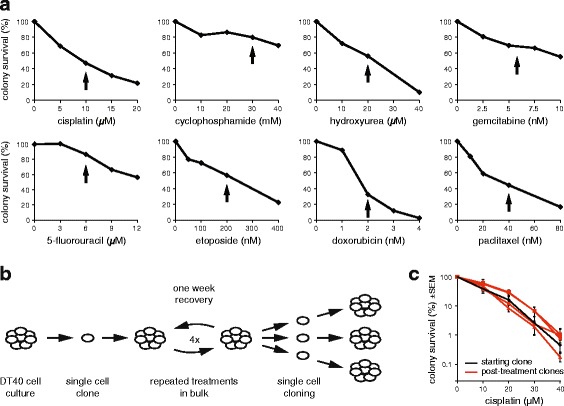
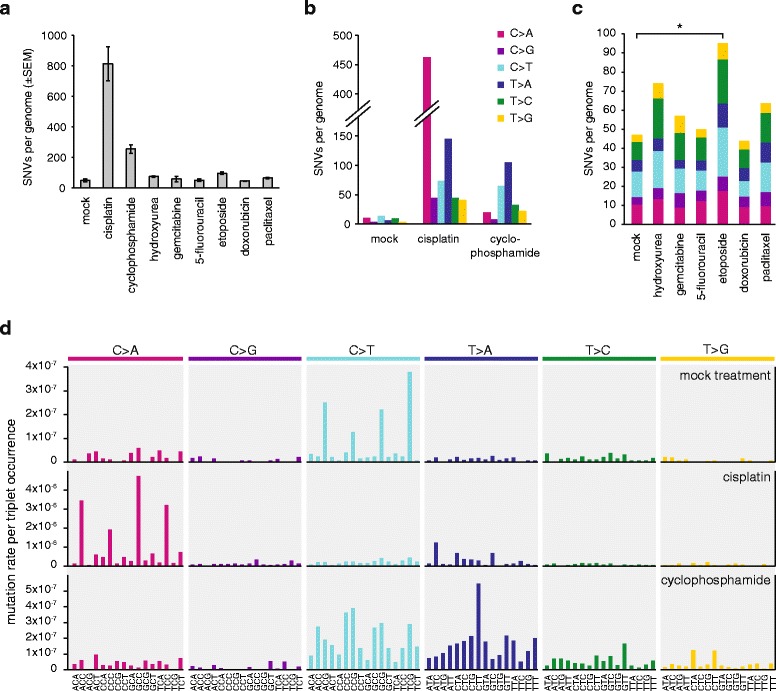
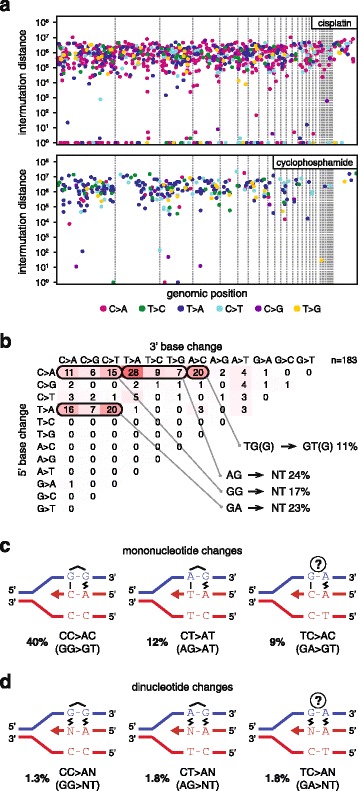
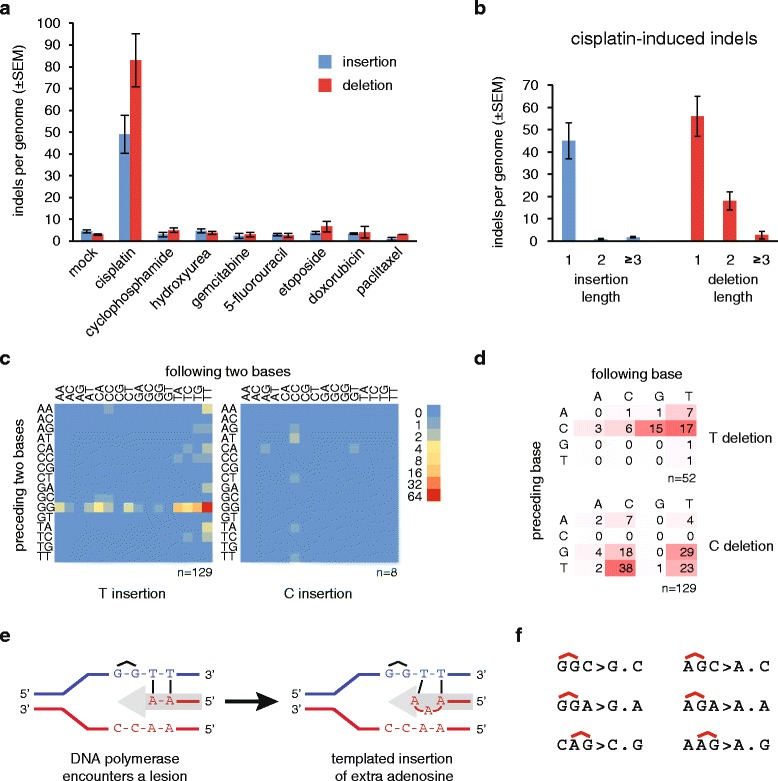
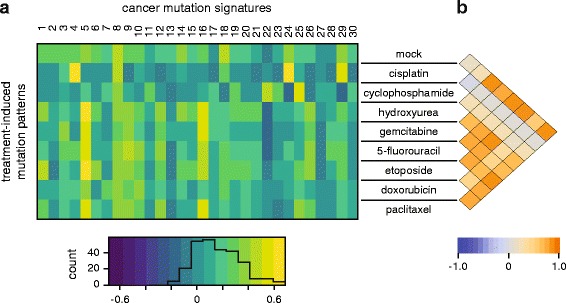
Results: We use whole genome sequencing of multiple DT40 clones to determine the mutagenic effect of eight common cytotoxics used for the treatment of millions of patients worldwide. We determine the spontaneous mutagenesis rate at 2.3 × 10(-10) per base per cell division and find that cisplatin, cyclophosphamide and etoposide induce extra base substitutions with distinct spectra. After four cycles of exposure, cisplatin induces 0.8 mutations per Mb, equivalent to the median mutational burden in common leukaemias. Cisplatin-induced mutations, including short insertions and deletions, are mainly located at sites of putative intrastrand crosslinks. We find two of the newly defined cisplatin-specific mutation types as causes of the reversion of BRCA2 mutations in emerging cisplatin-resistant tumours or cell clones. Gemcitabine, 5-fluorouracil, hydroxyurea, doxorubicin and paclitaxel have no measurable mutagenic effect. The cisplatin-induced mutation spectrum shows good correlation with cancer mutation signatures attributed to smoking and other sources of guanine-directed base damage.

Conclusion: This study provides support for the use of cell line mutagenesis assays to validate or predict the mutagenic effect of environmental and iatrogenic exposures. Our results suggest genetic reversion due to cisplatin-induced mutations as a distinct mechanism for developing resistance.

Keywords: BRCA2; Cancer chemotherapy; Chemotherapy resistance; Cisplatin; Cyclophosphamide; Cytotoxics; DT40; Etoposide; Mutagenesis; Spontaneous mutagenesis; Whole genome sequencing.


Figures

Fig. 1
Fig. 1
Cytotoxic treatments. a Colony survival assay of DT40 cells treated with the indicated cytotoxic drugs for 1 h (cisplatin, cyclophosphamide) or 24 h. The concentration chosen for mutagenesis assays are indicated with black arrows. b A schematic drawing of the mutagenesis assay. Genomic DNA was sequenced from the pre-treatment starting cell clone and three post-treatment cell clones. c Comparison of the cisplatin sensitivity of the starting clone (black) and clones isolated following four rounds of cisplatin treatment (red). Mean and SEM of three measurements is shown
Fig. 2
Fig. 2
Number and spectrum of treatment-induced SNVs. a The mean number of observed SNVs per genome following the described treatment regimen with the indicated drugs. Error bars indicate SEM. b Base substitution spectrum of mutations that arose from the mock treatment, as well as cisplatin and cyclophosphamide treatments. c The mean number of mutations per sample and base substitution spectrum of the indicated treatments. Significant differences from the mock treatment (p <0.05, Student’s t-test) are indicated with an asterisk. d Triplet mutation spectra of the mock, cisplatin and cyclophosphamide treatments. The middle base of each triplet, listed at the bottom, mutated as indicated at the top of the panel. The number of mutations of each type was normalised to the frequency of occurrence of that base triplet in the chicken genome, and the resulting mutation rates are shown
Fig. 3
Fig. 3
SNV mutation spacing, dinucleotide mutations and proposed mechanisms of mono- and dinucleotide mutations. a The distance of each SNV mutation from the previous SNV on the same chromosome is plotted against the genomic position of the mutation. Thin dashed lines indicate chromosome boundaries. Chromosomes are shown in numerical order; chromosome Z is shown last on the right. The colour of each dot illustrates the type of mutation according to the key at the bottom of the panel. Mutations with an intermutation distance of one are part of dinucleotide mutations. One sequenced clone of each is shown. b Sequence analysis of the 183 dinucleotide mutations detected following cisplatin treatment. The change in the 5’ base is shown in the rows, while the 3’ base in the columns. The equivalent mutations on the two strands are added together, e.g. GG > TT is shown as CC > AA. The most common mutation types are grouped together below the table and their sequences are indicated using the purine-rich strand to aid interpretation. c Schematic models for the replicative process that may generate each of the most common classes of cisplatin-induced mononucleotide (c) and dinucleotide (d) mutations. Putative intrastrand crosslinks are marked, the uncertain lesion at mutated GA sequences is indicated with a question mark. Non-canonical base pairing is shown with a zig-zag symbol. The contribution of each mutation class to the total number of observed SNVs is shown
Fig. 4
Fig. 4
Cisplatin-induced insertions and deletions. a The mean number of observed insertions (blue) and deletions (red) per genome following the described treatment regimen with the indicated drugs. Error bars indicate SEM. b Length distribution of cisplatin-induced insertions and deletions. c Heat map of the frequency of one-base insertions, classified according to the preceding and the following two bases as indicated. The inserted base is shown below each panel. The equivalent mutations on the two strands are added and shown as T or C insertions. d Table and heat map of the frequency of one-base deletions, classified according to the preceding and the following base as indicated. The equivalent mutations on the two strands are added and shown as T or C deletions, shown to the right. e A schematic model of the generation of the most common GGTT > GGTTT insertions during DNA replication. The incoming DNA polymerase (grey arrow) inserts adenosines opposite the thymine bases, then it inserts an extra adenosine upon encountering the cisplatin-induced GG intrastrand crosslink. f Sequence context of the most common one-base deletions shown on the purine rich strand, with the position of putative intrastrand crosslinks indicated above the sequence
Fig. 5
Fig. 5
Mutation density with respect to gene transcription. a The proportion of genomic regions classified as intergenic (green) or genic (red) based on Ensembl genome annotation, shown on the left, differs from the proportion of cisplatin or cyclophosphamide-induced SNVs found in the respective regions (middle and right columns). b The distribution of the expression level of all genes, based on RNA-Seq coverage data (green) is shown against the distribution of the expression level of genes containing cisplatin or cyclophosphamide-induced SNVs (red). Expression levels are shown as the log10 of FPKM values (fragments per kilobase of transcript per million of mapped reads). c Strand bias of genic mutations induced by cisplatin (left) or cyclophosphamide (right). Highly significant (p <0.001, χ2 test) differences between the non-transcribed and the transcribed strands are indicated with double asterisks
Fig. 6
Fig. 6
Correlation of drug-induced mutation patterns with mutation signatures identified in cancer. a Heat map of the Pearson correlation coefficient between triplet base mutation patterns induced by the cytotoxic treatment adjusted to human triplet frequencies (rows) and the 30 confirmed mutational signatures identified in human cancer [43]. The heat map key is shown at the bottom, with an overlaid histogram indicating the number of cells in each value range. b Heat map showing Pearson correlation coefficients between each pair of treatment-induced mutational patterns

References

    1. Choi DK, Helenowski I, Hijiya N. Secondary malignancies in pediatric cancer survivors: perspectives and review of the literature. Int J Cancer. 2014;135:1764–1773. doi: 10.1002/ijc.28991. - DOI - PubMed
    1. OECD Guidelines for the Testing of Chemicals, Section 4:Health Effects. OECD Publications. 2015. http://www.oecd-ilibrary.org/environment/oecd-guidelines-for-the-testing.... Accessed 12 Nov 2015
    1. Kang SH, Kwon JY, Lee JK, Seo YR. Recent advances in in vivo genotoxicity testing: prediction of carcinogenic potential using comet and micronucleus assay in animal models. J Cancer Prev. 2013;18:277–288. doi: 10.15430/JCP.2013.18.4.277. - DOI - PMC - PubMed
    1. Mortelmans K, Zeiger E. The Ames Salmonella/microsome mutagenicity assay. Mutat Res. 2000;455:29–60. doi: 10.1016/S0027-5107(00)00064-6. - DOI - PubMed
    1. Johnson GE. Mammalian cell HPRT gene mutation assay: test methods. Methods Mol Biol. 2012;817:55–67. doi: 10.1007/978-1-61779-421-6_4. - DOI - PubMed

Publication types