Case Reports
. 2017 Feb;91(2):865-883.
doi: 10.1007/s00204-016-1723-x. Epub 2016 May 9.

Model-based contextualization of in vitro toxicity data quantitatively predicts in vivo drug response in patients

Affiliations
Case Reports

Model-based contextualization of in vitro toxicity data quantitatively predicts in vivo drug response in patients

Christoph Thiel et al. Arch Toxicol. 2017 Feb.

Abstract

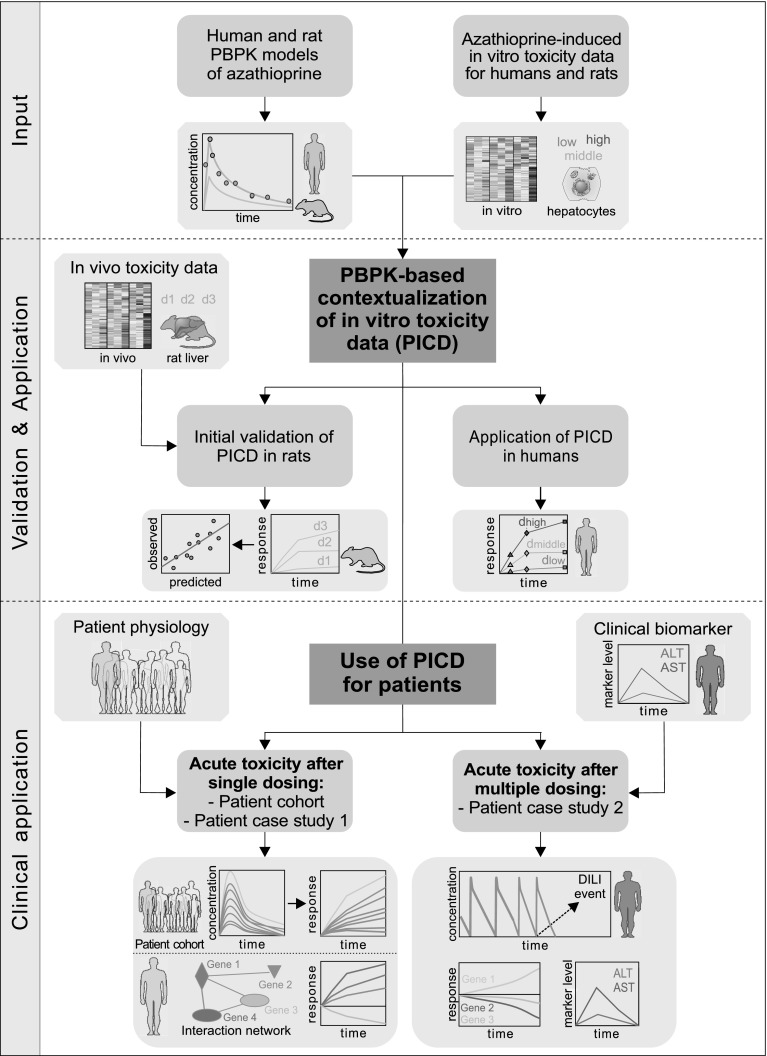
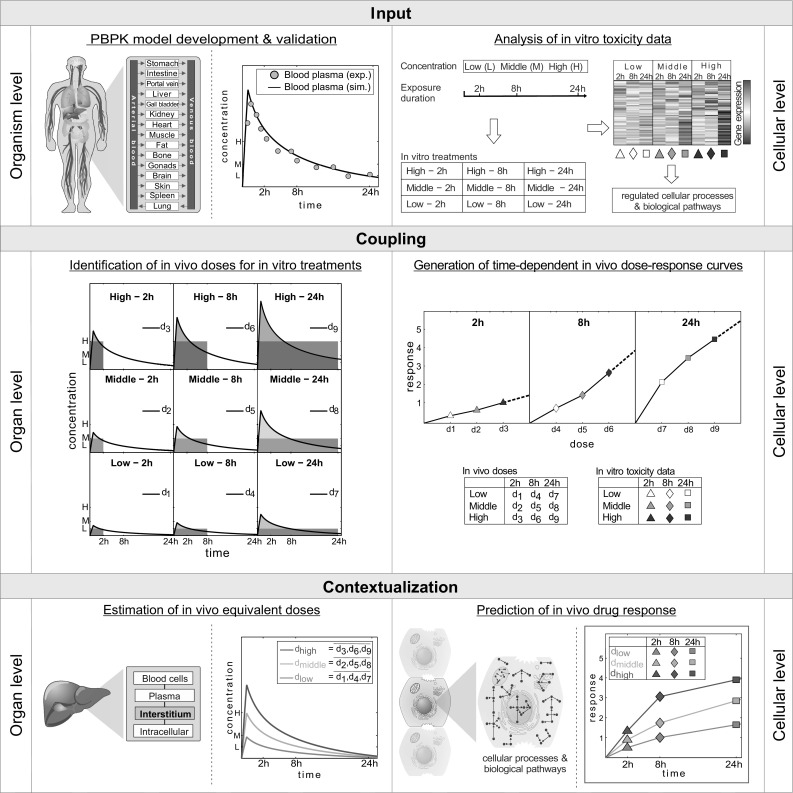
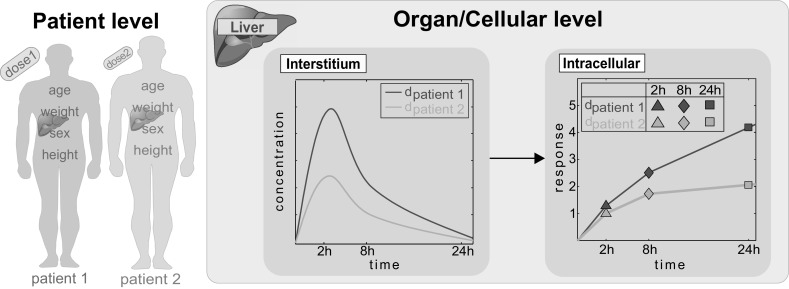
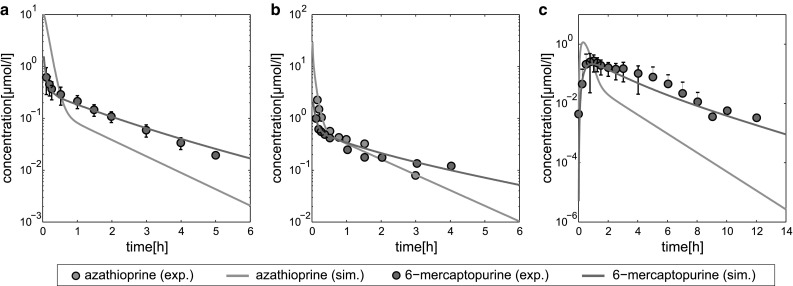
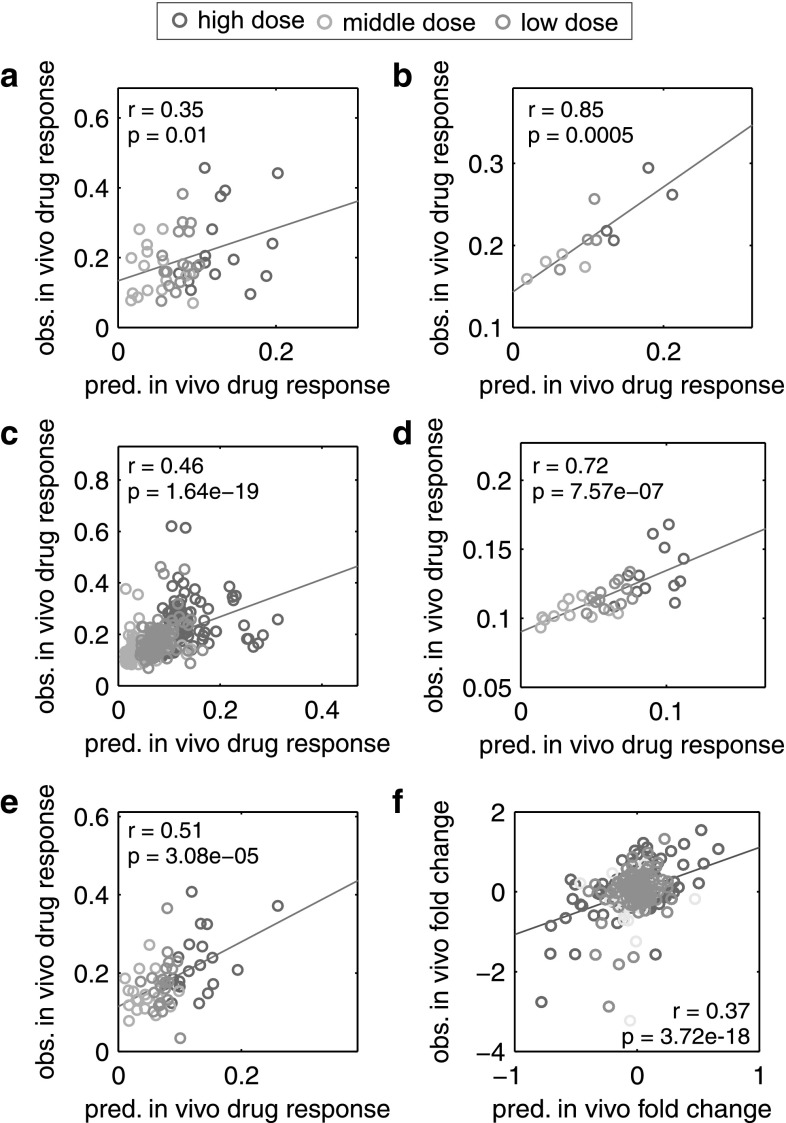
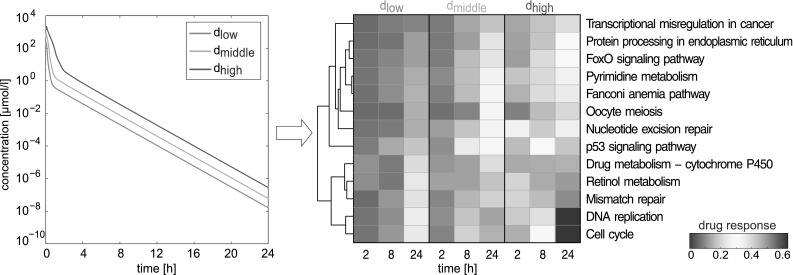
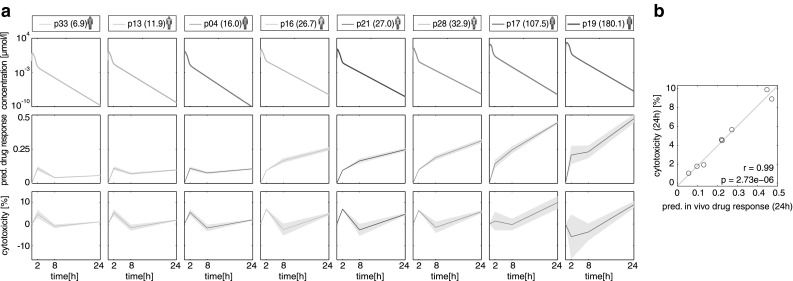
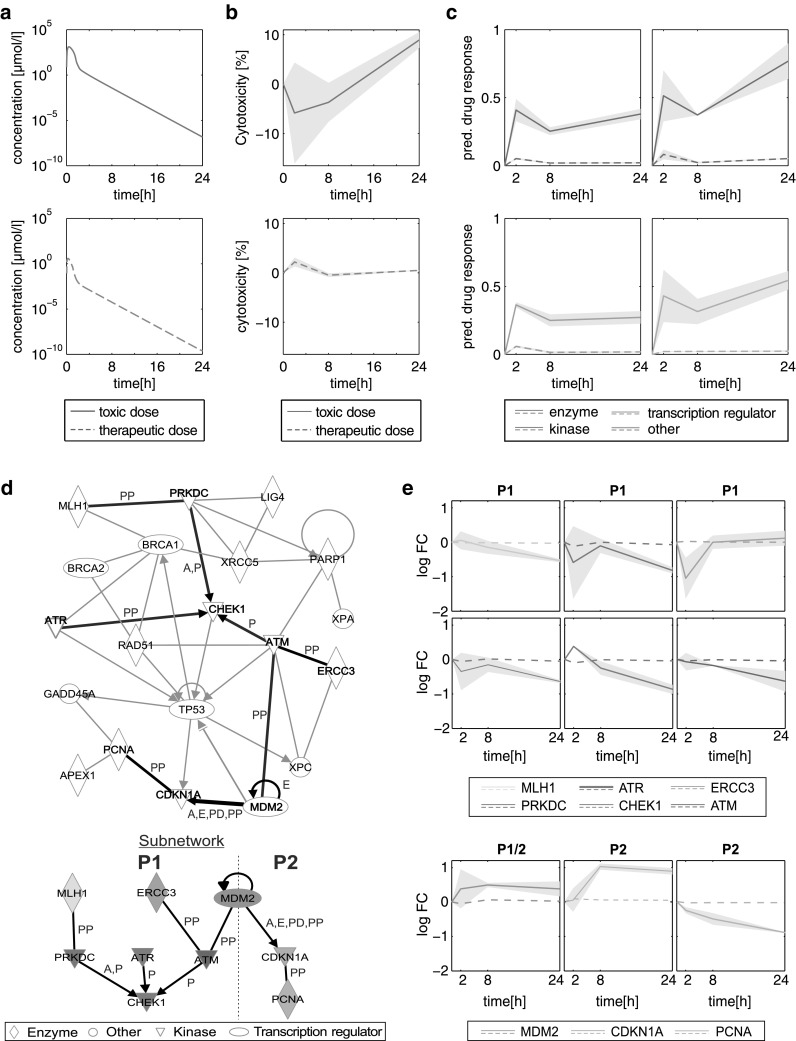
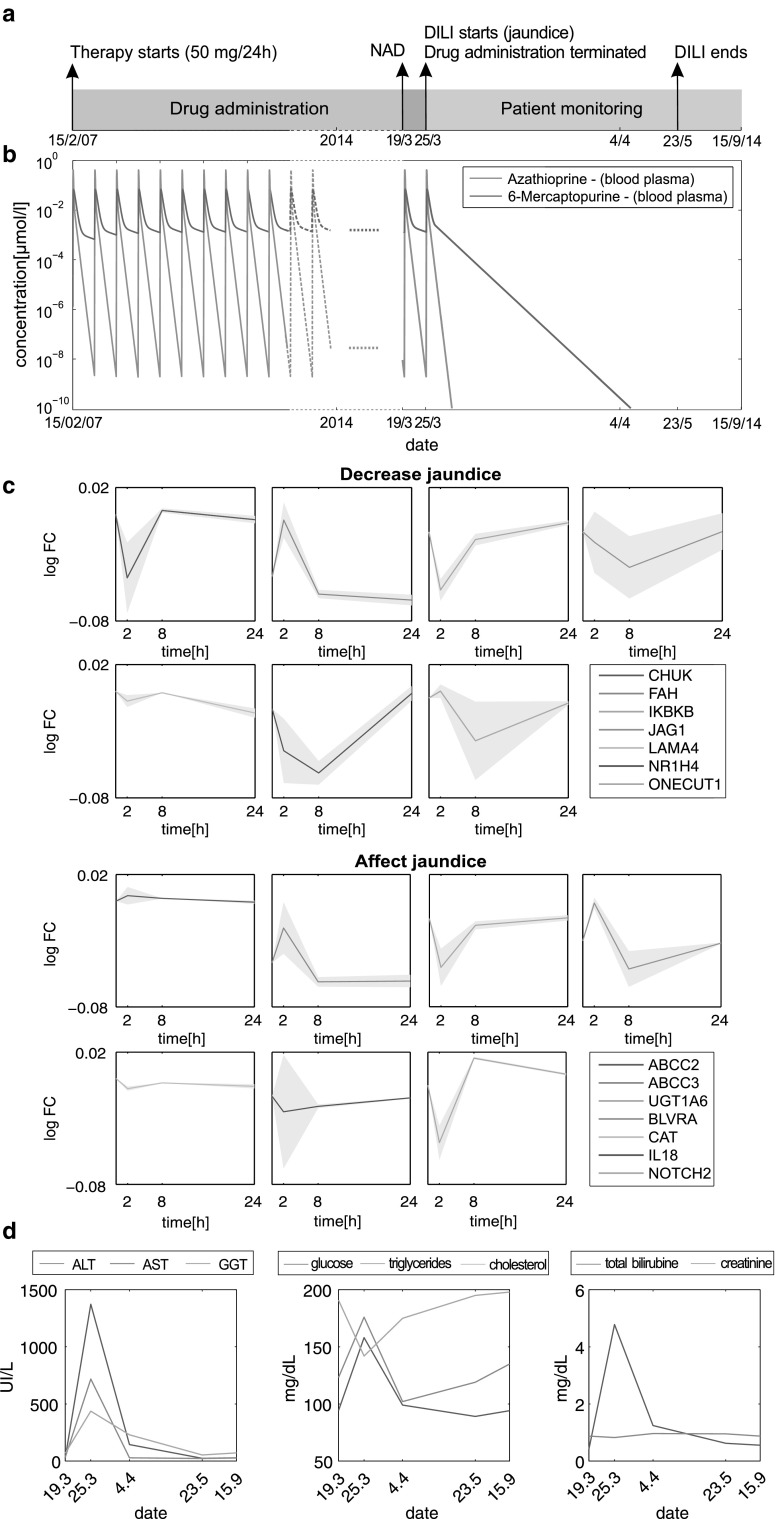
Understanding central mechanisms underlying drug-induced toxicity plays a crucial role in drug development and drug safety. However, a translation of cellular in vitro findings to an actual in vivo context remains challenging. Here, physiologically based pharmacokinetic (PBPK) modeling was used for in vivo contextualization of in vitro toxicity data (PICD) to quantitatively predict in vivo drug response over time by integrating multiple levels of biological organization. Explicitly, in vitro toxicity data at the cellular level were integrated into whole-body PBPK models at the organism level by coupling in vitro drug exposure with in vivo drug concentration-time profiles simulated in the extracellular environment within the organ. PICD was exemplarily applied on the hepatotoxicant azathioprine to quantitatively predict in vivo drug response of perturbed biological pathways and cellular processes in rats and humans. The predictive accuracy of PICD was assessed by comparing in vivo drug response predicted for rats with observed in vivo measurements. To demonstrate clinical applicability of PICD, in vivo drug responses of a critical toxicity-related pathway were predicted for eight patients following acute azathioprine overdoses. Moreover, acute liver failure after multiple dosing of azathioprine was investigated in a patient case study by use of own clinical data. Simulated pharmacokinetic profiles were therefore related to in vivo drug response predicted for genes associated with observed clinical symptoms and to clinical biomarkers measured in vivo. PICD provides a generic platform to investigate drug-induced toxicity at a patient level and thus may facilitate individualized risk assessment during drug development.

Keywords: Clinical translation; Drug-induced liver injury; Multiscale modeling; PBPK; Pharmacokinetic modeling; Quantitative systems pharmacology; Transcriptomics.


Conflict of interest statement

L. K. is employee of Bayer Technology Services GmbH, the company developing the PBPK modeling tools PK-Sim and MoBi.

Figures

Fig. 1
Fig. 1
Overview of the use of PICD. Input Human and rat PPBK models of azathioprine were developed and in vitro toxicity data of primary human and rat hepatocytes were analyzed (Igarashi et al. 2015). Validation and Application To validate PICD, in vivo toxicity data obtained in rat livers were used to compare predicted in vivo drug response with measurements observed in vivo. PICD was then applied in humans, thereby predicting drug response for in vivo doses estimated for concentrations used in vitro. Clinical application To demonstrate clinical applicability, PICD was applied on different clinical cases. At first, patient physiology of eight clinical cases was considered in individualized PBPK models to predict in vivo drug response induced by different azathioprine overdoses (Gregoriano et al. 2014). One patient was further regarded in a patient case study using own data, thereby predicting in vivo response of genes involved in critical processes of an interaction network. Moreover, acute toxicity after multiple dosing of azathioprine at therapeutic dose was investigated in a second patient case study. Therefore, drug concentrations simulated for the entire therapy process were related to in vivo response predicted for symptoms-related genes and to clinical biomarkers measured in the specific patient
Fig. 2
Fig. 2
Workflow of PICD. Input At the organism level, PBPK models are developed at the organism level whereby simulated (sim.) blood plasma concentrations are validated with experimental (exp.) PK data. At the cellular level, in vitro toxicity data of compound-treated primary hepatocytes are analyzed (Igarashi et al. 2015). The hepatocytes were exposed to three different concentrations (low, middle and high). Drug-treated hepatocytes were compared to their time-matched controls to determine the change in gene expression after 2, 8 and 24 h leading to a total of nine different treatments (whitegray-colored symbols). Functional enrichment analysis was then applied to find regulated cellular processes and biological pathways. Coupling In vivo doses d 1d 9 are identified for all treatments such that the in vivo exposure simulated in the interstitial space of the liver (colored area under the curve) matched the in vitro exposure (gray rectangular area). Identified in vivo doses d 1d 9 together with in vitro toxicity data (white–gray-colored symbols) are used to generate dose–response curves for all considered time points of the in vitro experiment. Contextualization In vivo doses d 1d 9 are averaged horizontally along the same in vitro concentration leading to three doses d low, d middle and d high (colored lines) representing the in vivo equivalents to exposed in vitro concentrations (low, middle, high). At the cellular level, in vivo drug response over time reflecting changes in cellular processes and biological pathways are then predicted (colored symbols) for the in vivo equivalent doses (colored lines) by using time-dependent in vivo dose–response curves (color figure online)
Fig. 3
Fig. 3
Use of PICD for patients. At the patient level, individualized PBPK models are developed by incorporating anthropometric parameters of patients (e.g., weight). PICD is then individually applied on each patient-specific PBPK model by taking into account the respective dosage regimen (administration route and dose level). Concentration–time profiles are therefore simulated in the interstitial space of the liver and correspondent in vivo drug response profiles are predicted at the cellular level following administration of the specific dose
Fig. 4
Fig. 4
PBPK model development and validation. Simulated concentration–time curves (lines) for azathioprine (blue) and 6-mercaptopurine (red) were assessed with experimental PK profiles (circles) (Van Os et al. 1996). The reference PBPK model was then validated by evaluating simulated PK profiles with experimental PK data from different clinical studies (Odlind et al. ; Zins et al. 1997) (Table S2) not used to establish the reference model. Azathioprine was either administered intravenously (IV) or orally (PO). a Reference, 50 mg IV. b Validation, 100 mg IV. c Validation, 100 mg PO (color figure online)
Fig. 5
Fig. 5
Correlation of predicted drug response profiles with in vivo measurements in rats. Correlation between predicted (pred.) in vivo profiles of drug response and gene expression with observed (obs.) profiles measured in vivo following oral administration of the three doses used in the rat study (low dose = yellow, middle dose = blue, high dose = red) (Igarashi et al. 2015). All cellular processes or biological pathways that were significantly regulated in at least one treatment (Data S1) and all genes analyzed in the case studies (Table S4, Table S5) were considered for the correlation of drug response and gene expression, respectively. Correlation analyses were performed by calculating Pearson’s correlation coefficient r and the corresponding p value p. a Correlation of affected KEGG pathways. b Correlation of affected toxicity-related pathways. c Correlation of affected biological processes. d Correlation of affected cellular components. e Correlation of affected molecular functions. f Correlation of genes considered in both case studies (color figure online)
Fig. 6
Fig. 6
Application of PICD on the hepatotoxicant azathioprine in humans. At the organ level, liver interstitial PK profiles were simulated for doses d low, d middle and d high (colored lines). At the cellular level, correspondent drug response profiles were predicted for significant affected human pathways from KEGG following in vivo drug administration of azathioprine. The color scale depicts predicted in vivo drug response (color figure online)
Fig. 7
Fig. 7
PICD applied on eight clinical cases of acute azathioprine overdose. a Simulated drug concentration–time profiles, corresponding predicted in vivo drug response of a critical toxicity-related pathway (DNA damage and repair), as well as predicted cytotoxicity for eight clinical cases following oral administration of different azathioprine overdoses (Table S3). In vivo drug responses and cytotoxicity were predicted for both replicates to represent the variability (gray area) (Igarashi et al. 2015). The mean drug responses are shown as solid lines. Colors of patients indicate the highest Poisoning Severity Score (PSS) (Persson et al. 1998) of the occurred symptoms [none (green) = 0, minor (yellow) = 1, moderate (red) = 2]. The overdoses (mg/kg) are shown in brackets. b Correlation results of predicted in vivo drug response of DNA damage and repair at 24 h with predicted cytotoxicity values. Correlation analysis was performed by calculating Pearson’s correlation coefficient r and the corresponding p value p (color figure online)
Fig. 8
Fig. 8
Acute liver toxicity after single dosing of azathioprine. a Concentration–time profiles simulated for patient 19 (Table S3) following oral administration of the toxic dose (solid red line) and the therapeutic dose (dashed blue line). b Cytotoxicity values over time predicted for the toxic dose (solid red line) and the therapeutic dose (dashed blue line). The Predictions were made for both replicates to represent the variability (gray area). The mean cytotoxicity is shown as solid line. c Predicted in vivo drug response induced by oral administration of the therapeutic dose (dashed colored lines) and the toxic dose (solid colored lines). In vivo drug responses were separated into different functional categories (enzyme, other, kinase and transcription regulator) (Table S4). The Predictions were made for both replicates to represent the variability (gray area). The mean drug responses are shown as solid lines. d Interaction network and processed subnetwork of genes involved in DNA damage and repair processes (Table S5). Since no expression data were available for CHEK2 and ERCC5, interactions between these genes and other were excluded. The subnetwork (thick black lines) was identified by considering only interactions between genes that were strongly regulated (absolute log2 fold change >0.5) in at least one time point. The interaction types (A activation, E expression, P phosphorylation, PD protein–DNA interaction, PP protein–protein interaction) were highlighted next to the specific edges. The interaction network was generated through the use of QIAGEN’s Ingenuity Pathway Analysis (IPA®, QIAGEN Redwood City, www.qiagen.com/ingenuity). e Predicted temporal expression patterns induced by the therapeutic and toxic dose were simulated for patient 19. Two critical processes (P1, P2) extracted from the subnetwork were considered separately (dashed line indicates separation). The first process (involved genes: MLH1, ERCC5, MDM2, PRKDC, ATR, ATM, CHEK1) resulted in the inhibition of CHEK1 that is required to initiate cell cycle arrest in response to DNA damage. The second process (involved genes: MDM2, CDKN1A, PCNA) induced the inhibition of PCNA leading to an impairment of DNA repair processes. The predictions were made for both replicates to represent the variability (gray area). The mean gene expressions are shown as solid lines (color figure online)
Fig. 9
Fig. 9
Acute liver failure after multiple dosing of azathioprine. a Therapy process. The 37-year-old male patient received 50 mg of azathioprine orally every day over a period of 7 years. Measurements of clinical biomarkers (e.g., ALT level) were started 1 week before DILI symptoms (jaundice) occurred. At that time, no abnormality was detected (NAD). Azathioprine treatment was terminated at the onset of liver toxicity. About 9 weeks later, jaundice disappeared. b Blood plasma concentrations of azathioprine (blue line) and 6-mercaptopurine (red line) were simulated for the whole therapy process following oral administration of 50 mg every 24 h. When DILI occurs, azathioprine treatment was terminated leading to a rapid clearance of both compounds within the body. c Expression levels of fifteen genes related to jaundice (Table S6) were exemplarily simulated over 1 day following single dosing of 50 mg of azathioprine to reflect the cellular effects at the transcriptional level induced by the permanent drug treatment (Table S6). The predictions were made for both replicates to represent the variability (gray area). d Eight different clinical biomarkers (total bilirubin, creatinine, glucose, cholesterol, triglycerides, ALT, AST and GGT) were measured at five different dates over a period of about 6 months. The first measurement was started about 1 week before DILI was observed in the specific patient (color figure online)

References

    1. Aberra FN, Lichtenstein GR. Review article: monitoring of immunomodulators in inflammatory bowel disease. Aliment Pharmacol Ther. 2005;21:307–319. doi: 10.1111/j.1365-2036.2005.02343.x. - DOI - PubMed
    1. Andrade RJ, Lucena MI, Fernández MC, et al. Drug-induced liver injury: an analysis of 461 incidences submitted to the Spanish registry over a 10-year period. Gastroenterology. 2005;129:512–521. doi: 10.1016/j.gastro.2005.05.006. - DOI - PubMed
    1. Ashburner M, Ball CA, Blake JA, et al. Gene ontology: tool for the unification of biology. The gene ontology consortium. Nat Genet. 2000;25:25–29. doi: 10.1038/75556. - DOI - PMC - PubMed
    1. Benjamini Y, Hochberg Y. Controlling the false discovery rate: A practical and powerful approach to multiple testing. J R Stat Soc Ser B. 1995;57:289–300.
    1. Bergan S, Rugstad HE, Bentdal O, et al. Kinetics of mercaptopurine and thioguanine nucleotides in renal transplant recipients during azathioprine treatment. Ther Drug Monit. 1994;16:13–20. doi: 10.1097/00007691-199402000-00002. - DOI - PubMed

Publication types

LinkOut - more resources