Comparative Study
. 2016 May 10:6:25687.
doi: 10.1038/srep25687.

A Stochastic Point Cloud Sampling Method for Multi-Template Protein Comparative Modeling

Affiliations
Comparative Study

A Stochastic Point Cloud Sampling Method for Multi-Template Protein Comparative Modeling

Jilong Li et al. Sci Rep. .

Abstract

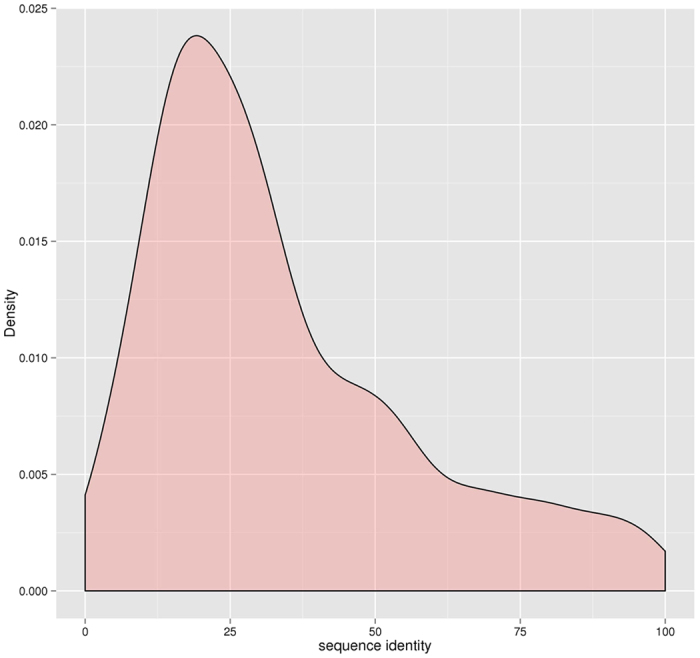
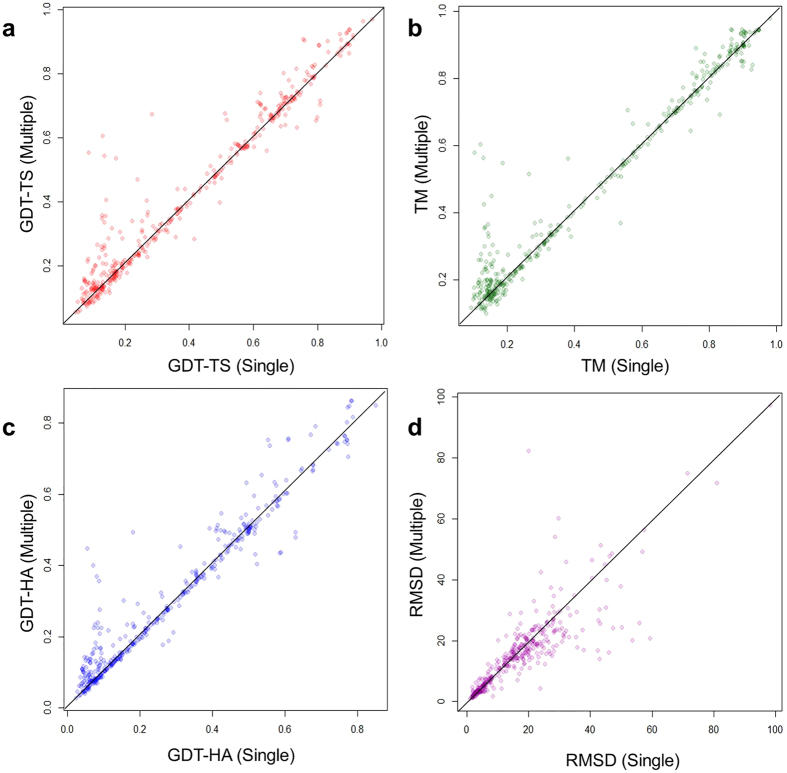
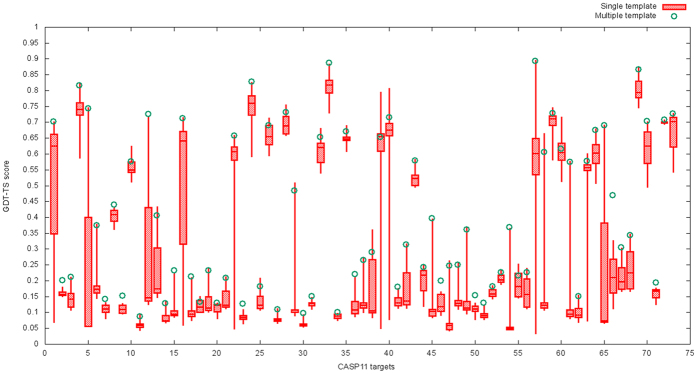
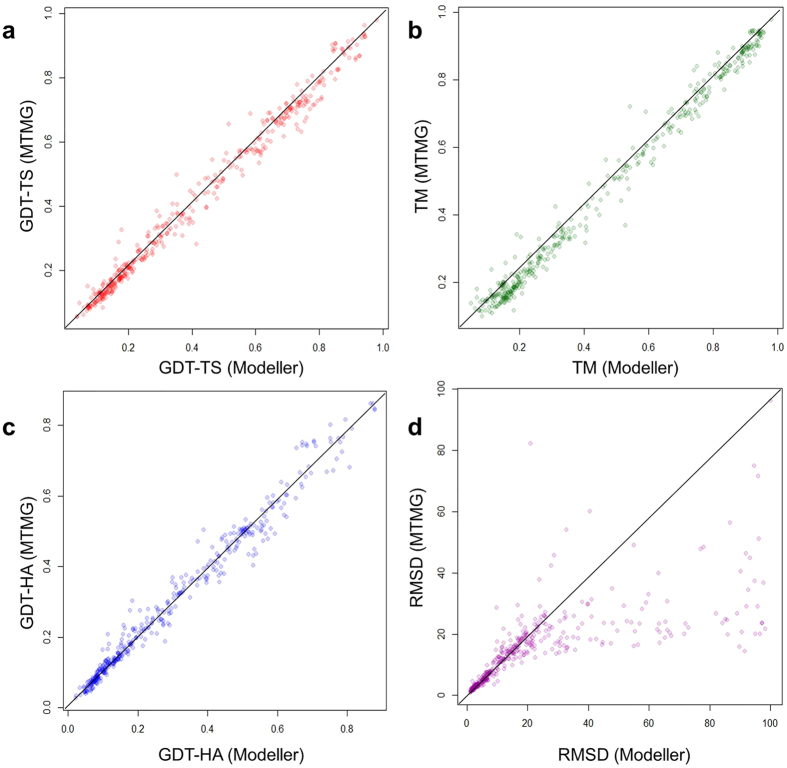
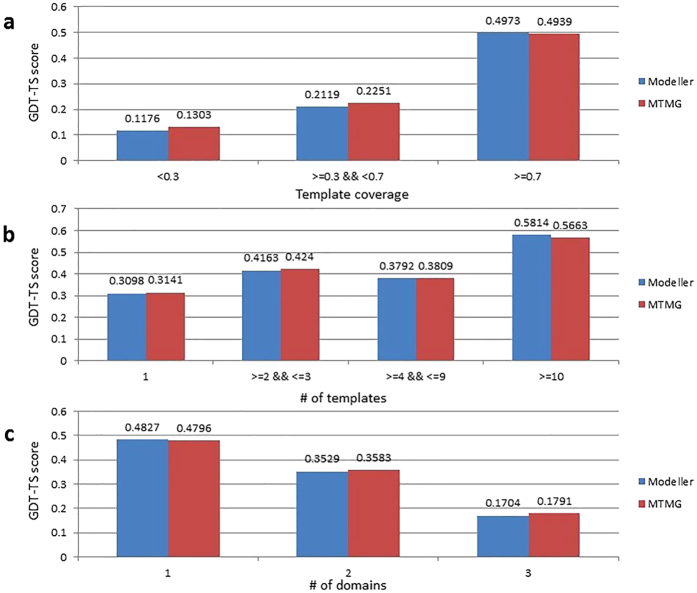
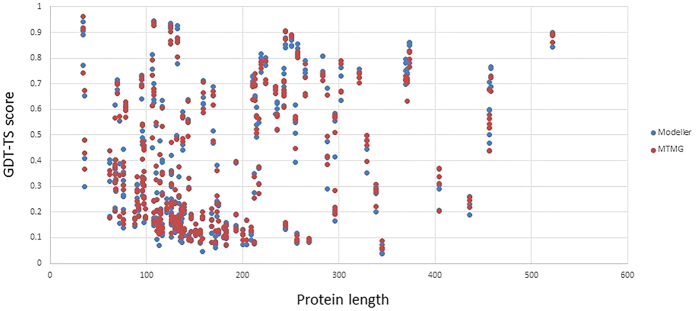
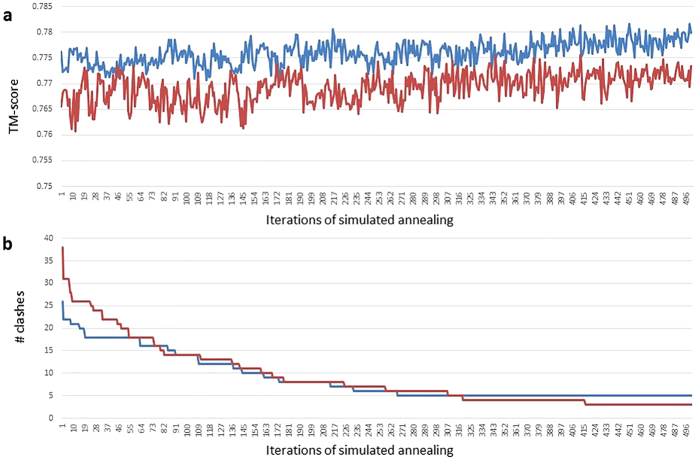
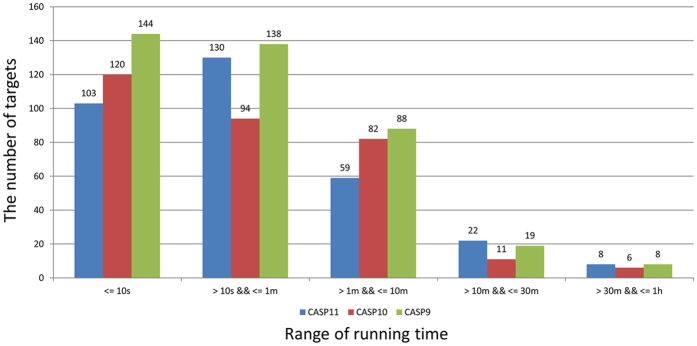
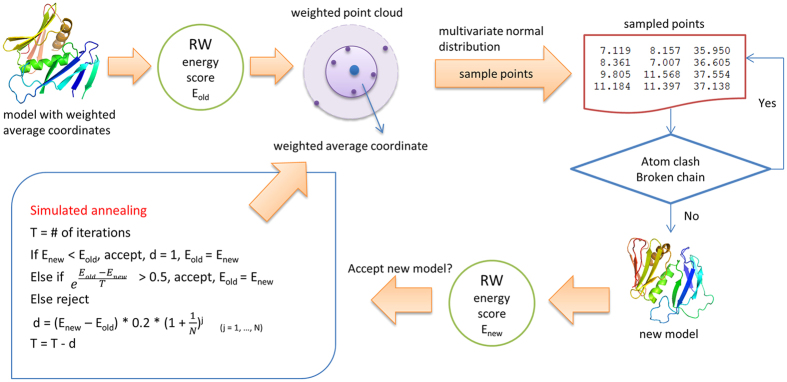
Generating tertiary structural models for a target protein from the known structure of its homologous template proteins and their pairwise sequence alignment is a key step in protein comparative modeling. Here, we developed a new stochastic point cloud sampling method, called MTMG, for multi-template protein model generation. The method first superposes the backbones of template structures, and the Cα atoms of the superposed templates form a point cloud for each position of a target protein, which are represented by a three-dimensional multivariate normal distribution. MTMG stochastically resamples the positions for Cα atoms of the residues whose positions are uncertain from the distribution, and accepts or rejects new position according to a simulated annealing protocol, which effectively removes atomic clashes commonly encountered in multi-template comparative modeling. We benchmarked MTMG on 1,033 sequence alignments generated for CASP9, CASP10 and CASP11 targets, respectively. Using multiple templates with MTMG improves the GDT-TS score and TM-score of structural models by 2.96-6.37% and 2.42-5.19% on the three datasets over using single templates. MTMG's performance was comparable to Modeller in terms of GDT-TS score, TM-score, and GDT-HA score, while the average RMSD was improved by a new sampling approach. The MTMG software is freely available at: http://sysbio.rnet.missouri.edu/multicom_toolbox/mtmg.html.


Figures

Figure 1
Figure 1. The distribution of sequence identity in the sequence alignments.
Figure 2
Figure 2. The improvements or losses of GDT-TS score, TM-score, GDT-HA score and RMSD of the models predicted by MTMG using the first single templates and multiple templates on individual CASP11 targets.
The scores of multi-template models are plotted against single-template models. X-axis represents the scores of single-template models and Y-axis represents the scores of multi-template models.
Figure 3
Figure 3. The boxplot of GDT-TS scores of the models predicted by MTMG for each of 73 CASP11 domains using each single template and multiple templates.
The box plot denotes the maximum, 75% quartile, mean, 25% quartile, and minimum score of the models constructed from each single template for a target. The small green circle denotes the score of the model constructed from multiple templates.
Figure 4
Figure 4. The scatter plot of GDT-TS scores, TM-scores, GDT-HA scores and RMSDs of the models predicted by MTMG against those of Modeller on CASP11 targets.
The scores of Modeller models are plotted against MTMG models. X-axis represents the scores of Modeller models and Y-axis represents the scores of MTMG models.
Figure 5
Figure 5. Comparison of GDT-TS score between the MTMG models and the Modeller models from three aspects on CASP11 targets.
(a) MTMG performed better than Modeller on targets with <0.7 template coverage. (b) MTMG performs better than Modeller on targets covered by <10 templates. (c) MTMG performs better than Modeller on targets containing multiple domains.
Figure 6
Figure 6. The GDT-TS scores of MTMG and Modeller models on different protein lengths.
Red points donate GDT-TS scores of MTMG models, and blue points donate GDT-TS scores of Modeller models.
Figure 7
Figure 7
Changes of TM-score (a) and the number of atom clashes (b) of the models for two CASP11 targets during the simulated annealing. TM-score stochastically went up and down with an overall upward trend during simulated annealing. Even though the final model was not the best one, but it was close to the best one and better than the initial model. Moreover, the number of clashes rather consistently decreased during simulated annealing.
Figure 8
Figure 8
Three examples illustrating (a) the successful template weighting and combination, (b) the successful template superposition, and (c) the successful domain division and combination of our method. The models predicted by Modeller (gold) and MTMG (purple) were superposed with the native structure (blue).
Figure 9
Figure 9. The number of targets in different ranges of running time on CASP9, CASP10, and CASP11 targets.
92.83% of targets were modeled by MTMG within 10 minutes, and all the targets were modeled in an hour in the experiment.
Figure 10
Figure 10. The workflow of the stochastic point cloud method for sampling conformations.
Starting from an initial model comprised of the weighted average coordinates of template structures, its RW energy is calculated as Eold, weighted point clouds are constructed for unfixed residues whose conformations are uncertain. New positions are sampled for unfixed residues from the multivariate normal distribution representing the point clouds, the positions with few or no atom clashes or broken chain are accepted to generate a new model. The new model is accepted based on the difference between its energy Enew and the old energy Eold according to a simulated annealing protocol, and the accepted model is used as the initial model for the next round of modeling, which is repeated until reaching a fixed number of iterations.
Figure 11
Figure 11. Checking the validity of sampled points.
The Euclidean distance of the backbone atom Cα is calculated between the sampled point of the ith residue and each of other residues. The sampled point is accepted if it satisfies the spatial restraints without broken chains (i.e. too far away from adjacent atoms: dij > 4.5 Å) and atom clashes (too close to other atoms: dik < 3.5 Å).
Figure 12
Figure 12. Domain division.
(a) A target protein covered (aligned with) five templates is divided into two domains because the two regions do not share any common templates. (b) Template combination. The template T1 with the highest template weight is selected first. T2 is selected because the TM-score between T1 and T2 is >0.7. T3 is chosen because it covers at least 10 continuous uncovered target residues. (c) Template superposition. T1 is the center template. T2, T3, and T4 are superposed with T1 because they share common residues with T1. T5 does not share common residues with T1, so it is superposed with T4. (d) Sampling points for gaps. The radius of the outside circle is 4.5 Å, and the radius of the inner circle is 3.5 Å. The sampling algorithm randomly samples point between the two circles. In the region circled by red, the gap is at the N-terminal. The distance d1 between an accepted sampled point and the first covered residue is between 3.5 Å and 4.5 Å. In the region circled by blue, the three-residue gap is in the middle, and the distance between the two ends of the gap (dAB) is 8.2 Å. The distance d2 between an accepted sampled point and the last covered residue before the gap is between 3.5 Å and 4.5 Å. The distance d3 between an accepted sampled point and the first covered residue after the gap is between 4.1 Å and 11.4 Å.

Similar articles

Cited by

References

    1. Eisenhaber F., Persson B. & Argos P. Protein structure prediction: recognition of primary, secondary, and tertiary structural features from amino acid sequence. Crit. Rev. Biochem. Mol. Biol. 30, 1–94 (1995). - PubMed
    1. Rost B. Protein structure prediction in 1D, 2D, and 3D. The Encyclopaedia of Computational Chemistry 3, 2242–2255 (1998).
    1. Floudas C. Computational methods in protein structure prediction. Biotechnol. Bioeng. 97, 207–213 (2007). - PubMed
    1. Lundström J., Rychlewski L., Bujnicki J. & Elofsson A. Pcons: a neural-network-based consensus predictor that improves fold recognition. Protein Sci. 10, 2354–2362 (2001). - PMC - PubMed
    1. Wallner B., Fang H. & Elofsson A. Automatic consensus-based fold recognition using Pcons, ProQ, and Pmodeller. Proteins: Struct. Funct. Bioinform. 53, 534–541 (2003). - PubMed

Publication types

LinkOut - more resources