. 2016 May 10:7:11479.
doi: 10.1038/ncomms11479.

The somatic mutation profiles of 2,433 breast cancers refines their genomic and transcriptomic landscapes

Affiliations

The somatic mutation profiles of 2,433 breast cancers refines their genomic and transcriptomic landscapes

Bernard Pereira et al. Nat Commun. .

Abstract

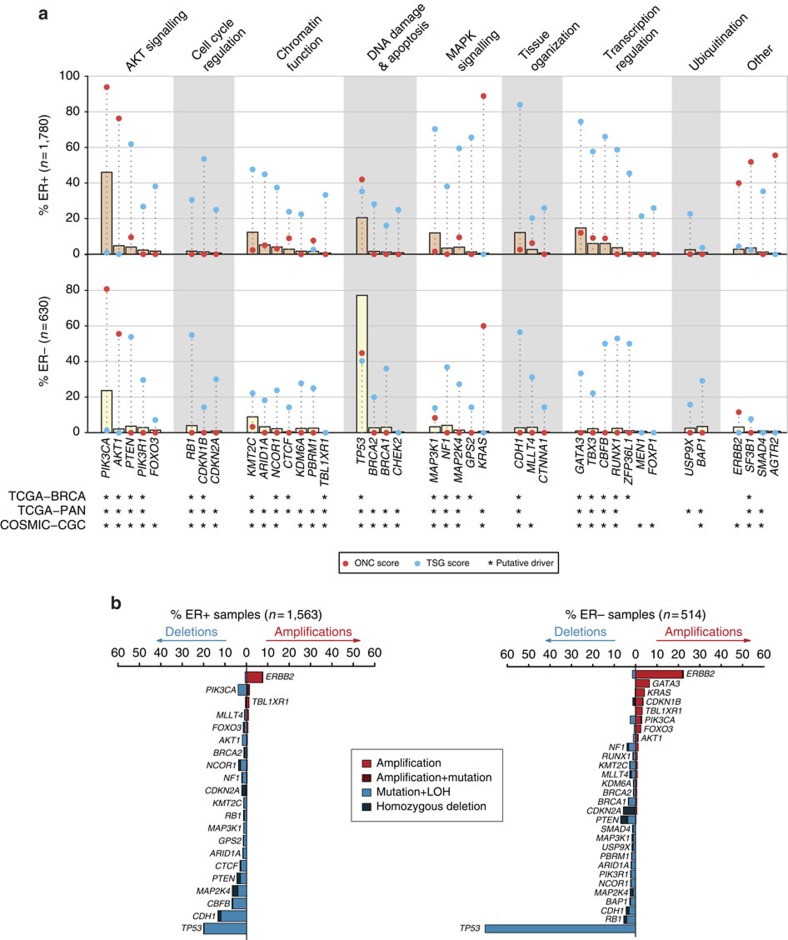
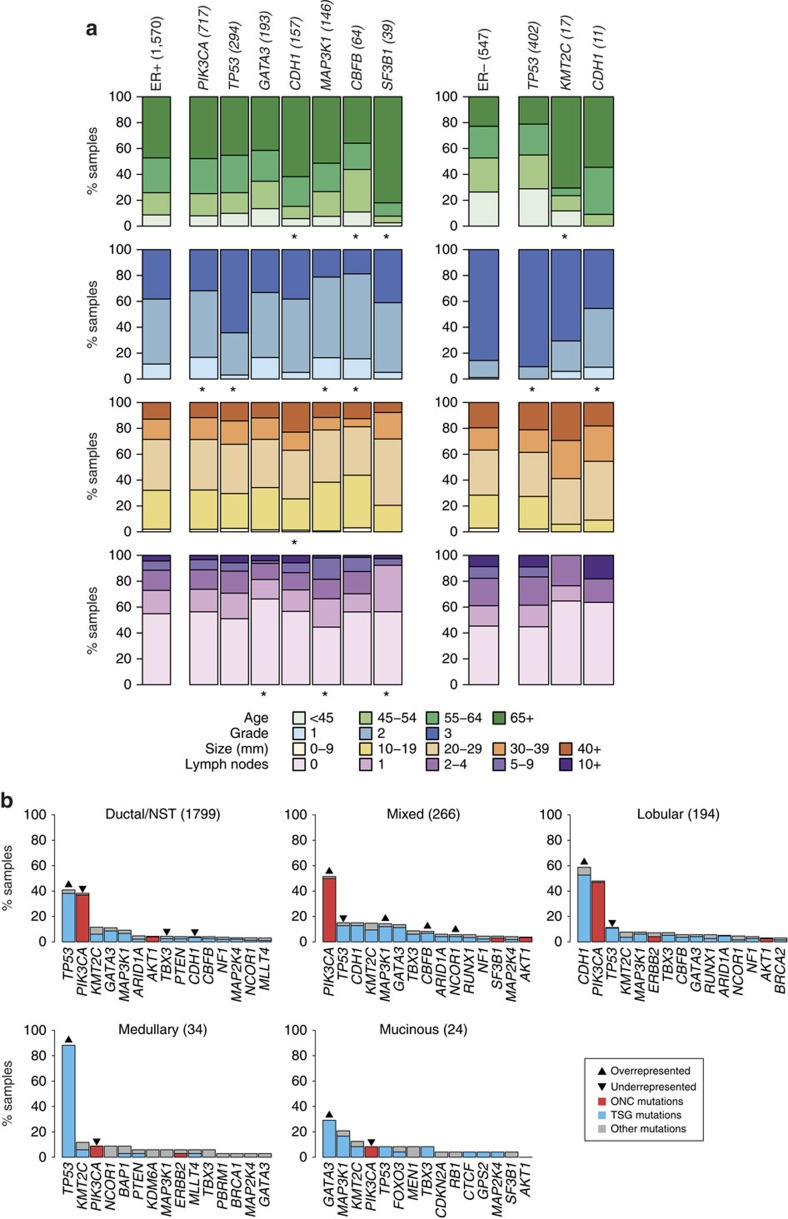
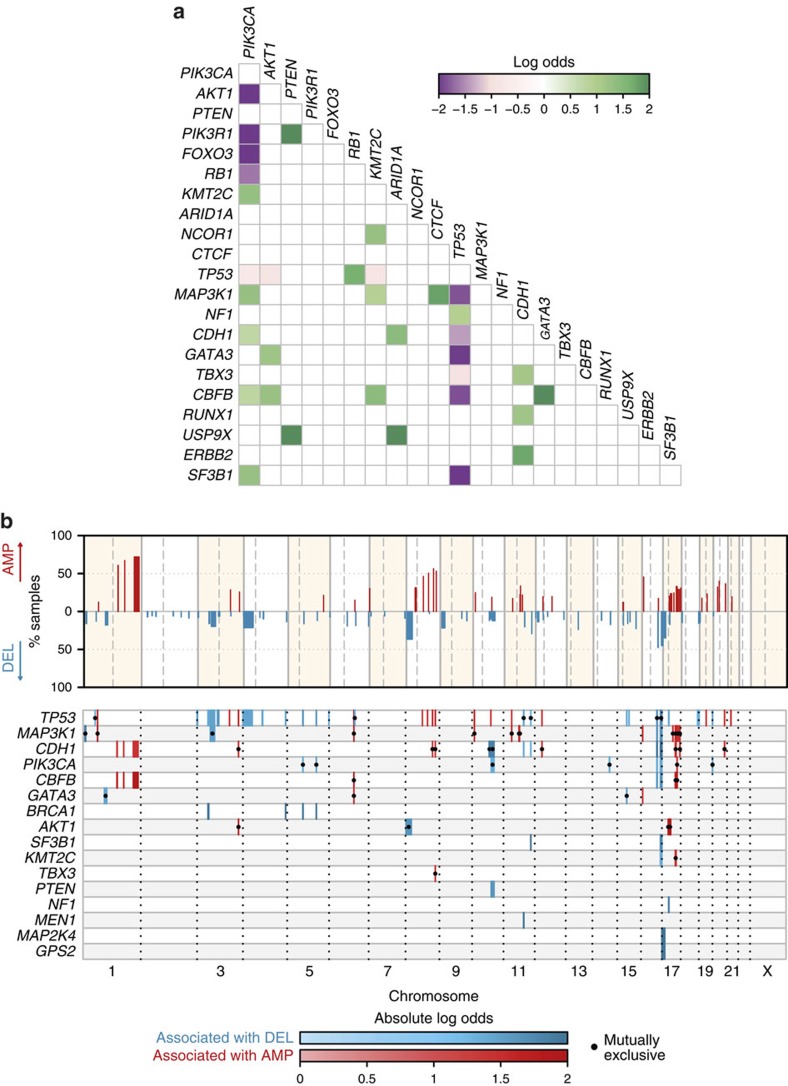
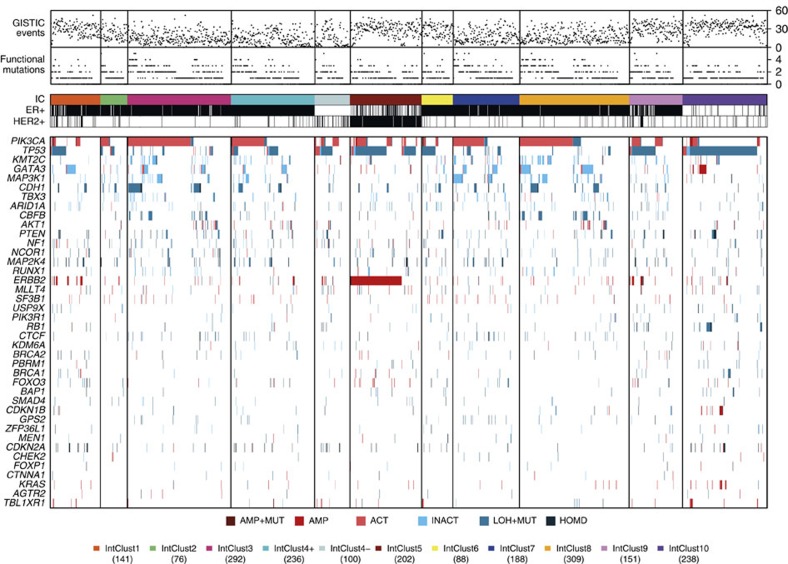
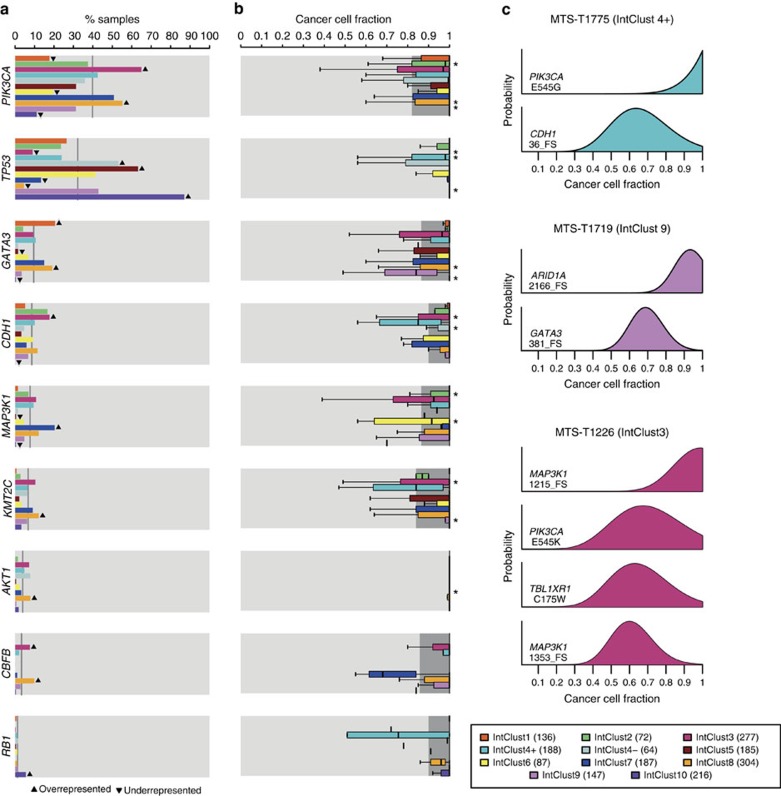
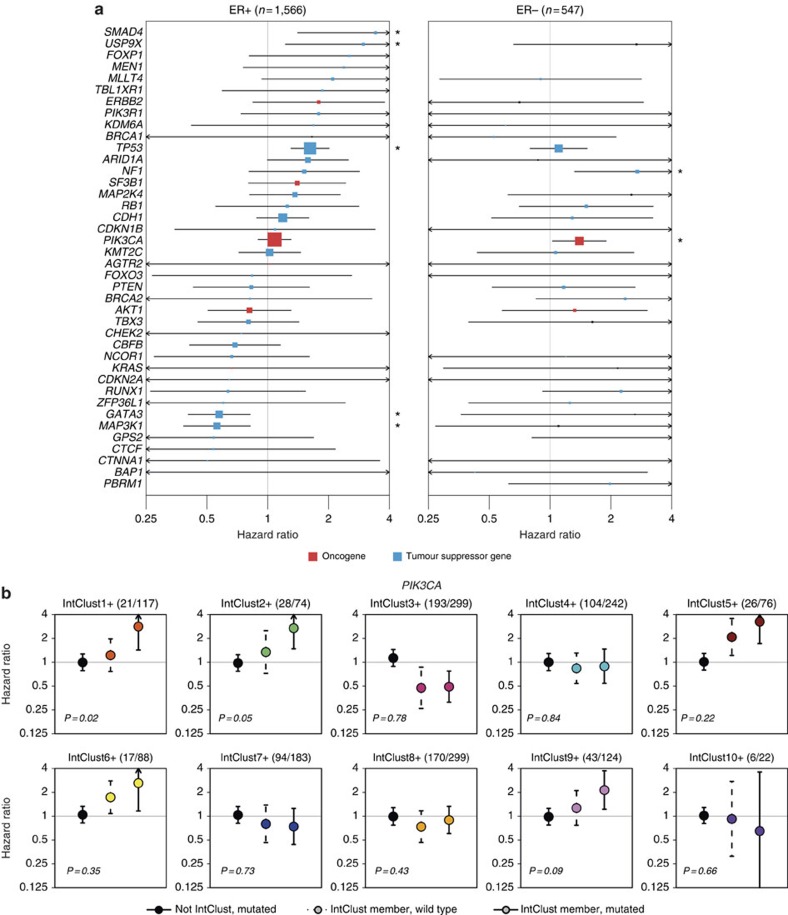
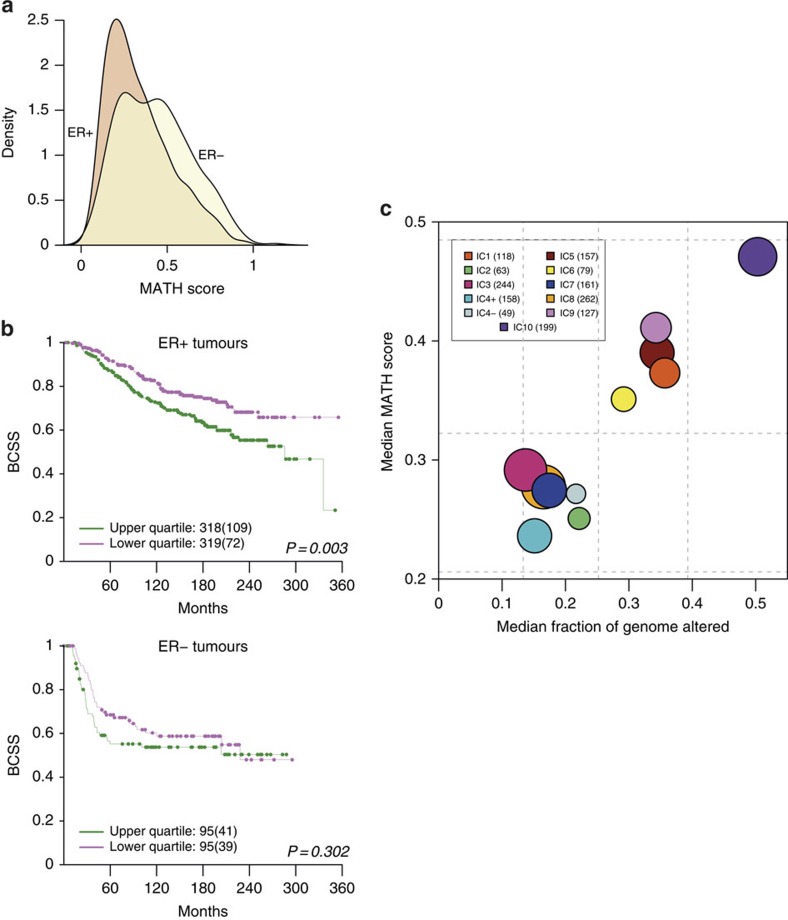
The genomic landscape of breast cancer is complex, and inter- and intra-tumour heterogeneity are important challenges in treating the disease. In this study, we sequence 173 genes in 2,433 primary breast tumours that have copy number aberration (CNA), gene expression and long-term clinical follow-up data. We identify 40 mutation-driver (Mut-driver) genes, and determine associations between mutations, driver CNA profiles, clinical-pathological parameters and survival. We assess the clonal states of Mut-driver mutations, and estimate levels of intra-tumour heterogeneity using mutant-allele fractions. Associations between PIK3CA mutations and reduced survival are identified in three subgroups of ER-positive cancer (defined by amplification of 17q23, 11q13-14 or 8q24). High levels of intra-tumour heterogeneity are in general associated with a worse outcome, but highly aggressive tumours with 11q13-14 amplification have low levels of intra-tumour heterogeneity. These results emphasize the importance of genome-based stratification of breast cancer, and have important implications for designing therapeutic strategies.


Conflict of interest statement

Helen Northen, John F. Peden, David R. Bentley and Mark T. Ross are full-time employees of Illumina Inc. Nitzan Rosenfeld is the Co-Founder and Chief Scientific Officer of Inivata Ltd. Dana W.Y. Tsui has acted as a consultant for Inivata Ltd prior to her current affiliation. Michelle Pugh is an employee of Inivata Ltd. The remaining authors declare no financial interests.

Figures

Figure 1
Figure 1. Identification of 40 mutation-driver genes in 2,433 primary breast cancer samples.
(a) Bars depict proportions of ER+ and ER− samples harbouring mutations in mutation-driver (Mut-driver) genes. Red and blue points indicate for each gene, the proportions of recurrent (oncogene; ONC score) and inactivating (tumour suppressor gene; TSG score) mutations, respectively. ‘' indicates genes previously highlighted in other studies: COSMIC, Cancer gene census from the Catalogue of Somatic Mutations in Cancer; TCGA-BRCA, TCGA breast cancer study; TCGA-PAN, TCGA pan-cancer analysis. ER status available for 2,410 tumours. MAPK, mitogen-activated protein kinase. The genes are grouped by pathway or function. (b) Bars depict proportion of tumours with copy number alterations (CNAs) in genes altered in at least 1% of ER+ or ER− samples. The percentages of tumours with amplifications, simultaneous amplification and mutation events, homozygous deletions and simultaneous mutations and LOH events are shown. LOH was defined as any CNA in which with either the major or minor allele was entirely deleted as determined by ASCAT (Methods).
Figure 2
Figure 2. Associations between mutations and clinical-pathological variables.
(a) The associations between functional mutations in Mut-driver genes and patient age, tumour grade, size and number of lymph nodes involved are depicted for ER+ (left) and ER− (right) samples. Bars depict the categorical distributions of each variable in samples harbouring a functional mutation in the specified gene. The single bars on the left of each panel show the distributions of the variables for either all ER+ or ER− samples. The numbers of samples with mutations in the genes are shown in brackets. For each gene, we looked for a difference in the distributions of a variable between wild-type and mutant samples. All genes for which at least one association was found (χ2-test; FDR=0.05) are shown, and ‘' indicates the significant associations. The analysis was performed for genes mutated in at least 1% of ER+ or ER− samples. (b) Bars depict prevalence of mutations in Mut-driver genes across histological subtypes. The 15 most frequently mutated genes in each subtype are shown. The coloured part of each bar indicates functional mutations, which were defined as recurrent mutations that contribute to an oncogene's ONC score (red), or inactivating mutations that contribute to a tumour suppressor gene's TSG score (see main text). Both recurrent and inactivating mutations were considered for TP53. Up arrows and down arrows indicate over/under-representation of mutations, respectively, in the specified gene relative to all other samples (Fisher's exact test; FDR=0.05). NST, no special type.
Figure 3
Figure 3. Patterns of association between somatic events.
(a) Pairwise association plot for 40 Mut-driver genes in 2,433 samples. Purple squares represent negative associations (mutually exclusive mutations); green squares represent positively associated events (co-mutation). The colour scale represents the magnitude of the association (log odds). We considered all genes mutated in at least 0.5% of the entire cohort, and only associations at FDR=0.1 are shown (Fisher's exact test). (b) Association plot of CNAs and Mut-driver gene mutations. Top panel: significantly recurrent copy number aberrations (CNAs) identified by GISTIC2 are shown across the genome, along with the percentage of samples affected by the particular CNA. Bottom panel: plot showing Mut-driver gene mutations associated with CNAs. Associations (Ass.) with amplifications and deletions are coloured red and blue respectively, and the colour scale corresponds to the magnitude of the association (log odds). Associations with dots represent mutual exclusivity and those without dots represent co-occurrence. Only genes with at least one significant association (Fisher's exact test; FDR=0.01) are shown, and only associations with absolute log odds ⩾log(2) were considered.
Figure 4
Figure 4. Genomic profiles of the Integrative Clusters.
Tumours with both mutation and copy number data available (n=2,021) are grouped by IntClust along the x-axis, and alterations in the 40 Mut-driver genes are indicated by coloured bars. For each tumour, the number of functional mutations in Mut-driver genes and the number of recurrent CNAs (as defined by GISTIC2) events are also shown. AMP, amplification; ACT, activating mutation; HOMD, homozygous deletion; INACT, inactivating mutation; LOH+MUT, mutation and hemizygous deletion.
Figure 5
Figure 5. Prevalence and clonal states of Mut-driver mutations across the Integrative Clusters.
(a) Bars showing prevalence of mutations for the nine Mut-driver genes that were either under- or over-represented in one of the IntClusts relative to all other samples (Fisher's exact test; FDR=0.05). Up arrows and down arrows indicate over/under-representation of mutations, respectively, in the specified IntClust. The grey lines represent mutation prevalence of the indicated gene for all samples in the cohort. (b) Box plots depicting cancer cell fractions (CCFs) of mutations in the nine genes across the IntClusts. CCFs were estimated as described in Methods, and we compared the CCF distribution of a gene's mutations in each IntClust with that of all other tumours. The dark grey shading represents interquartile ranges and outliers are not shown for the purpose of clarity. ‘*' indicates a significantly different CCF distribution (two-sample Wilcoxon test, P=0.05). (c) Example plots of CCF distributions in individual samples. Three samples (MTS-T1775, MTS-T1719 and MTS-T1226) were considered, and the IntClust to which they belong are also indicated. FS, frameshift indel.
Figure 6
Figure 6. Associations between mutations in the 40 Mut-driver genes and survival.
(a) Multivariable Cox proportional hazards models were constructed to assess the associations between functional mutations in Mut-driver genes and breast cancer-specific survival (BCSS) in ER+ (left) and ER− (right) cancers. For oncogenes (red), we considered only recurrent mutations, whereas only inactivating mutations were used for tumour suppressor genes (blue). Both classes of mutations were used for TP53. The lines represent 95% confidence intervals and sizes of the boxes correspond to the inverse of the interval size. Arrows indicate confidence intervals extending beyond plot range, and ‘' mark genes where mutations are associated BCSS at P<0.05. Some genes did not have sufficient mutations in the ER− cohort to obtain a hazard ratio estimate. (b) The association between functional PIK3CA mutations and BCSS were analyzed in ER+ tumours after stratifying by IntClust. For each IntClust, univariable Cox models were constructed to obtain a hazard ratio estimate for PIK3CA mutations in tumours not belonging to the particular IntClust (left; black point, solid line), the effect of IntClust membership for tumours with wild-type PIK3CA (middle; coloured point, dashed line), and the simultaneous effects of PIK3CA mutation and IntClust membership (right; coloured point, solid line). Lines and arrows represent confidence intervals as in Fig. 6a. The P values represent the significance of the interaction between PIK3CA mutation and IntClust membership in the Cox model. The fraction of tumours harbouring PIK3CA mutations within each IntClust is also indicated in brackets.
Figure 7
Figure 7. Intra-tumour heterogeneity in breast cancers stratified by IntClust.
(a) The distributions of mutant-allele tumour heterogeneity (MATH) scores are shown for ER+ and ER− tumours. The score represents a measure of the level of intra-tumour heterogeneity, and was calculated for each tumour as described in Methods. In general, ER+ samples have lower MATH scores than ER− samples, although there are a number of ER+ samples with higher scores. Tumours with fewer than five mutations were excluded from this analysis. (b) Kaplan–Meier survival curves (BCSS) are shown for tumours whose MATH scores fall in the lower or upper quartiles of the ER+ (top) and ER− (bottom) distributions. The numbers of samples under consideration are indicated, and the numbers in brackets represent the deaths occurring in each cohort. (c) Bubble plot of median MATH scores and CIN scores for each IntClust. The CIN is a measure of the percentage of the genome altered by CNAs. Dashed lines depict the quartiles for both scores (vertical lines, CIN quartiles; horizontal lines, MATH score quartiles) in the cohort as a whole. The areas of the circles are proportional to number of samples in each IntClust.

References

    1. Aparicio S. & Caldas C. The implications of clonal genome evolution for cancer medicine. N. Engl. J. Med. 368, 842–851 (2013). - PubMed
    1. Blows F. M. et al.. Subtyping of breast cancer by immunohistochemistry to investigate a relationship between subtype and short and long term survival: a collaborative analysis of data for 10,159 cases from 12 studies. PLoS Med. 7, e1000279 (2010). - PMC - PubMed
    1. Curtis C. et al.. The genomic and transcriptomic architecture of 2,000 breast tumours reveals novel subgroups. Nature 486, 346–352 (2012). - PMC - PubMed
    1. Dawson S.-J., Rueda O. M., Aparicio S. & Caldas C. A new genome-driven integrated classification of breast cancer and its implications. EMBO J. 32, 617–628 (2013). - PMC - PubMed
    1. Ciriello G. et al.. Emerging landscape of oncogenic signatures across human cancers. Nat. Genet. 45, 1127–1133 (2013). - PMC - PubMed

Publication types

Substances