. 2016 Aug;30(8):2959-69.
doi: 10.1096/fj.201600467R. Epub 2016 May 9.

Novel exon 1 protein-coding regions N-terminally extend human KCNE3 and KCNE4

Affiliations

Novel exon 1 protein-coding regions N-terminally extend human KCNE3 and KCNE4

Geoffrey W Abbott. FASEB J. 2016 Aug.

Abstract

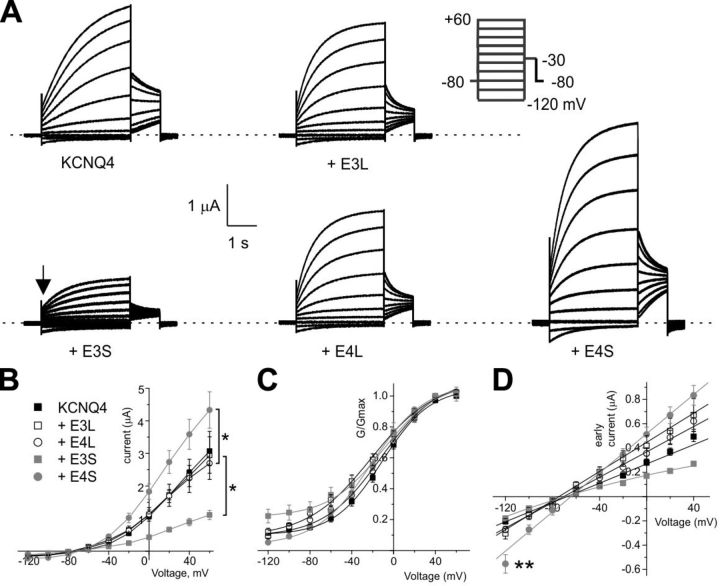
The 5 human (h)KCNE β subunits each regulate various cation channels and are linked to inherited cardiac arrhythmias. Reported here are previously undiscovered protein-coding regions in exon 1 of hKCNE3 and hKCNE4 that extend their encoded extracellular domains by 44 and 51 residues, which yields full-length proteins of 147 and 221 residues, respectively. Full-length hKCNE3 and hKCNE4 transcript and protein are expressed in multiple human tissues; for hKCNE4, only the longer protein isoform is detectable. Two-electrode voltage-clamp electrophysiology revealed that, when coexpressed in Xenopus laevis oocytes with various potassium channels, the newly discovered segment preserved conversion of KCNQ1 by hKCNE3 to a constitutively open channel, but prevented its inhibition of Kv4.2 and KCNQ4. hKCNE4 slowing of Kv4.2 inactivation and positive-shifted steady-state inactivation were also preserved in the longer form. In contrast, full-length hKCNE4 inhibition of KCNQ1 was limited to 40% at +40 mV vs. 80% inhibition by the shorter form, and augmentation of KCNQ4 activity by hKCNE4 was entirely abolished by the additional segment. Among the genome databases analyzed, the longer KCNE3 is confined to primates; full-length KCNE4 is widespread in vertebrates but is notably absent from Mus musculus Findings highlight unexpected KCNE gene diversity, raise the possibility of dynamic regulation of KCNE partner modulation via splice variation, and suggest that the longer hKCNE3 and hKCNE4 proteins should be adopted in future mechanistic and genetic screening studies.-Abbott, G. W. Novel exon 1 protein-coding regions N-terminally extend human KCNE3 and KCNE4.

Keywords: KCNQ1; KCNQ4; Kv4.2; arrhythmia; potassium channel.


Conflict of interest statement

The author is grateful for helpful discussions with Dr. Alex Mercer, Daniel Neverisky (University of California, Irvine) and Dr. Nancy Carrasco (Yale University, New Haven, CT, USA). The author thanks Dr. David Christini and Lala Tanmoy Das (Weill Cornell Medical College, New York, NY, USA) for invaluable tissue samples. This work was supported by the U.S. National Institutes of Health (National Institute of Diabetes and Digestive and Kidney Diseases Grant DK41544, and National Institute of General Medical Sciences Grant GM115189).

Figures

Figure 1.
Figure 1.
Gene structure and predicted protein sequence of full-length KCNE3. A) Gene structure of hKCNE3 as annotated in the NCBI database, showing 2–3 predicted exons in each of 2 different isoforms identified by their accession numbers (left). Thin, colored lines, introns; thick, colored lines: green, exons (light green, noncoding; dark green, coding); purple, entire gene; red, protein-coding exons. Black boxed region is the hKCNE3 isoform with 2 predicted exons encoding full-length hKCNE3. Upper scale is human chromosome 11 base pair numbering (GRCh38.p2 primary assembly). B) Predicted protein sequence for the novel N-terminal portion of hKCNE3. C) Predicted protein sequence for full-length KCNE3 of primates and the shorter KCNE3 predicted for M. musculus. Branched icons, consensus glycosylation sites; P, known PKC phosphorylation site. Consensus arginine amidation site indicated by open black square. Consensus sites predicted by Expasy ScanProsite (http://prosite.expasy.org/scanprosite/). Human gene numbering indicated. TM, transmembrane.
Figure 2.
Figure 2.
Gene structure and predicted protein sequence of full-length KCNE4. A) Gene structure of hKCNE4 from NCBI databases showing 2 predicted exons. Thin, colored lines, introns; thick, colored lines: green, exons (light green, noncoding; dark green, coding); purple, entire gene; red, protein-coding exons. Upper scale is human chromosome 2 base pair numbering (GRCh38.p2 primary assembly). B) Predicted protein sequence for the novel N-terminal portion of hKCNE4. C) Predicted protein sequence for full-length KCNE4 of various vertebrates and the shorter KCNE4 predicted for M. musculus. Branched icons, consensus glycosylation sites; P, consensus PKC phosphorylation site. Consensus sites predicted by Expasy ScanProsite (http://prosite.expasy.org/scanprosite/). Human gene numbering indicated. TM, transmembrane.
Figure 3.
Figure 3.
hKCNE3L transcript is expressed in multiple human tissues. A) Primer pairs used to verify expression of exon 1 and 3–spanning full-length hKCNE3 (hKCNE3L) transcript in human tissues, with annealing sites on exons 1 and 3 and product sizes indicated. B) Image of agarose gels showing the 399-bp hKCNE3L amplicon generated by PCR by using primer pair 1 from cDNA in human 48-tissue array. Image of agarose gel showing the various hKCNE3L amplicons with sizes as predicted (A, right), generated by using primer pairs 1–5, and human atrial cDNA. Each gel is representative of at least 2 independent PCRs and gel visualizations.
Figure 4.
Figure 4.
hKCNE4L transcript is expressed in multiple human tissues. A) Primer pairs used to verify expression of exon 1 and 2–spanning full-length hKCNE4 (hKCNE4L) transcript in human tissues, with annealing sites on exons 1 and 2 indicated. B) Image of agarose gels showing the 850-bp hKCNE4L amplicon generated by PCR by using primer pair 1 from cDNA in human 48-tissue array (left). Image of agarose gel showing the 890-bp hKCNE4L amplicon with sizes as were predicted in panel A, generated by using primer pair 2, and human atrial cDNA (center). Image of agarose gel showing the 890-bp hKCNE4L amplicon with sizes as predicted (A), generated by using primer pair 2, and human uterus cDNA (right). Each gel is representative of at least 2 independent PCRs and gel visualizations.
Figure 5.
Figure 5.
In silico promoter analysis of hKCNE3 and hKCNE4. A) Alignment of consensus start sites for human hKCNE3S, hKCNE3L, hKCNE4S, and hKCNE4L. ATG start sites underlined; Kozak sequence features and other features considered important for translation in bold. B) In silico analysis for hKCNE3 performed by using Swiss Institute of Bioinformatics Eukaryotic Promoter Database New (EPDnew; http://epd.vital-it.ch/). Features identified include human promoter binding region (bright blue), CpG islands (green), transcription start sites (beige), and transcription factor binding sites (black). C) In silico analysis for hKCNE4 performed by using EPDnew. Features identified include human promoter binding region (bright blue), CpG islands (dark green), transcription start clusters (blue line), histone H3K4me3 (trimethylated) binding region (bright green), and RNA polymerase II (Pol III) binding site.
Figure 6.
Figure 6.
hKCNE3L protein expression in human tissues. A) Western blot showing detection of 50-kD band in human colon and esophagus by using anti-KCNE3L antibody. B) Western blot showing detection of 50-kD band in human colon and esophagus and faster-migrating bands in several tissues by using anti–KCNE3-CT antibody.
Figure 7.
Figure 7.
hKCNE4L protein expression in human tissues. A) Western blots showing detection of ∼30-kD band in human kidney and, faintly, in uterus by using anti-KCNE4L antibody. A 25-kD band, possibly nonspecific, is also visible in all tissues tested (top). Western blots showing detection of ∼30-kD band in human kidney, thymus, and uterus by using anti–KCNE4-CT antibody (bottom). B) Western blots showing detection using anti-KCNE4L antibody of ∼30-kD band doublet in lysates of CHO cells transfected with hKCNE4L; band was absent from lysates of CHO cells transfected with hKCNE4S and from lysates of nontransfected CHO cells (top). Western blots showing detection using anti–KCNE4-CT antibody of ∼30-kD band doublet in lysates of CHO cells transfected with hKCNE4L and of ∼25-kD band doublet in lysates of CHO cells transfected with hKCNE4S; band was absent from lysates of nontransfected CHO cells (bottom).
Figure 8.
Figure 8.
Functional effects of long and short forms of hKCNE3 and hKCNE4 on rKv4.2. A) Exemplar current traces recorded from Xenopus oocytes expressing rat Kv4.2 alone (n = 36) or with hKCNE3L (E3L; n = 19), hKCNE3S (E3S; n = 16), hKCNE4L (E4L; n = 19), or hKCNE4S (E4S; n = 10). Voltage-clamp protocol (top right). B) Mean ± sem peak current–voltage relationship for currents and n values are same as in panel A. C) Mean ± sem τ of fast inactivation (single exponential fit) for currents and n values are same as in panel A. D) Exemplar current traces recorded from Xenopus oocytes expressing rat Kv4.2 alone (n = 36) or with hKCNE3L (E3L; n = 15) or KCNE4L (E4L; n = 16) by using steady-state inactivation protocol (left). Tail current time point used for quantifying available channels indicated by arrow. E) Mean ± sem for voltage dependence of steady-state inactivation (plotted as fraction of channels available at arrow in panel D vs. voltage) for currents and n values are same as in panel D. **P < 0.01 vs. Kv4.2 alone current at +40 mV; other groups P > 0.05 vs. Kv4.2 alone (B). **P < 0.01 vs. all other groups; other comparisons P > 0.05 after pairwise analysis by 1-way ANOVA followed by Tukey’s HSD test (C).
Figure 9.
Figure 9.
Functional effects of long and short forms of hKCNE3 and hKCNE4 on hKCNQ1. A) Exemplar current traces recorded from Xenopus oocytes expressing hKCNQ1 alone (2.5 ng cRNA per oocyte; n = 17) or with 10 ng cRNA per oocyte hKCNE3L (E3L; n = 11), hKCNE3S (E3S; n = 10), hKCNE4L (E4L; n = 11), or hKCNE4S (E4S; n = 24). Voltage-clamp protocol (top). Zero current level indicated by dashed line. B) Mean ± sem peak current–voltage relationship for currents and n values are same as in panel A. C) Mean ± sem normalized G/V relationship measured at beginning of tail pulse for currents and n values are same as in panel A; symbols are same as in panel B. KCNQ1-E4S values were omitted because low currents precluded accurate tail current measurements. D) Mean ± sem peak current at +40 mV for KCNQ1 (2.5 ng vs. 10 ng cRNA per oocyte) alone (n = 10–17) or with coinjection of 10 ng/oocyte KCNE4L (E4L) cRNA (n = 11). ***P < 0.0005 (B). ***P < 0.00001 (D).
Figure 10.
Figure 10.
Functional effects of long and short forms of hKCNE3 and hKCNE4 on KCNQ4. A) Exemplar current traces recorded from Xenopus oocytes expressing hKCNQ4 alone (n = 35), or with hKCNE3L (E3L; n = 16), hKCNE3S (E3S; n = 12), hKCNE4L (E4L; n = 38), or hKCNE4S (E4S; n = 12). Voltage-clamp protocol (top right). Zero current level indicated by dashed line. B) Means ± sem peak current–voltage relationship for currents and n values are same as in panel A. C) Mean ± sem normalized G/V relationship measured at beginning of tail pulse for currents and n values are same as in panel A. D) Mean ± sem early current (recorded at position shown by arrow in panel A) for currents and n values are same as in panel A; symbols are same as in panels B and C. *P < 0.05. ***P < 0.0001 vs. early current at −120 mV for KCNQ4 alone, other groups not significantly different from KCNQ1 alone.

References

    1. Isacoff E. Y., Jan Y. N., Jan L. Y. (1990) Evidence for the formation of heteromultimeric potassium channels in Xenopus oocytes. Nature , 530–534 - PubMed
    1. Abbott G. W., Xu X., Roepke T. K. (2007) Impact of ancillary subunits on ventricular repolarization. J. Electrocardiol. , S42–S46 - PMC - PubMed
    1. Abbott G. W., Goldstein S. A. (1998) A superfamily of small potassium channel subunits: form and function of the MinK-related peptides (MiRPs). Q. Rev. Biophys. , 357–398 - PubMed
    1. McCrossan Z. A., Abbott G. W. (2004) The MinK-related peptides. Neuropharmacology , 787–821 - PubMed
    1. Abbott G. W., Butler M. H., Bendahhou S., Dalakas M. C., Ptacek L. J., Goldstein S. A. (2001) MiRP2 forms potassium channels in skeletal muscle with Kv3.4 and is associated with periodic paralysis. Cell , 217–231 - PubMed

Publication types

MeSH terms

Substances