. 2016 May 30;213(6):1029-46.
doi: 10.1084/jem.20151229. Epub 2016 May 9.

Ubiquitin E3 ligase FIEL1 regulates fibrotic lung injury through SUMO-E3 ligase PIAS4

Affiliations

Ubiquitin E3 ligase FIEL1 regulates fibrotic lung injury through SUMO-E3 ligase PIAS4

Travis Lear et al. J Exp Med. .

Abstract

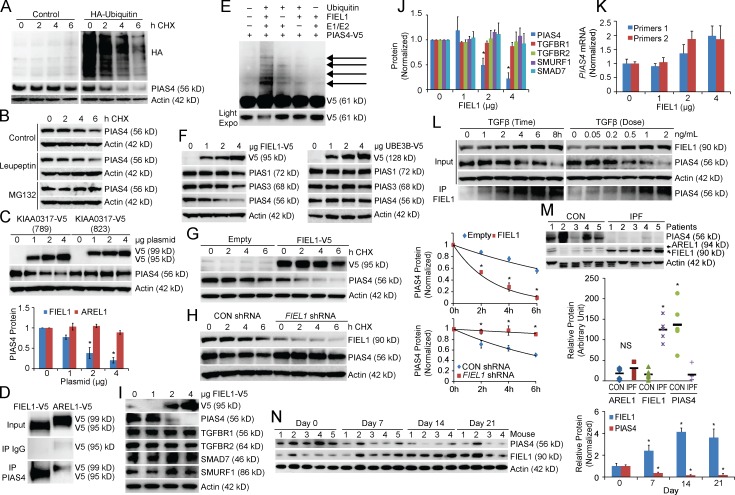
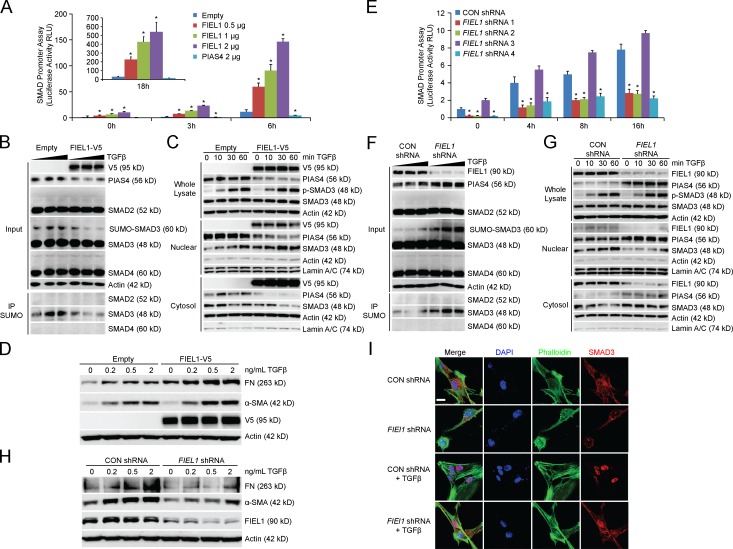
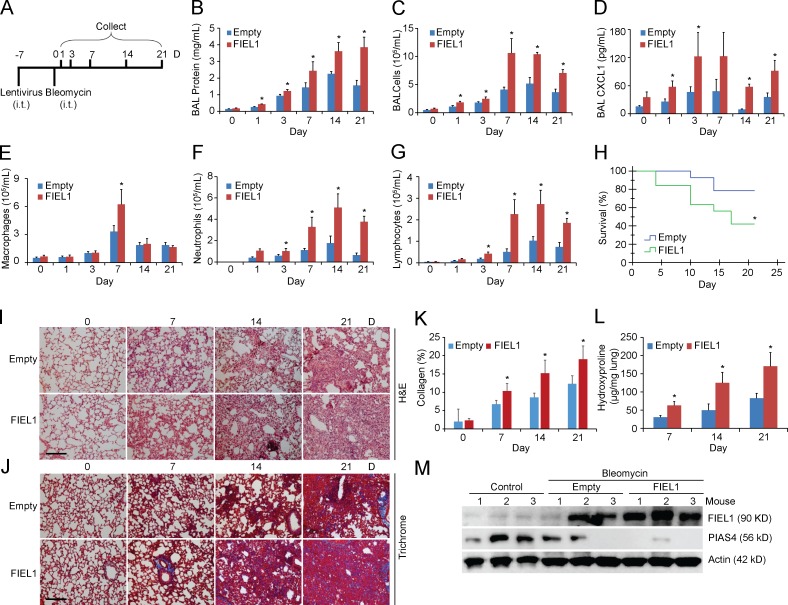
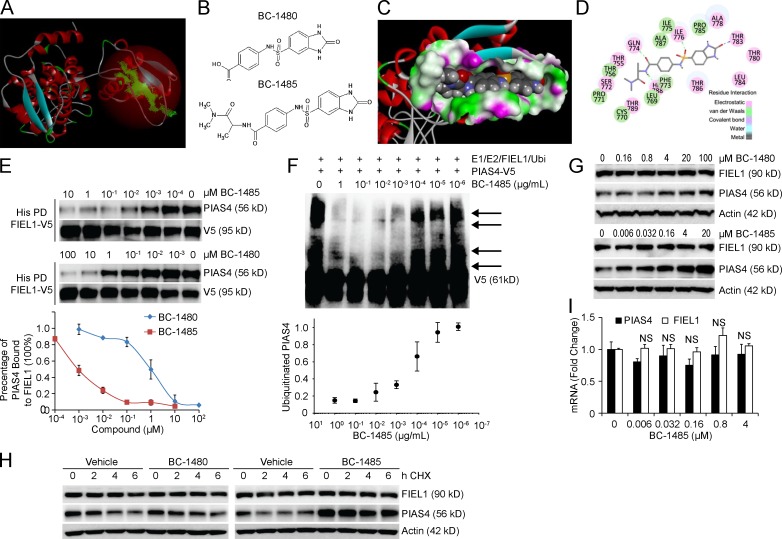
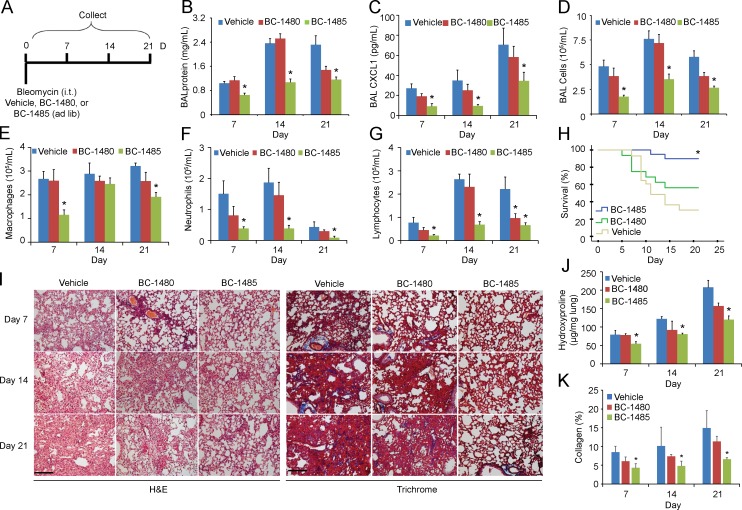
The E3 small ubiquitin-like modifier (SUMO) protein ligase protein inhibitor of activated STAT 4 (PIAS4) is a pivotal protein in regulating the TGFβ pathway. In this study, we discovered a new protein isoform encoded by KIAA0317, termed fibrosis-inducing E3 ligase 1 (FIEL1), which potently stimulates the TGFβ signaling pathway through the site-specific ubiquitination of PIAS4. FIEL1 targets PIAS4 using a double locking mechanism that is facilitated by the kinases PKCζ and GSK3β. Specifically, PKCζ phosphorylation of PIAS4 and GSK3β phosphorylation of FIEL1 are both essential for the degradation of PIAS4. FIEL1 protein is highly expressed in lung tissues from patients with idiopathic pulmonary fibrosis (IPF), whereas PIAS4 protein levels are significantly reduced. FIEL1 overexpression significantly increases fibrosis in a bleomycin murine model, whereas FIEL1 knockdown attenuates fibrotic conditions. Further, we developed a first-in-class small molecule inhibitor toward FIEL1 that is highly effective in ameliorating fibrosis in mice. This study provides a basis for IPF therapeutic intervention by modulating PIAS4 protein abundance.


Figures

Figure 1.
Figure 1.
FIEL1–PIAS4 pathway in pulmonary fibrosis. (A) PIAS4 protein half-life determination in MLE cells transfected with empty plasmid or ubiquitin plasmid (n = 2). (B) PIAS4 protein half-life determination with MG132 or leupeptin treatment (n = 3). (C) Immunoblots (top) showing levels of PIAS4 protein and V5 after KIAA0317 (823 aa, AREL1) and (789 aa, FIEL1) plasmid expression. PIAS4 protein quantification was normalized and graphed (bottom). Data represent mean values ± SEM (n = 3 independent experiments; *, P < 0.05 compared with 0 µg plasmid, Student’s t test). (D) PIAS4 protein was immunoprecipitated from cell lysate using a PIAS4 antibody and coupled to protein A/G beads. PIAS4 beads were then incubated with in vitro–synthesized products expressing HIS-V5-FIEL1 (789 aa) or HIS-V5-AREL1 (823 aa). After washing, proteins were eluted and processed for V5 immunoblotting (n = 2). (E) In vitro ubiquitination assay. Purified E1 and E2 components were incubated with V5-PIAS4 and FIEL1. The full complement of ubiquitination reaction components (second lane) showed polyubiquitinated PIAS4 proteins (n = 3). (F) Immunoblots showing levels of PIAS proteins and V5 after ectopic FIEL1 or UBE3B expression. (G and H) PIAS4protein half-life determination in MLE cells with empty plasmid or FIEL1 expression (G); PIAS4 protein half-life determination with CON shRNA or FIEL1 shRNA expression (H). Data represent mean values ± SEM (n = 3 independent experiments; *, P < 0.05 compared with Empty or to Control, Student’s t test). (I–J) Immunoblots (I) showing levels of PIAS4, TGFBR1, TGFBR2, SMAD7, Smurf1, and V5 after FIEL1 expression. Protein quantification was graphed (J). Data represent mean values ± SEM (n = 3 independent experiments; *, P < 0.05 compared with 0 µg FIEL1, Student’s t test). (K) mRNA levels of PIAS4 upon FIEL1 expression was measured using two sets of PIAS4 RT-PCR primers. Data represent mean values ± SEM (n = 3 independent experiments). (L) MRC5 cells were treated with TGFβ in a time- or dose-dependent manner; cells were collected and immunoblotted for FIEL1 and PIAS4. Endogenous FIEL1 was also immunoprecipitated and immunoblotted for PIAS4 (n = 3). (M) PIAS4 and FIEL1 immunoblotting from lung tissues samples from five control and five IPF patients. PIAS4 and both the shorter and longer forms of KIAA0317 were quantified using ImageJ and graphed. Data represent mean values (n = 5 patients; NS, not significant *, P < 0.05 compared with CON, Student’s t test). (N) C57BL/6J mice were treated i.t. with bleomycin (0.02 U) for up to 21 d. Mice were then euthanized, and lungs were isolated and assayed for PIAS4 and FIEL1 immunoblotting. Bands corresponding to each protein on immunoblots were quantified using ImageJ software, and the results are displayed graphically. Data represent mean values ± SEM (n = 4–5 mice per group; *, P < 0.05 compared with day 0, Student’s t test).
Figure 2.
Figure 2.
FIEL1 promotes TGFβ signaling. (A and E) SMAD reporter assays. 293T cells were cotransfected with Cignal SMAD dual luciferase reporter plasmids along with empty, FIEL1, Con shRNA, or FIEL1 shRNA. 24 h later, cells were treated with TGFβ for 2–16 h. Cells were collected and assayed for luciferase activity to evaluate SMAD promoter activity. Data represent mean values ± SEM (n = 3; *, P < 0.05 compared with empty, Student’s t test). (B and F) 293T cells were transfected with empty, FIEL1, CON shRNA, or FIEL1 shRNA for 48 h before TGFβ treatment (0–2 ng/ml) for 1 h. Cells were then collected and immunoblotted. Cell lysates were immunoprecipitated using SUMO antibody before SMAD2, 3, and 4 immunoblotting (n = 2). (C and G) 293T cells were transfected with empty, FIEL1, CON shRNA, or FIEL1 shRNA for 48 h before TGFβ treatment (2 ng/ml) for up to 1 h. Cells were then collected and nuclear/cytosol fractions were isolated prior to immunoblotting. (D and H) MRC5 cells were transfected with empty, FIEL1, CON shRNA, or FIEL1 shRNA for 48 h before TGFβ dose course treatment for an additional 18 h. Cells were then collected and immunoblotted (n = 2). (I) MRC5 cells were seeded in 35-mm glass bottom dishes before being transfected with CON shRNA or FIEL1 shRNA for 48 h before TGFβ treatment for an additional 30 min. Cells were then fixed and immunostained with α-SMAD3.The nucleus was counterstained with DAPI and F-actin was counterstained with phalloidin (n = 3). Bar, 10 µm.
Figure 3.
Figure 3.
PIAS4 phosphorylation by PKCζ is required for FIEL1 binding. (A) Endogenous PIAS4 was immunoprecipitated and immunoblotted for Erk1, PKCα, and PKCζ (n = 2). (B) MLE cells were transfected with increasing amounts of PKCζ or JNK1 plasmids for 18 h before PIAS4 immunoblotting (n = 2). (C) PIAS4 protein half-life determination with CON shRNA or PKCζ shRNA expression (n = 3). (D) PIAS4 protein half-life determination with Empty or PKCζ plasmid overexpression (n = 3). (E and F) MRC5 cells were treated with TGFβ in a time or dose-dependent manner; cells were collected and immunoblotted for FIEL1, PIAS4, PKCζ, and p-PKCζ (Thr410). Endogenous PIAS4 was also immunoprecipitated and followed by PKCζ, PKCα, phosphoserine, and phosphothreonine immunoblotting (n = 2). (G) In vitro PKCζ kinase assay. Recombinant PKCζ (Enzo) was used as the kinase, and V5-tagged PIAS4 was synthesized via TnT in vitro kits (Promega), purified by HIS pulldown, and used as the substrate. The kinase reactions were incubated at 37°C for 2 h, and products were resolved by SDS-PAGE and processed for autoradiography either by using Personal Molecular Imager (Bio-Rad Laboratories) or immunoblotting for V5 to visualize the substrate input. *, heat inactivated PKCζ (n = 2). (H) Immunoblots showing levels of FIEL1, PKCζ, p-PKCζ (Thr410), and PIAS4 protein in 293T cells transfected with either CON shRNA or PKCζ shRNA, followed by a TGFβ dose treatment. Endogenous PIAS4 was also immunoprecipitated and followed by PKCζ, phosphoserine, and phosphothreonine immunoblotting. (I) 293T cells were transfected with WT, S14A, S18A, or S14/18A PIAS4 before being treated with a dose course of TGFβ. Cells were then collected and assayed for V5-PIAS4 immunoblotting. Overexpressed V5-PIAS4 was also immunoprecipitated using a V5 antibody and followed by phosphoserine immunoblotting (n = 2). (J) Four biotin-labeled PIAS4 peptides were bound to streptavidin and served as the bait for FIEL1 binding. After washing, proteins were eluted and immunoblotted for FIEL1-V5 (n = 2).
Figure 4.
Figure 4.
GSK3β regulates PIAS4 protein stability through FIEL1. (A) Endogenous FIEL1 was immunoprecipitated and followed by JNK2, PKCα, and GSK3β immunoblotting (n = 2). (B) MLE cells were transfected with increasing amounts of WT or constitutively activated GSK3β hyper mutant plasmids for 18 h before PIAS4 immunoblotting. The arrow indicates the overexpressed GSK3β (n = 2). (C) PIAS4 protein half-life determination with WT GSK3β or hyperactive GSK3β plasmid overexpression. The arrow indicates the overexpressed GSK3β (n = 2). (D) MRC5 cells were treated with TGFβ in a time or dose-dependent manner; cells were then collected and immunoblotted for FIEL1 and PIAS4. Endogenous FIEL1 was also immunoprecipitated and followed by phosphoserine and phosphothreonine immunoblotting (n = 2). (E) PIAS4 protein half-life determination with CON shRNA or GSK3β shRNA expression (n = 2). (F) Immunoblots showing levels of GSK3β, phospho-GSK3β (Ser9), PIAS4, and FIEL1 protein in 293T cells transfected with either CON shRNA or GSK3β shRNA followed by a TGFβ dose treatment. Endogenous FIEL1 was also immunoprecipitated, followed by phosphoserine and phosphothreonine immunoblotting. (G) Lung samples from Fig. 1 J were subjected to FIEL1 immunoprecipitation, followed by PIAS4, phosphothreonine, and phosphoserine immunoblotting. PIAS4 protein abundance was plotted as a function of p-Thr protein (n = 5 patients per group; *, P < 0.01, Pearson correlation).
Figure 5.
Figure 5.
GSK3β phosphorylation of FIEL1 is required for PIAS4 targeting. (A) MLE cells were transfected with increasing amounts of WT, T783A, or T783D mutant FIEL1 plasmids for 18 h before PIAS4 immunoblotting (n = 2). (B) PIAS4 protein half-life determination with WT, T783A, or T783D mutant FIEL1 (n = 2). (C) In vitro GSK3β kinase assay. Recombinant GSK3β (Enzo) was used as the kinase, and V5-tagged FIEL1 were synthesized via TnT in vitro kits (Promega), purified by HIS pulldown, and used as the substrate. The kinase reactions were incubated at 37°C for 2 h, and products were resolved by SDS-PAGE and processed for autoradiography either by using Personal Molecular Imager (Bio-Rad Laboratories) or immunoblotting for V5 to visualize the substrate input. *heat inactivated GSK3β (n = 2). (D) 293T cells were transfected with empty, WT, or T783A FIEL1 for 24h. Cells were then collected and immunoblotted for V5-FIEL1 and PIAS4. Overexpressed V5-FIEL1 was also immunoprecipitated using V5 antibody and followed by phosphothreonine immunoblotting (n = 2). (E) Four biotin-labeled FIEL1 peptides were prebound to streptavidin and served as the bait for PIAS4 binding. After washing, proteins were eluted and processed for PIAS4 immunoblotting (n = 2). (F) MLE cells were transfected with increasing amounts of WT, T783A, P779L, or T783A/P779L double mutant FIEL1 plasmids for 18 h before PIAS4 immunoblotting. (G) PIAS4 protein half-life determination with WT, T783A, P779L, or T783A/P779L double mutant FIEL1 (n = 2). (H) PIAS4 peptide 2 (Biotin-MSFRVS(p)DLQM) was prebound to streptavidin and served as the bait for FIEL1 binding. After washing, proteins were eluted and processed for V5-FIEL1 immunoblotting (n = 2). (I) FIEL1 peptide 2 (Biotin-QIIAAPTHST(p)LPTA) was bound to streptavidin and served as the bait for PIAS4 binding. After washing, proteins were eluted and processed for V5-PIAS4 immunoblotting (n = 2). (J) 293T cells were transfected with WT, T783A, P779L, or T783A/P779L double mutant FIEL1 before being treated with TGFβ. Cells were then collected and assayed for PIAS4 immunoblotting. (K) MLE cells were transfected with increasing amounts of WT, I514V, or D207V mutant FIEL1 plasmids for 18 h before PIAS4 immunoblotting. (L) PIAS4 protein half-life determination with WT, I514V, or D207V mutant FIEL1 expression.
Figure 6.
Figure 6.
Gene transfer of FIEL1 exacerbates bleomycin-induced lung injury in vivo. (A)C57BL/6J mice weretreated i.t. with Lenti-Empty or Lenti-FIEL1 (107 PFU/mouse) for 144 h; mice were then treated i.t. with bleomycin (0.02 U). Mice were euthanized over the next 1–21 d, and lungs were lavaged with saline, harvested, and then homogenized. (B–D) Lavage protein, total cells, and CXCL1 concentrations were measured. Data represent mean values ± SEM (n = 4–6 mice per group, data are from one of the two experiments performed; *, P < 0.05 compared with empty, Student’s t test). (E–G) Lavage cells were then processed for Wright-Giemsa stain; lavage macrophages, neutrophils, and lymphocytes were counted and graphed. Data represent mean values ± SEM (n = 4–6 mice per group, *, P < 0.05 compared with empty, Student’s t test). (H) Survival studies of mice that were given bleomycin. Mice were carefully monitored over time; moribund, preterminal animals were immediately euthanized and recorded as deceased. Kaplan-Meier survival curves were generated using SPSS software (n = 9–11 mice per group; *, P < 0.05 compared with Empty, Log-rank test). Empty: n = 9, FIEL1: n = 11. (I and J) Hematoxylin and eosin (H&E) and Trichrome staining were performed on lung samples. Bars, 100 µm. (K) Collagen percentage quantification from Trichrome staining. Data represent mean values ± SEM (n = 4–6 mice per group, *, P < 0.05 compared with empty, Student’s t test). (L) Hydroxyproline content was measured in lungs from 7, 14, and 21 d after bleomycin challenge. Data represent mean values ± SEM (n = 4–6 mice per group, *, P < 0.05 compared with empty, Student’s t test). (M) Mice lungs were isolated and assayed for PIAS4 and FIEL1 immunoblotting.
Figure 7.
Figure 7.
FIEL1 knockdown ameliorates bleomycin-induced lung injury in vivo. (A) C57BL/6J mice were treated i.t. with Lenti-CON shRNA or Lenti-FIEL1 shRNA (107 PFU/mouse) for 144 h; mice were then treated i.t. with bleomycin (0.05 U). Mice were euthanized over the next 1–21 d, and lungs were lavaged with saline, harvested, and then homogenized. (B–D) Lavage protein, total cells, and CXCL1 concentrations were measured. Data represent mean values ± SEM (n = 4–6 mice per group, data are from one of the two experiments performed; *, P < 0.05 compared with Control, Student’s t test). (E–G) Lavage cells were then processed for Wright-Giemsa stain; lavage macrophages, neutrophils, and lymphocytes were counted and graphed. Data represent mean values ± SEM (n = 4–6 mice per group, *, P < 0.05 compared with Control, Student’s t test). (H) Survival studies of mice that were given bleomycin. Mice were carefully monitored over time; moribund, preterminal animals were immediately euthanized and recorded as deceased. Kaplan-Meier survival curves were generated using SPSS software (n = 8 mice per group; *, P < 0.05 compared with Control, Log-rank test P < 0.05). Empty: n = 8, FIEL1: n = 8. (I and J) H&E and Trichrome staining was performed on lung samples. Bar indicates 100 µm. (K) Collagen percentage quantification from Trichrome staining. Data represent mean values ± SEM (n = 4–6 mice per group, *, P < 0.05 compared with Control, Student’s t test). (L) Hydroxyproline content was measured in lungs from 7, 14, and 21 d after bleomycin challenge. Data represent mean values ± SEM (n = 4–6 mice per group; *, P < 0.05 compared with Control, Student’s t test). (M) Mice lungs were isolated and assayed for PIAS4 and FIEL1 immunoblotting.
Figure 8.
Figure 8.
Antifibrotic activity of a FIEL1 small molecule inhibitor in vitro. (A) Structural analysis of the FIEL1 HECT domain revealed a major cavity within the C terminus of the HECT domain. (B) Structures of the BC-1480 backbone (4-(2-Oxo-2,3-dihydro-1H-benzoimidazole-5-sulfonylamino)-benzoic acid) and lead compound BC-1485. (C and D) Docking studies of the lead compound, BC-1485, interacting with the FIEL1-HECT domain. (E) FIEL1 protein was HIS-purified from FIEL1 expression in 293T cells using cobalt beads. Beads were then extensively washed before exposure to BC-1480 or BC-1485 at different concentrations (10−4 to 100 µM). Purified PIAS4 protein was then incubated with drug-bound FIEL1 beads overnight. Beads were washed, and proteins were eluted and resolved on SDS-PAGE. The relative amounts of PIAS4 detected in the pull-downs was normalized to loading and quantified (n = 2). (F) In vitro ubiquitination assay. Purified FIEL1, E1, and E2 protein were incubated with purified V5-PIAS4, and the full complement of ubiquitination reaction components with increased concentrations of BC-1485 showed decreased levels of polyubiquitinated PIAS4 (arrows). (bottom) Levels of ubiquitinated PIAS4 as a function of BC-1485 concentration (n = 2). (G) MLE cells were exposed to BC-1480 or BC-1485 at various concentrations for 18 h. Cells were then collected and immunoblotted (n = 3). (H) PIAS4 protein half-life determination after BC-1480 or BC-1485 treatment at 5 µM for 18 h. (I) PIAS4 and FIEL1 mRNA analysis after BC-1485 treatment for 18 h. Data represent mean values ± SEM (n = 3 independent experiments; NS, not significant compared with 0 µM condition, Student’s t test).
Figure 9.
Figure 9.
Antifibrotic activity of a FIEL1 small molecule inhibitor in vivo. (A) C57BL/6J mice were treated i.t. with bleomycin (0.05 U). Compounds BC-1480 and BC-1485 were given to mice at the same time through drinking water with an estimated dose of 5 mg/kg/d. Mice were euthanized over the next 1–21 d, and lungs were lavaged with saline, harvested, and then homogenized. (B–D) Lavage proteins, CXCL1, and total cell count were measured. Data represent mean values ± SEM (n = 4–8 mice per group; data are from one of two experiments performed; *, P < 0.05 compared with Vehicle, Student’s t test). (E–G) Lavage cells were also processed for Wright-Giemsa stain; Lavage macrophages, neutrophils, and lymphocytes were counted and graphed. Data represent mean values ± SEM (n = 4–8 mice per group; *, P < 0.05 compared with Vehicle, Student’s t test). (H) Survival studies of mice that were given bleomycin and BC-compound treatments. Mice were carefully monitored over time; moribund, preterminal animals were immediately euthanized and recorded as deceased. Kaplan-Meier survival curves were generated using SPSS software (n = 12–24 mice per group; *, P < 0.05 compared with Vehicle, Log-rank test P < 0.05). Vehicle, n = 24, BC-1480; n = 13, BC-1485; n = 12. (I) H&E and Trichrome staining was performed on lung samples. Bar, 100 µm. (J) Hydroxyproline content were measured in lungs from 7, 14, and 21 d after bleomycin challenge. Data represent mean values ± SEM (n = 4–8 mice per group; *, P < 0.05 compared with Vehicle, Student’s t test). (K) Collagen percentage quantification from Trichrome staining. Data represent mean values ± SEM (n = 4–8 mice per group; *, P < 0.05 compared with Vehicle, Student’s t test).
Figure 10.
Figure 10.
Antifibrotic activity of a FIEL1 small molecule inhibitor in vivo. (A) C57BL/6J mice were treated i.t. with bleomycin (0.05 U). 10 d later, compound BC-1485 was given to mice through the drinking water with an estimated dose of 2 or 10 mg/kg/d. Mice were euthanized 10 d later, and lungs were lavaged with saline, harvested, and then homogenized. (B and C) Lavage proteins and total cell count were measured. Data represent mean values ± SEM (n = 6–9 mice per group; *, P < 0.05 compared with Vehicle, Student’s t test). (D) Lavage cells were also processed for Wright-Giemsa stain; lavage macrophages, neutrophils, and lymphocytes were counted and graphed. Data represent mean values ± SEM (n = 6–9 mice per group; *, P < 0.05 compared with Vehicle, Student’s t test). (E) Survival studies of mice that were given bleomycin and BC-compound treatments. Mice were carefully monitored over time; moribund, preterminal animals were immediately euthanized and recorded as deceased. Kaplan-Meier survival curves were generated using SPSS software (n = 12–16 mice per group; *, P < 0.05 compared with Vehicle, Log-rank test P < 0.05). Vehicle, n = 16, BC-1485 (2 mg/kg/d); n = 12, BC-1485 (10 mg/kg/d); n = 12. (F) Hydroxyproline content was measured in lungs from 10 d after bleomycin challenge. Data represent mean values ± SEM (n = 6–9 mice per group; *, P < 0.05 compared with Vehicle, Student’s t test). (G) H&E and Trichrome staining were performed on lung samples from A. Bar, 100 µm. (H) Collagen percent quantification from Trichrome staining. Data represent mean values ± SEM (n = 6–9 mice per group; *, P < 0.05 compared with Vehicle, Student’s t test). (I) Mice lungs were isolated and assayed for PIAS4 and FIEL1 immunoblotting.

References

    1. Akhmetshina A., Venalis P., Dees C., Busch N., Zwerina J., Schett G., Distler O., and Distler J.H.. 2009. Treatment with imatinib prevents fibrosis in different preclinical models of systemic sclerosis and induces regression of established fibrosis. Arthritis Rheum. 60:219–224. 10.1002/art.24186 - DOI - PubMed
    1. Annes J.P., Munger J.S., and Rifkin D.B.. 2003. Making sense of latent TGFbeta activation. J. Cell Sci. 116:217–224. 10.1242/jcs.00229 - DOI - PubMed
    1. Attisano L., and Wrana J.L.. 2000. Smads as transcriptional co-modulators. Curr. Opin. Cell Biol. 12:235–243. 10.1016/S0955-0674(99)00081-2 - DOI - PubMed
    1. Baarsma H.A., Engelbertink L.H., van Hees L.J., Menzen M.H., Meurs H., Timens W., Postma D.S., Kerstjens H.A., and Gosens R.. 2013. Glycogen synthase kinase-3 (GSK-3) regulates TGF-β₁-induced differentiation of pulmonary fibroblasts. Br. J. Pharmacol. 169:590–603. 10.1111/bph.12098 - DOI - PMC - PubMed
    1. Bonniaud P., Margetts P.J., Ask K., Flanders K., Gauldie J., and Kolb M.. 2005. TGF-beta and Smad3 signaling link inflammation to chronic fibrogenesis. J. Immunol. 175:5390–5395. 10.4049/jimmunol.175.8.5390 - DOI - PubMed

Publication types

MeSH terms

Associated data