. 2016 May 10:6:25713.
doi: 10.1038/srep25713.

Blast shockwaves propagate Ca(2+) activity via purinergic astrocyte networks in human central nervous system cells

Affiliations

Blast shockwaves propagate Ca(2+) activity via purinergic astrocyte networks in human central nervous system cells

Rea Ravin et al. Sci Rep. .

Abstract

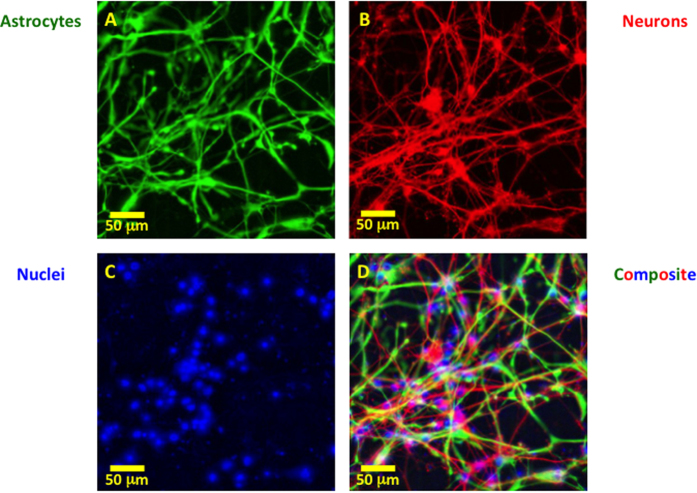
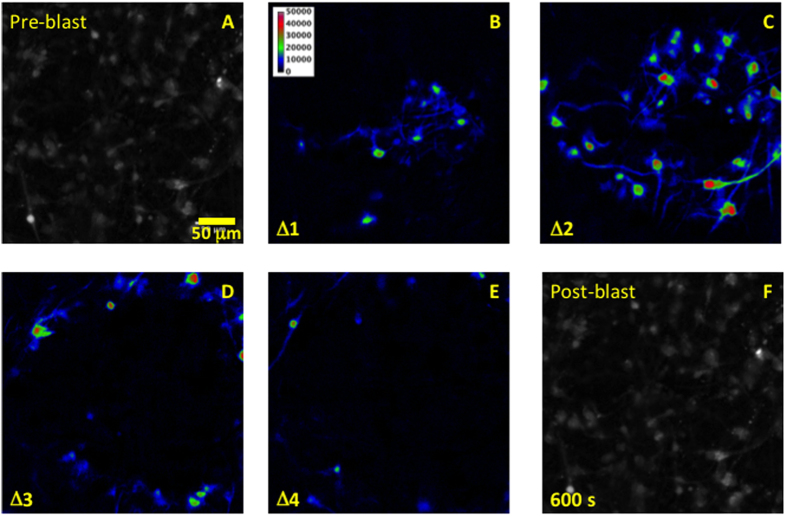
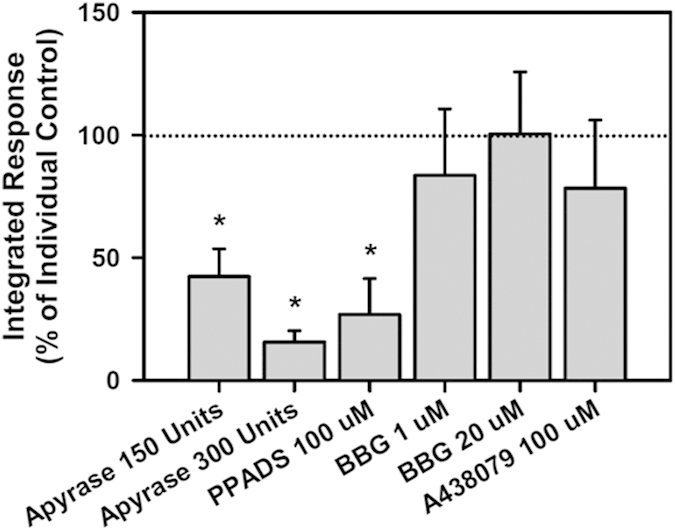
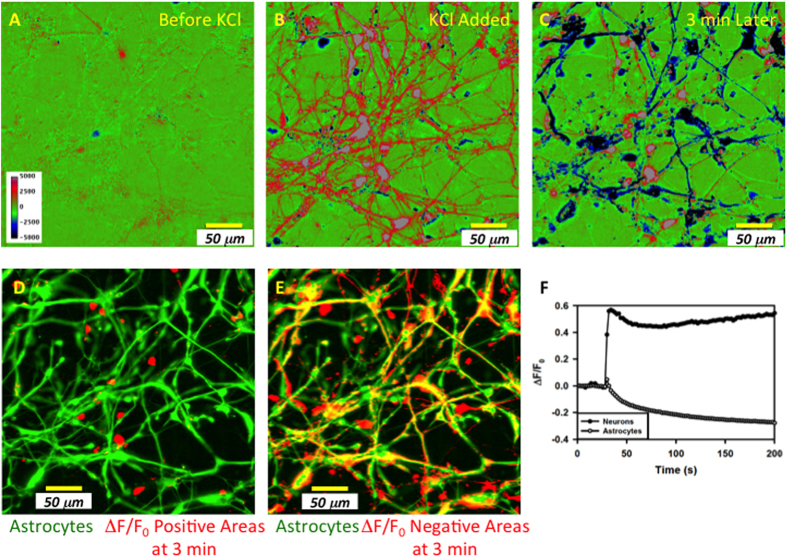
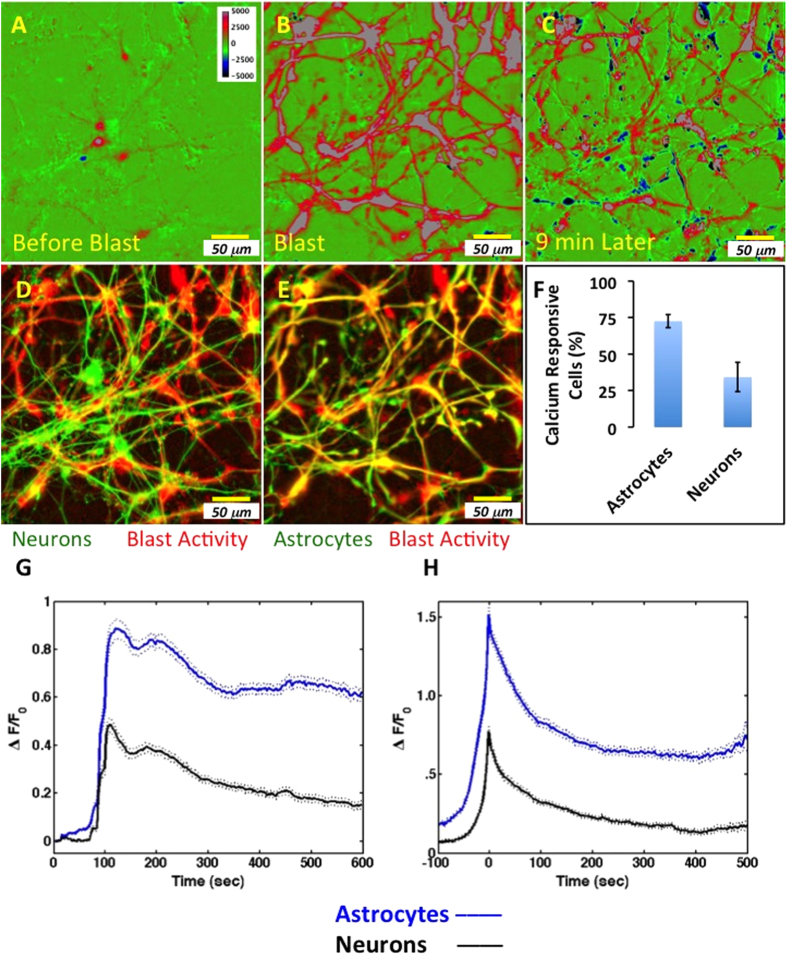
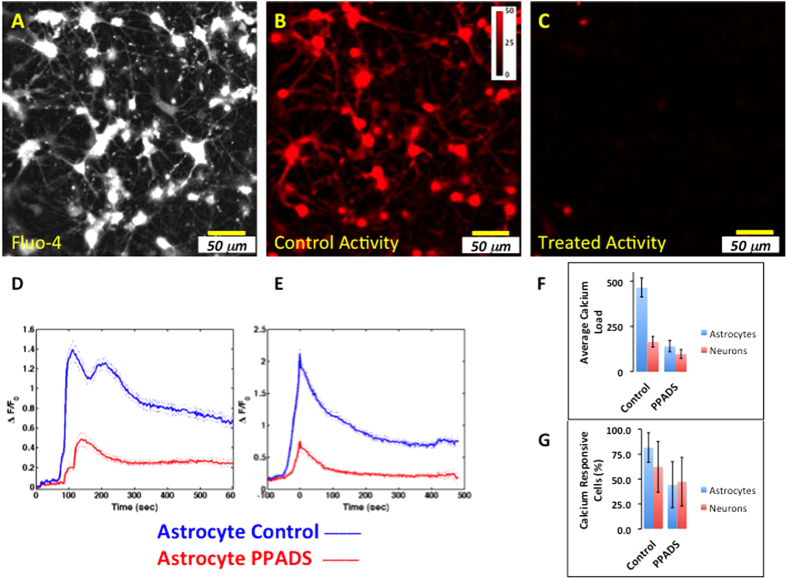
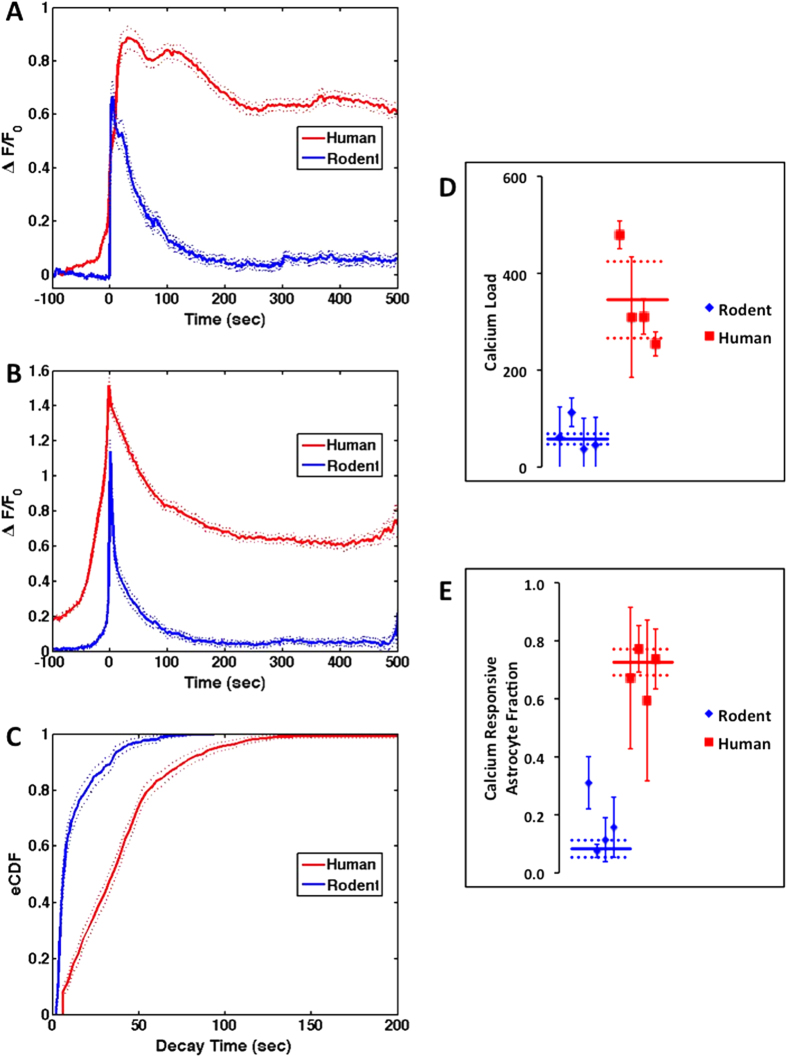
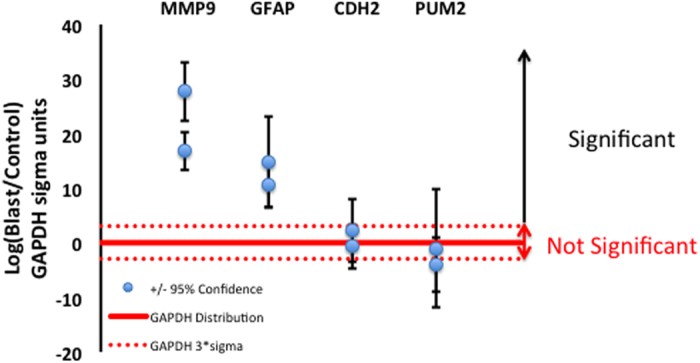
In a recent study of the pathophysiology of mild, blast-induced traumatic brain injury (bTBI) the exposure of dissociated, central nervous system (CNS) cells to simulated blast resulted in propagating waves of elevated intracellular Ca(2+). Here we show, in dissociated human CNS cultures, that these calcium waves primarily propagate through astrocyte-dependent, purinergic signaling pathways that are blocked by P2 antagonists. Human, compared to rat, astrocytes had an increased calcium response and prolonged calcium wave propagation kinetics, suggesting that in our model system rat CNS cells are less responsive to simulated blast. Furthermore, in response to simulated blast, human CNS cells have increased expressions of a reactive astrocyte marker, glial fibrillary acidic protein (GFAP) and a protease, matrix metallopeptidase 9 (MMP-9). The conjoint increased expression of GFAP and MMP-9 and a purinergic ATP (P2) receptor antagonist reduction in calcium response identifies both potential mechanisms for sustained changes in brain function following primary bTBI and therapeutic strategies targeting abnormal astrocyte activity.


Figures

Figure 1
Figure 1
Immunostaining of dissociated human fetal CNS culture (21 Days in culture) labeled with astrocyte marker, GFAP (A), neuronal marker TUJ1 and MAP2 (B), nuclei marker Hoechst (C), and the composite overlay (D). Scale bar, 50 μm.
Figure 2
Figure 2. Calcium propagated response to blast shock wave.
(A) Fluo-4 fluorescence image of the observation field prior to blast. (BE) Pseudo-color consecutive differences between images representing the changes in free calcium concentration over the first 5 seconds following simulated blast. (F) The fluorescence image of the observation field at the end of the experiment. No loss of indicator from cells, due to acute damage, was observed. Scale bar, 50 μm.
Figure 3
Figure 3. Calcium response to laser wounding propagates via purinergic signaling.
The calcium response significantly decreased in a dose-dependent manner following enzymatic degradation of ATP and ADP by apyrase (n = 4, 4, and 5 for 0, 150 and 300 Units apyrase, p = 0.002 single factor ANOVA). Comparable to apyrase, the non-specific purinergic blocker, PPADS significantly blocked the integrated response (n = 4 and 4 for 0 and 100 μM PPADS, normalized reduction 0.27 (0.29) (mean (SD)) while the P2X7 specific blockers BBG and A438079 were without effect (n = 4, 4, and 4 for 0, 1 and 20 μM BBG; p = 0.76 single factor ANOVA and n = 4 and 3 for 0 and 100 μM A430789, normalized reduction 0.78 (0.55) (mean (SD)). The dotted line at 100% represents the individual controls associated with each experiment.
Figure 4
Figure 4. Astrocytes and neurons can be distinguished based upon their calcium response to potassium.
Images A-C represent the calcium activity before (A), immediately after (B), and 3 minutes following the addition of KCl (C). The pseudo colors in images A-C represent the calcium activity around the mean activity observed prior to adding potassium. Positive activity (calcium increase above the mean) is in red/grey while negative activity (calcium decrease below the mean) is in blue/black. (D) Positive activity at 3 minutes (C) is represented in red and overlaid with the immunostaining for astrocytes, in green. No overlap between red and green is observed. (E) Negative activity at 3 minutes (C) now represented in red and overlaid with the immunostaining for astrocytes, in green; overlap, in yellow, is observed. (F) Average calcium activity in astrocytes and neurons using masks derived from (C) based on thresholds that separate the two populations. Scale bar, 50 μm.
Figure 5
Figure 5. Calcium activity in response to blast occurs primarily in astrocytes.
Images (AC) represent the calcium activity before blast (A), after blast (B), and 9 minutes following blast. The pseudo colors (AC) represent the calcium activity around the mean activity before the blast. (D) The activity represented in (B), in red, overlaid with the immunostaining for neurons, in green; note, minimal yellow consistent with minimal correspondence between activity and neurons. (E) The activity represented in (B), in red, overlaid with the immunostaining for astrocytes, in green; note, strong correspondence, indicated in yellow, between activity and astrocytes. (F) Percentage of calcium responsive astrocytes and neurons from their respective populations for all control blasts (mean +/− 95% confidence). (G) Average calcium activity, over all cells from 4 tissues, in astrocytes and neurons using masks derived from potassium challenge (mean, solid +/− 95% confidence, dotted, n = 1059 and 1173 astrocytes and neurons respectively, from 43 experiments). Simulated blast was triggered after ~100 seconds. (H) Peak centered average calcium activity in astrocytes and neurons of data presented in G. Scale bar, 50 μm.
Figure 6
Figure 6. Calcium response to blast propagates via purinergic signaling.
The same field of Fluo-4 labeled cells was exposed to blast in the presence and absence of PPADS. (A) Fluo-4 labeled cells. (B) Variance/Mean of the image sequence following the blast, control condition. (C) Variance/Mean of the image sequence following blast in the presence of PPADS. (D) Average calcium activity time course, in control and PPADS treated astrocytes using masks derived from KCl challenge (mean, solid +/− 95% confidence, dotted, n = 114, n = 7 matched experiments from 2 tissues). Simulated blast was triggered after ~100 seconds. (E) Peak centered average calcium activity time course in astrocytes and neurons of data presented in (D). (F) The calcium load (integrated response) in astrocytes is significantly decreased following PPADS treatment (140.98 +/− 31.23 vs. 465.17 +/− 52.82 mean +/− 95% confidence; p < 0.00001, 2-tailed unequal variance t-test). (G) The percentage of calcium responsive astrocytes was reduced significantly, to 44% +/− 23% (mean +/− 95% confidence) corresponding to an ~54% reduction in the number of responsive astrocytes while the fraction of calcium responsive neurons remained unchanged (n = 7, 8; p = 0.031 and 0.163, 1-tailed paired t-test, astrocytes and neurons, respectively. Scale bar, 50 μm.
Figure 7
Figure 7. Human astrocytes have a prolonged calcium response compared to rat astrocytes.
(A) Average calcium activity over all human and rat astrocytes responding to blast (red – human; blue – rat; mean, solid +/− 95% confidence, dotted, n = 4 and 4 independent tissues, 43 and 91 experiments and total astrocytes, 1059 and 1910, human and rat, respectively). (B) Peak centered average calcium activity highlights both the faster rise and decay times observed in rat and the response persistence observed in human. (C) The exponentially distributed response decay times (eCDF) are significantly longer in human astrocytes. (D) The calcium load (integrated response) in human astrocytes is greater across all 4 independent tissues compared to rat. Symbols represent weighted individual tissue means +/− 95% confidences while solid/dotted lines correspond to means +/− 95% confidences over all tissues. (E) The calcium responsive astrocyte fraction in human astrocytes is greater across all 4 independent tissues compared to rat. Symbols represent weighted tissue means +/− 95% confidences while solid/dotted lines correspond to means +/− 95% confidences over all tissues.
Figure 8
Figure 8. Blast-like shockwaves increase GFAP and MMP-9 expression in human CNS cells.
Four genes related to TBI were evaluated 24 hours following blast stimulation; data from two independent experiments are shown. MMP-9 and GFAP were significantly elevated compared to control. Expression of CDH2 and PUM2 was not significantly different. Significance was evaluated using a 3 sigma threshold (99.7% probability; dotted red line) derived from analysis of the reference gene GAPDH (solid red line).

Similar articles

Cited by

References

    1. Tate C. M. et al.. Serum brain biomarker level, neurocognitive performance, and self-reported symptom changes in soldiers repeatedly exposed to low-level blast: a breacher pilot study. J. Neurotrauma 30, 1620–1630, doi: 10.1089/neu.2012.2683 (2013). - DOI - PubMed
    1. Ling G., Bandak F., Armonda R., Grant G. & Ecklund J. Explosive blast neurotrauma. J. Neurotrauma 26, 815–825, doi: 10.1089/neu.2007.0484 (2009). - DOI - PubMed
    1. Chen Y. C., Smith D. H. & Meaney D. F. In-vitro approaches for studying blast-induced traumatic brain injury. J. Neurotrauma 26, 861–876, doi: 10.1089/neu.2008.0645 (2009). - DOI - PMC - PubMed
    1. Nakagawa A. et al.. Mechanisms of primary blast-induced traumatic brain injury: insights from shock-wave research. J. Neurotrauma 28, 1101–1119, doi: 10.1089/neu.2010.1442 (2011). - DOI - PubMed
    1. Scott S. G., Belanger H. G., Vanderploeg R. D., Massengale J. & Scholten J. Mechanism-of-injury approach to evaluating patients with blast-related polytrauma. J. Am. Osteopath. Assoc. 106, 265–270 (2006). - PubMed

Publication types