

Mitochondrial dysfunction and oxidative stress in patients with chronic kidney disease
- PMID: 27162261
- PMCID: PMC4873632
- DOI: 10.14814/phy2.12780
Mitochondrial dysfunction and oxidative stress in patients with chronic kidney disease
Abstract
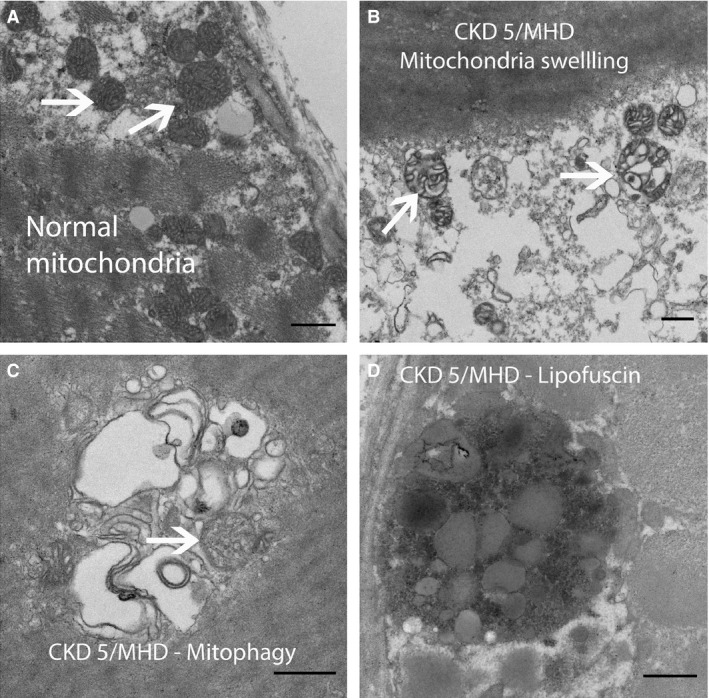
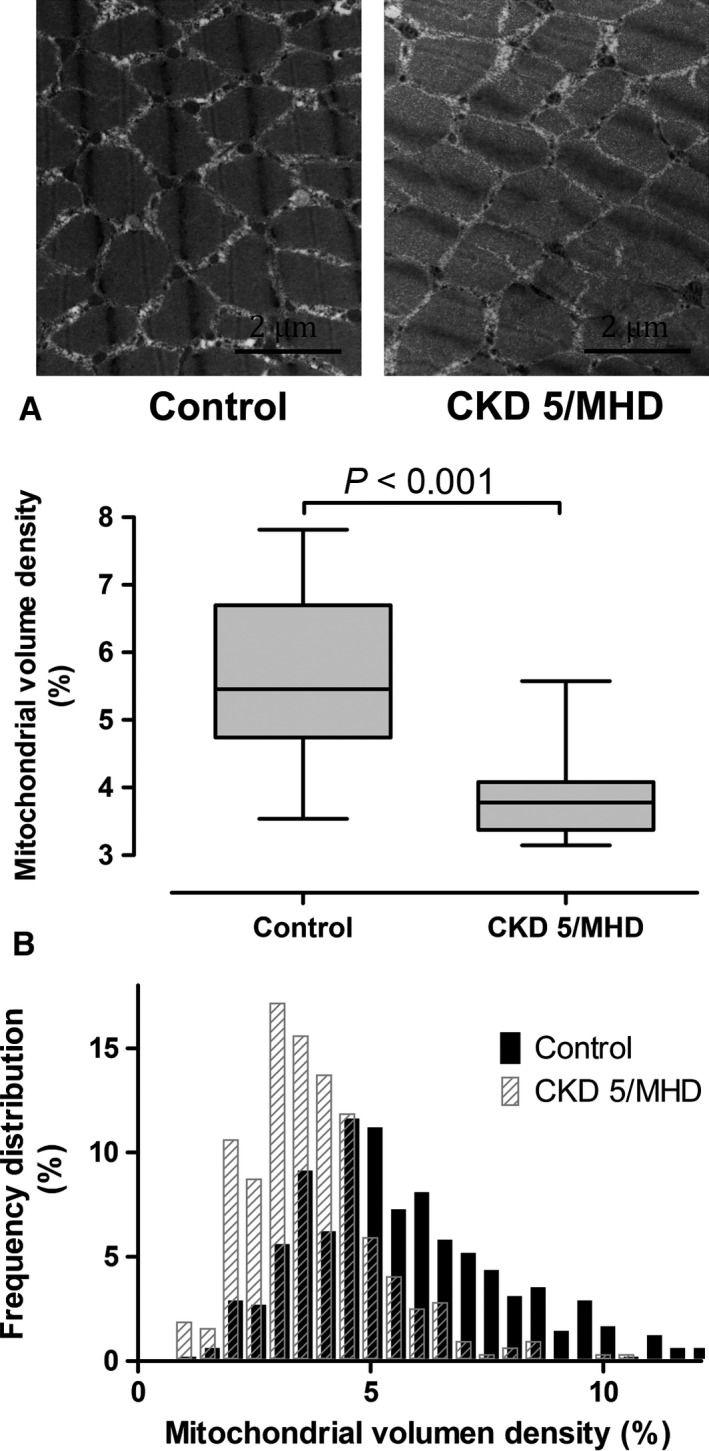
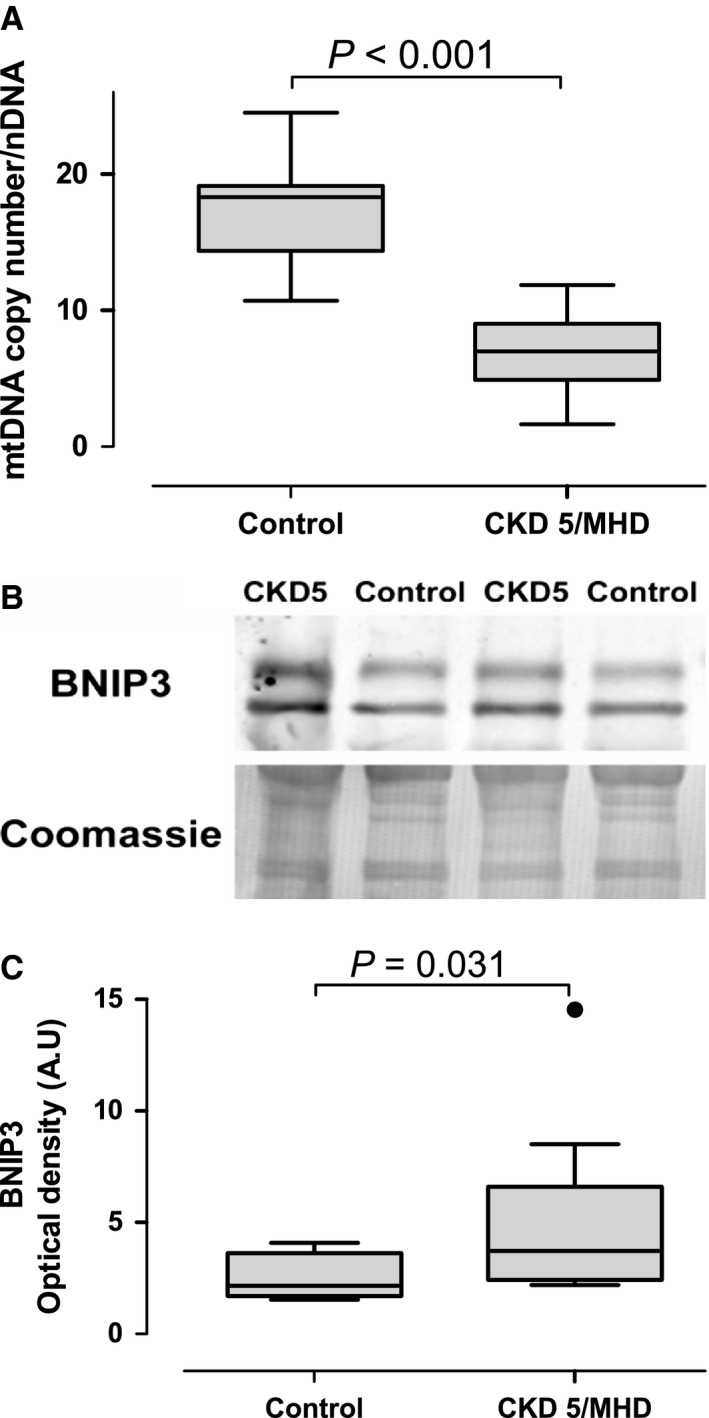
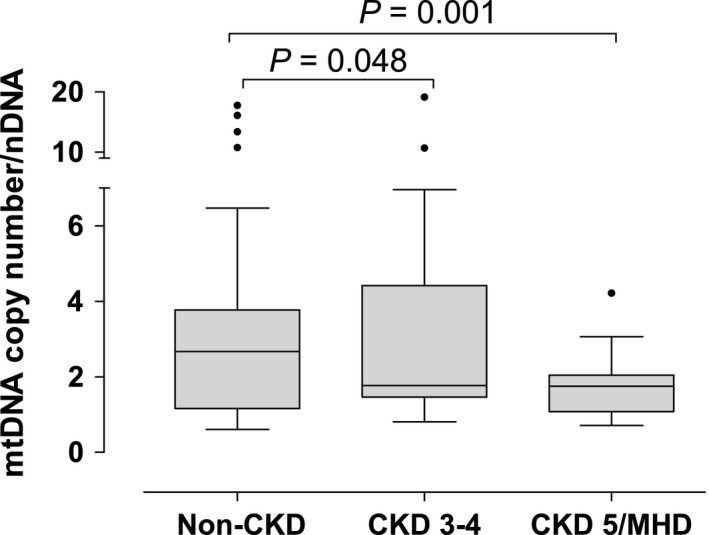
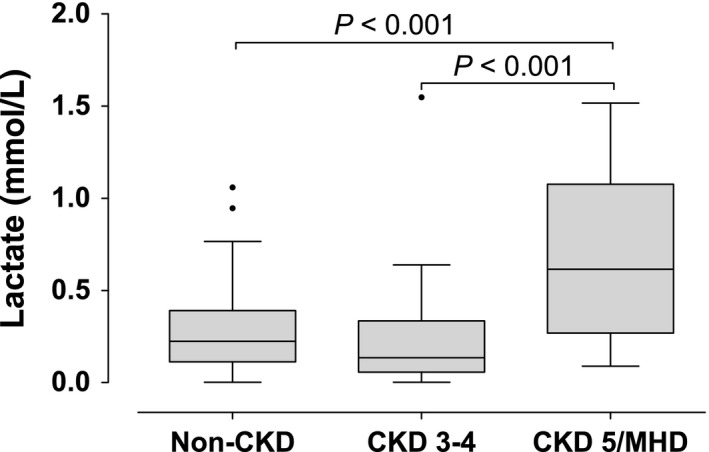
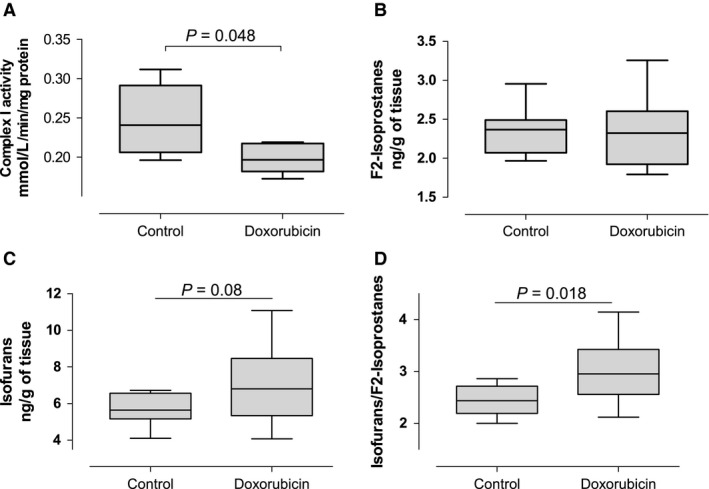
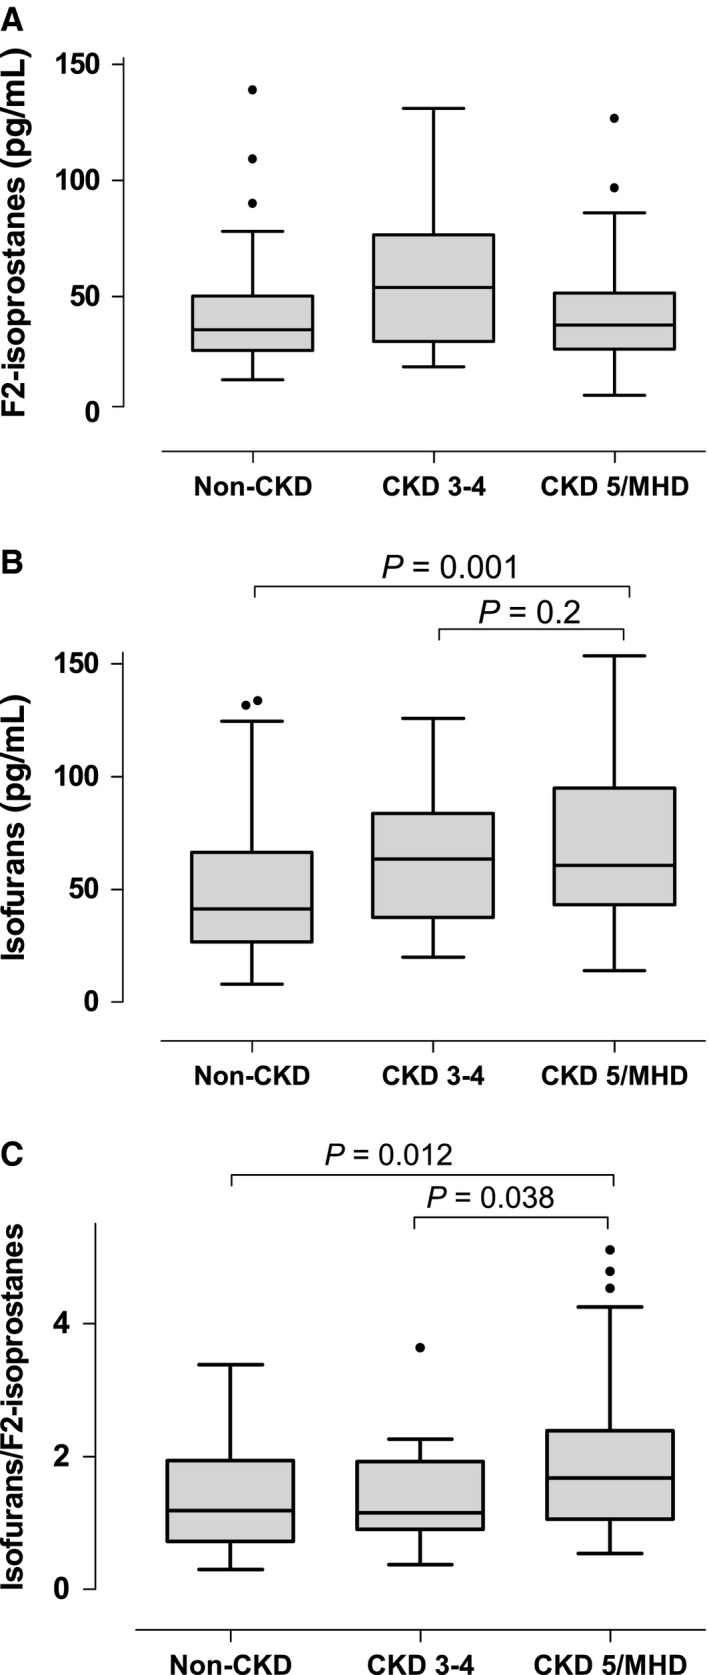
Mitochondria abnormalities in skeletal muscle may contribute to frailty and sarcopenia, commonly present in patients with chronic kidney disease (CKD). Dysfunctional mitochondria are also a major source of oxidative stress and may contribute to cardiovascular disease in CKD We tested the hypothesis that mitochondrial structure and function worsens with the severity of CKD Mitochondrial volume density, mitochondrial DNA (mtDNA) copy number, BNIP3, and PGC1α protein expression were evaluated in skeletal muscle biopsies obtained from 27 subjects (17 controls and 10 with CKD stage 5 on hemodialysis). We also measured mtDNA copy number in peripheral blood mononuclear cells (PBMCs), plasma isofurans, and plasma F2-isoprostanes in 208 subjects divided into three groups: non-CKD (eGFR>60 mL/min), CKD stage 3-4 (eGFR 60-15 mL/min), and CKD stage 5 (on hemodialysis). Muscle biopsies from patients with CKD stage 5 revealed lower mitochondrial volume density, lower mtDNA copy number, and higher BNIP3 content than controls. mtDNA copy number in PBMCs was decreased with increasing severity of CKD: non-CKD (6.48, 95% CI 4.49-8.46), CKD stage 3-4 (3.30, 95% CI 0.85-5.75, P = 0.048 vs. non-CKD), and CKD stage 5 (1.93, 95% CI 0.27-3.59, P = 0.001 vs. non-CKD). Isofurans were higher in patients with CKD stage 5 (median 59.21 pg/mL, IQR 41.76-95.36) compared to patients with non-CKD (median 49.95 pg/mL, IQR 27.88-83.46, P = 0.001), whereas F2-isoprostanes did not differ among groups. Severity of CKD is associated with mitochondrial dysfunction and markers of oxidative stress. Mitochondrial abnormalities, which are common in skeletal muscle from patients with CKD stage 5, may explain the muscle dysfunction associated with frailty and sarcopenia in CKD Further studies are required to evaluate mitochondrial function in vivo in patients with different CKD stages.
Keywords: BNIP3; PGC1α; chronic kidney disease; mitochondria; mitochondrial DNA copy number; oxidative stress; skeletal muscle.
© 2016 The Authors. Physiological Reports published by Wiley Periodicals, Inc. on behalf of the American Physiological Society and The Physiological Society.
Figures
References
-
- Adey, D. , Kumar R., McCarthy J. T., and Nair K. S.. 2000. Reduced synthesis of muscle proteins in chronic renal failure. Am. J. Physiol. Endocrinol. Metab. 278:E219–E225. - PubMed
-
- Ahonen, R. E. 1980. Striated muscle ultrastructure in uremic patients and in renal transplant recipients. Acta Neuropathol. 50:163–166. - PubMed
-
- Ballinger, S. W. , Patterson C., Knight‐Lozano C. A., Burow D. L., Conklin C. A., Hu Z., et al. 2002. Mitochondrial integrity and function in Atherogenesis. Circulation 106:544–549. - PubMed
-
- Baron, A. D. , Brechtel‐Hook G., Johnson A., and Hardin D.. 1993. Skeletal muscle blood flow. A possible link between insulin resistance and blood pressure. Hypertension 21:129–135. - PubMed
Publication types
MeSH terms
Grants and funding
- 5R01HL065193/HL/NHLBI NIH HHS/United States
- F32AR061946/AR/NIAMS NIH HHS/United States
- R01GM112871/GM/NIGMS NIH HHS/United States
- K23DK100533/DK/NIDDK NIH HHS/United States
- 1UL-1RR024975/RR/NCRR NIH HHS/United States
- K23 GM102676/GM/NIGMS NIH HHS/United States
- R01 HL065193/HL/NHLBI NIH HHS/United States
- F32 AR061946/AR/NIAMS NIH HHS/United States
- R01 GM112871/GM/NIGMS NIH HHS/United States
- DK020593/DK/NIDDK NIH HHS/United States
- K24 DK062849/DK/NIDDK NIH HHS/United States
- K23GM102676/GM/NIGMS NIH HHS/United States
- UL1 RR024975/RR/NCRR NIH HHS/United States
- K24DK062849/DK/NIDDK NIH HHS/United States
- T32GM07569/GM/NIGMS NIH HHS/United States
- K23 DK100533/DK/NIDDK NIH HHS/United States
- K23 DK099442/DK/NIDDK NIH HHS/United States
LinkOut - more resources
Full Text Sources
Other Literature Sources
Medical
Research Materials
Miscellaneous
