. 2016 May 24;113(21):6029-34.
doi: 10.1073/pnas.1605707113. Epub 2016 May 9.

Prevalent presence of periodic actin-spectrin-based membrane skeleton in a broad range of neuronal cell types and animal species

Affiliations

Prevalent presence of periodic actin-spectrin-based membrane skeleton in a broad range of neuronal cell types and animal species

Jiang He et al. Proc Natl Acad Sci U S A. .

Abstract

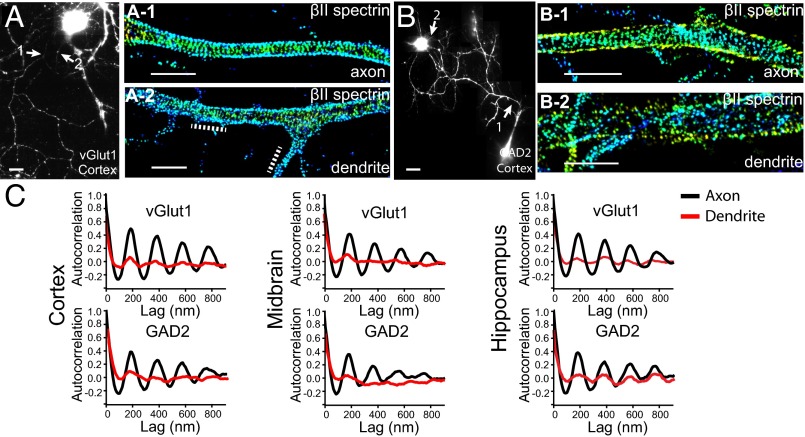
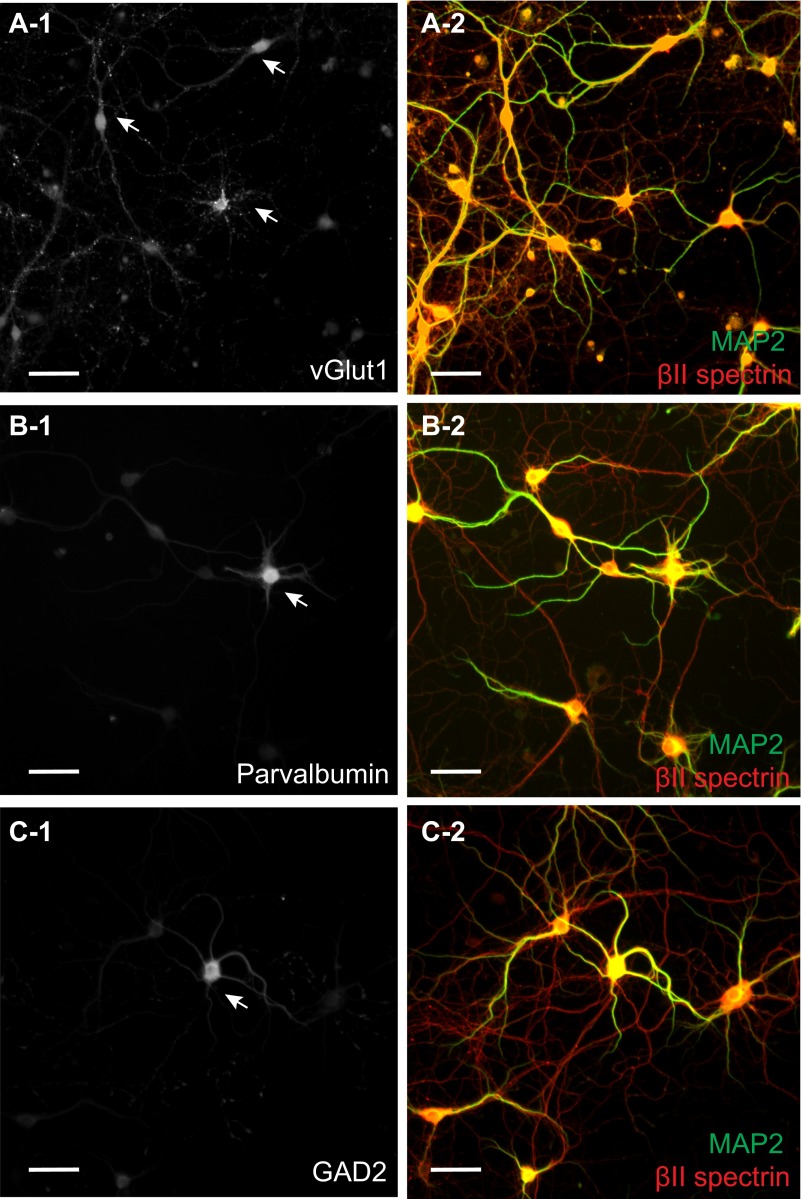
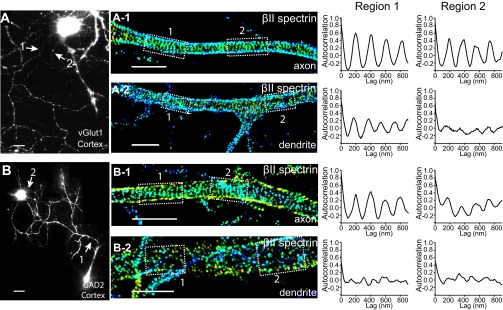
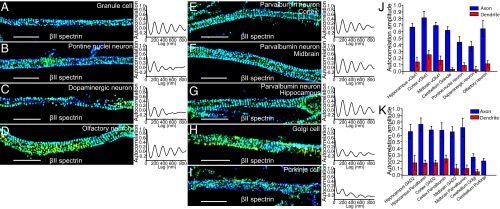
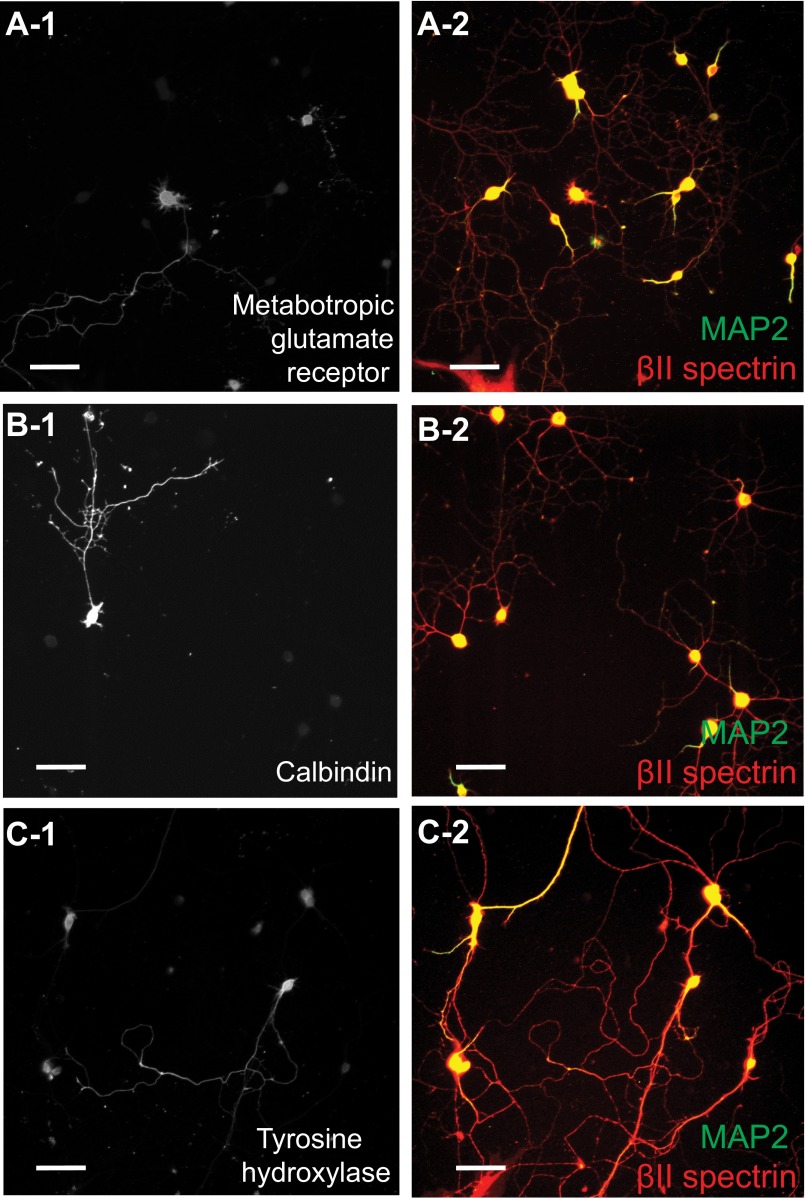
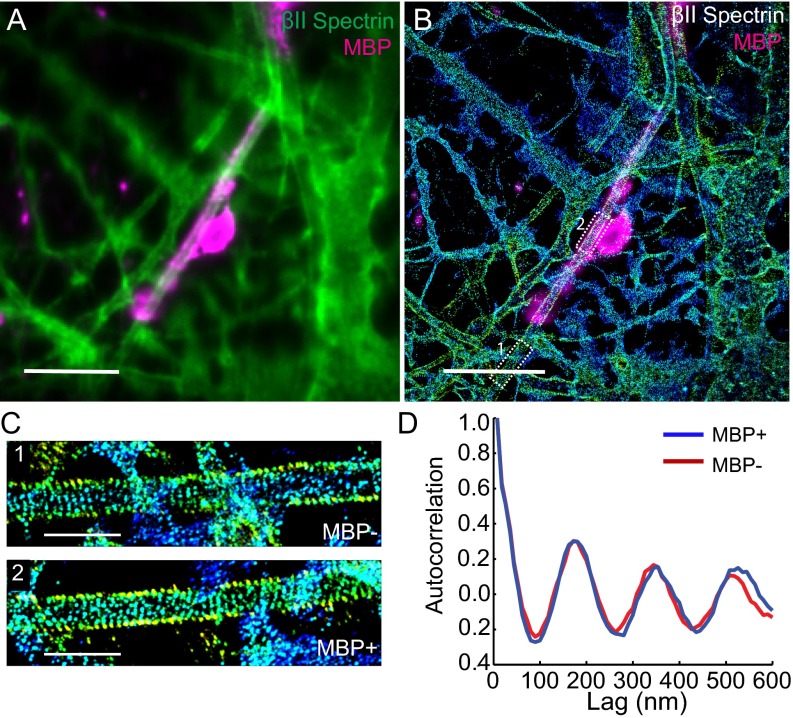
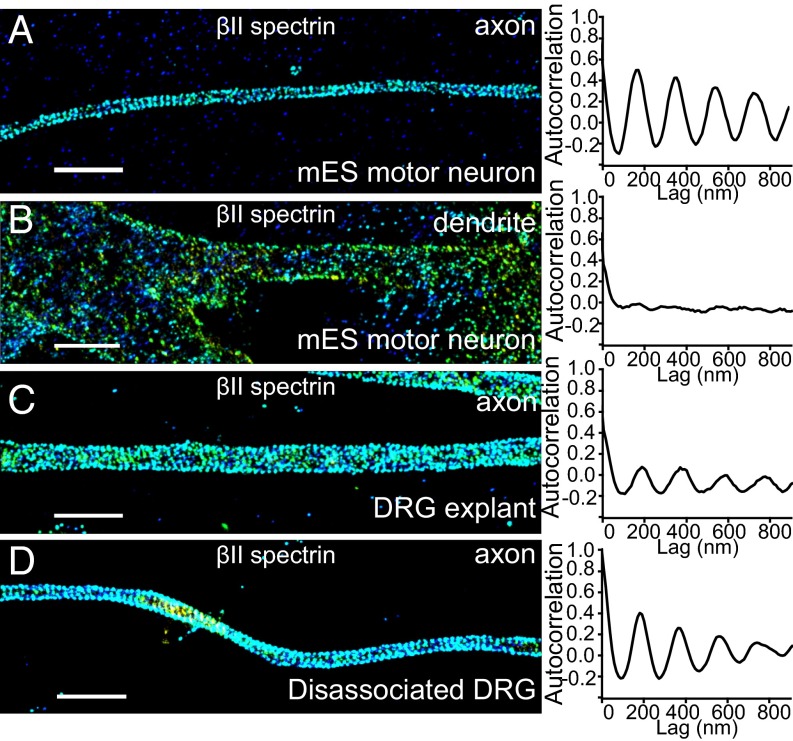
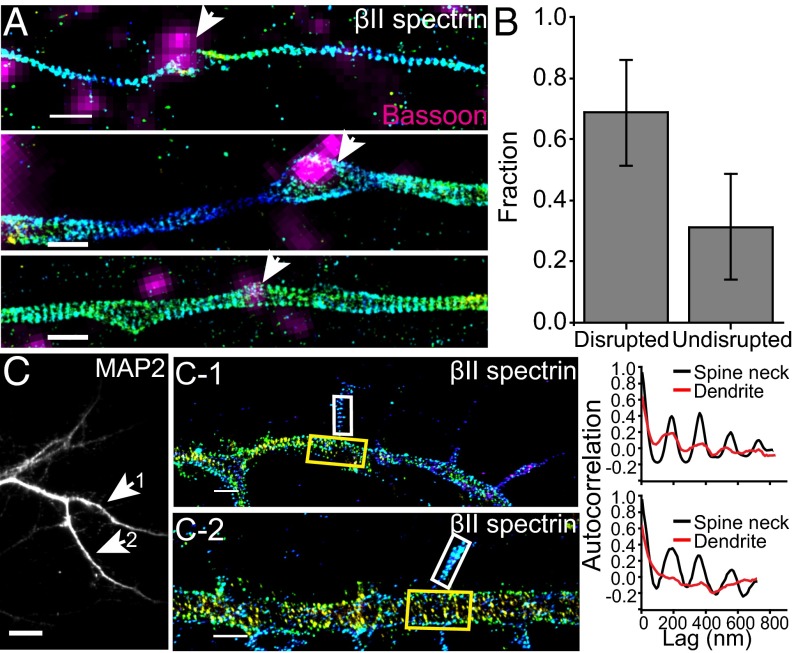
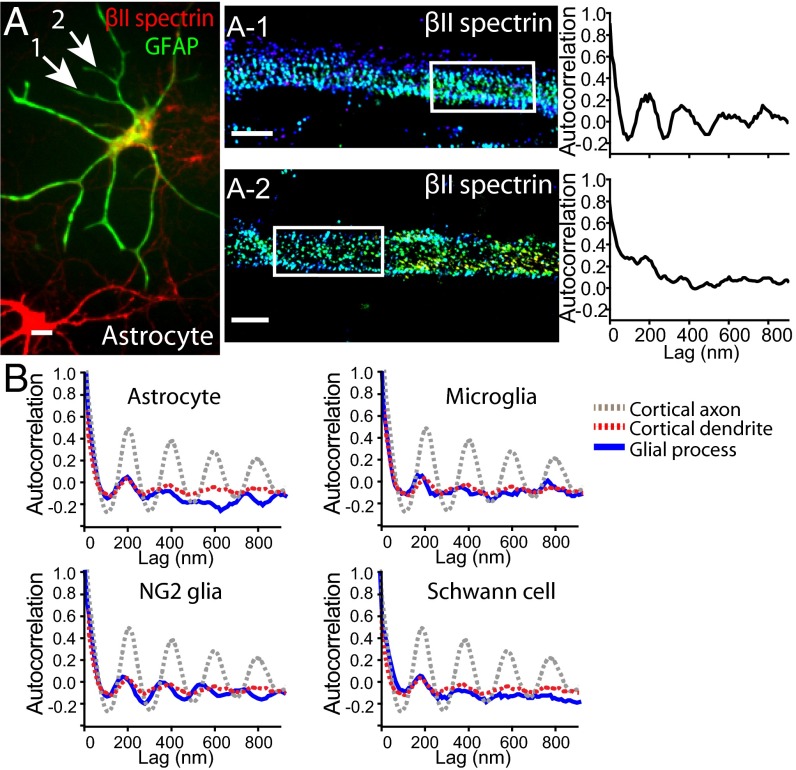
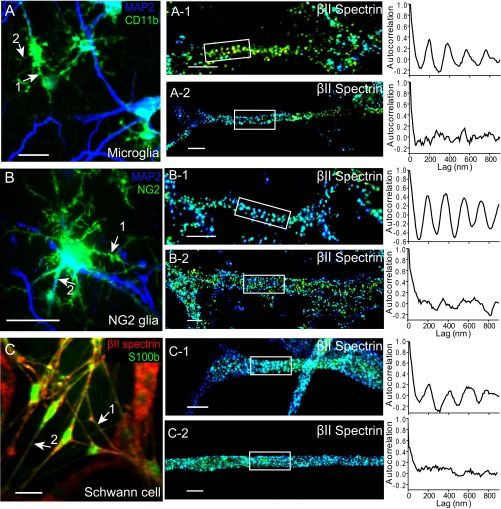
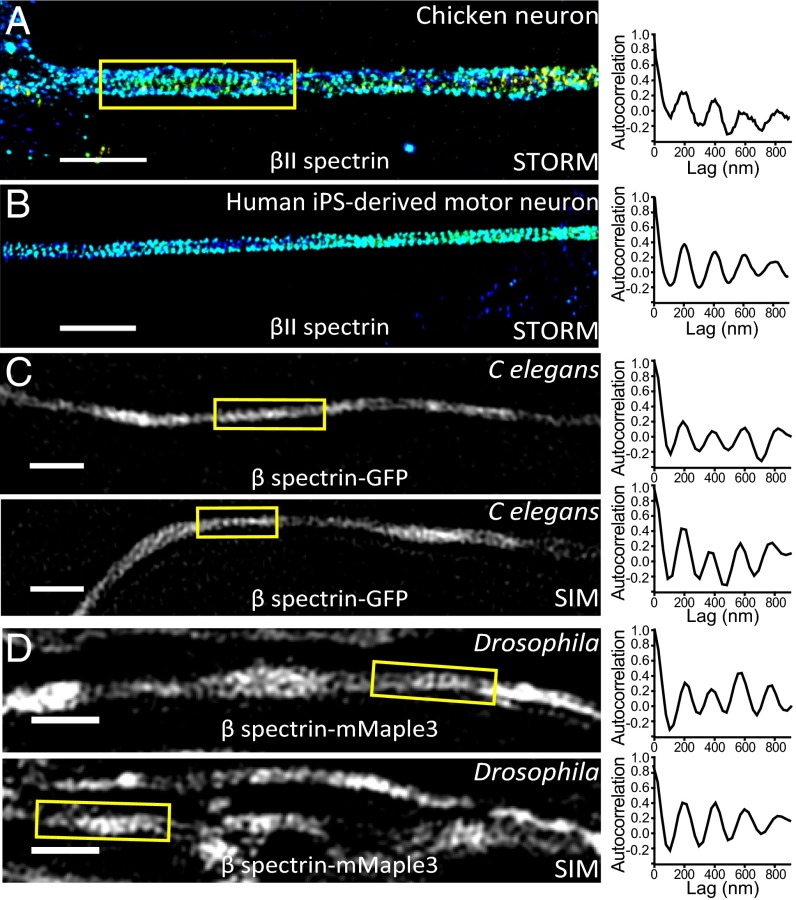
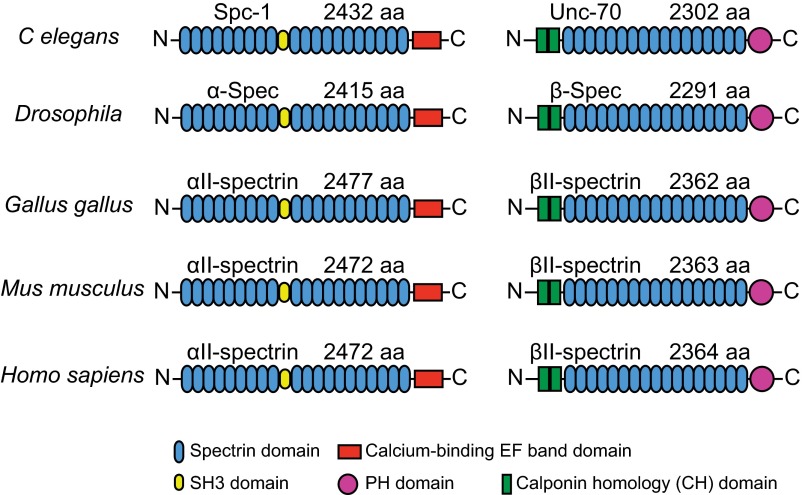
Actin, spectrin, and associated molecules form a periodic, submembrane cytoskeleton in the axons of neurons. For a better understanding of this membrane-associated periodic skeleton (MPS), it is important to address how prevalent this structure is in different neuronal types, different subcellular compartments, and across different animal species. Here, we investigated the organization of spectrin in a variety of neuronal- and glial-cell types. We observed the presence of MPS in all of the tested neuronal types cultured from mouse central and peripheral nervous systems, including excitatory and inhibitory neurons from several brain regions, as well as sensory and motor neurons. Quantitative analyses show that MPS is preferentially formed in axons in all neuronal types tested here: Spectrin shows a long-range, periodic distribution throughout all axons but appears periodic only in a small fraction of dendrites, typically in the form of isolated patches in subregions of these dendrites. As in dendrites, we also observed patches of periodic spectrin structures in a small fraction of glial-cell processes in four types of glial cells cultured from rodent tissues. Interestingly, despite its strong presence in the axonal shaft, MPS is disrupted in most presynaptic boutons but is present in an appreciable fraction of dendritic spine necks, including some projecting from dendrites where such a periodic structure is not observed in the shaft. Finally, we found that spectrin is capable of adopting a similar periodic organization in neurons of a variety of animal species, including Caenorhabditis elegans, Drosophila, Gallus gallus, Mus musculus, and Homo sapiens.

Keywords: STORM; actin; cytoskeleton; neuron; spectrin.


Conflict of interest statement

The authors declare no conflict of interest.

Figures

Fig. 1.
Fig. 1.
The MPS structure is present in both excitatory and inhibitory neurons from mouse cortex, midbrain, and hippocampus. Cultured neurons were immunostained with vGlut1 or GAD2 to label the excitatory and inhibitory neurons, respectively. (A) Reconstructed conventional image of a vGlut1+ cortical neuron shown together with 3D STORM images of βII spectrin in an axonal (A-1) and dendritic (A-2) region. The axonal (A-1) and dendritic (A-2) regions correspond to the regions indicated by arrows in A. Dotted lines in A-2 indicate patches of periodic pattern in the dendritic shaft. In 3D STORM images, localizations at different z values are depicted in different colors. (B, B-1, and B-2) Similar to A, A-1, and A-2 but for a GAD2+ cortical neuron. (C) Averaged autocorrelation functions calculated from multiple, randomly selected axonal (black) and dendritic (red) regions in neurons cultured from cortex (n = 18 for axons and n = 9 for dendrites of GAD2+ neurons; n = 9 for axons and n = 8 for dendrites of vGlut1+ neurons), midbrain (n = 8 for axons and n = 7 for dendrites of GAD2+ neurons; n = 13 for axons and n = 11 for dendrites of vGlut1+ neurons), and hippocampus (n = 6 for axons and n = 8 for dendrites of GAD2+ neurons; n = 8 for axons and n = 9 for dendrites of vGlut1+ neurons), respectively. (Scale bar: 20 µm for conventional images and 2 µm for STORM images.)
Fig. S1.
Fig. S1.
Immunolabeling of excitatory and inhibitory neurons with specific markers. (A-1 and A-2) Hippocampal neurons were fixed at DIV 10 and immunostained against vGlut1 (A-1: an excitatory neuron maker) as well as MAP2 (A-2: green) and βII spectrin (A-2: red). The specificity of vGlut1 staining is evident from the fluorescent intensity contrast observed between the arrow-marked neurons and other neurons in the field of view (A-1). (B-1 and B-2) Similar to A-1 and A-2 except that the neurons were immunostained against parvalbumin, an inhibitory neuron marker. (C-1 and C-2) Similar to A-1 and A-2 except the neurons were immunostained against GAD2, an inhibitory neuron marker. (Scale bar: 50 µm.)
Fig. S2.
Fig. S2.
βII spectrin is organized into a periodic structure in both excitatory and inhibitory neurons from mouse cortex. Cultured neurons from mouse cortex were immunostained with vGlut1 or GAD2 to label the excitatory and inhibitory neurons, respectively. (A) Reconstructed conventional image of a vGlut1+ cortical neuron. (A-1 and A-2) 3D STORM images of βII spectrin in an axonal (A-1) and dendritic (A-2) region indicated by arrows in A. (Right panels) Autocorrelation functions of the selected boxed regions in the STORM images. (B, B-1, and B-2) Similar to A, A-1, and A-2 but for a GAD2+ inhibitory neuron. (Scale bar: 20 µm for conventional images and 2 µm for STORM images.)
Fig. S3.
Fig. S3.
βII spectrin is organized into a periodic structure in both excitatory and inhibitory neurons from mouse hippocampus. Cultured neurons from mouse hippocampus were immunostained with vGlut1 or GAD2 to label the excitatory and inhibitory neurons, respectively. (A) Reconstructed conventional image of a vGlut1+ hippocampal neuron. 3D STORM images of βII spectrin in an axonal (A-1) and dendritic (A-2) region indicated by arrows in A. (Right panels) Autocorrelation functions of the selected boxed regions in the A-1 and A-2 STORM images. (B, B-1, and B-2) Similar to A, A-1, and A-2, but for a GAD2+ inhibitory neuron. (Scale bar: 20 µm for conventional images and 2 µm for STORM images.)
Fig. S4.
Fig. S4.
βII spectrin is organized into a periodic structure in both excitatory and inhibitory neurons from mouse midbrain. Cultured neurons from mouse midbrain were immunostained with vGlut1 or GAD2 to label the excitatory and inhibitory neurons, respectively. (A) Reconstructed conventional image of a vGlut1+ midbrain neuron. (A-1 and A-2) 3D STORM images of βII spectrin in an axonal (A-1) and dendritic (A-2) region indicated by arrows in A. (Right panels) Autocorrelation functions of the selected boxed regions in the A-1 and A-2 STORM images. (B, B-1, and B-2) Similar to A, A-1, and A-2 but for a GAD2+ inhibitory neuron. (Scale bar: 20 µm for conventional images and 2 µm for STORM images.)
Fig. 2.
Fig. 2.
MPS is present in multiple subtypes of inhibitory and excitatory neurons in the mouse central nervous system. (A–I) Representative STORM images of βII spectrin for a typical axonal region (Left panels in AI) and averaged autocorrelation functions from multiple axons (Right panels AI) for cultured cerebellar granule cells (A; n = 7 for averaged autocorrelation calculation), Pontine nuclei neurons (B; n = 7), dopaminergic neurons (C; n = 9), olfactory neurons (D; n = 16), Parvalbumin neurons from cortex (E; n = 9), Parvalbumin neurons from midbrain (F; n = 6), Parvalbumin neurons from hippocampus (G; n = 13), Golgi cells (H; n = 8), and Purkinje cells (I; n = 7) from cerebellum. (J and K) Averaged autocorrelation amplitudes of axons (blue) versus dendrites (red) for the neuronal subtypes we imaged in the mouse central nervous system. Error bars are SEM. (Scale bar: 2 µm.)
Fig. S5.
Fig. S5.
Identification of some specific subtypes of neurons from mouse central nervous system using specific markers. Neurons from different regions of the central nervous system were cultured for at least 10 days in vitro and then immunostained with a specific neuronal marker (A-1, B-1, and C-1) as well as MAP2 (green; A-2, B-2, and C-2) and βII spectrin (red; A-2, B-2, and C-2). (A-1 and A-2) Golgi cells from cerebellum are marked by metabotropic glutamate receptor staining. (B-1 and B-2) Purkinje cells from cerebellum are marked by calbindin staining. (C-1 and C-2) Dopaminergic neurons from midbrain are marked by tyrosine hydroxylase staining. (Scale bar: 50 µm.)
Fig. S6.
Fig. S6.
In vitro myelination does not affect the formation of the MPS structure. Hippocampal neurons were cultured for 2 wk before adding the glia cells. After coculturing for 6 wk, the cells were fixed and immunostained with βII spectrin (green) and MBP (myelination marker, magenta). (A) Conventional image of neurons showing a myelinated axon (shown in magenta). (Scale bar: 10 µm.) (B) 3D STORM image of βII spectrin in the same area as in A. The myelin sheath was shown in magenta and imaged at the conventional resolution. βII spectrin adopts a highly periodic structure in both the myelinated and unmyelinated regions along the axon. (Scale bar: 10 µm.) (C) Zoom-in 3D STORM image of βII spectrin from the two boxed regions from B). (Scale bar: 2 µm.) (D) Averaged autocorrelation functions of βII-spectrin distribution calculated from multiple MBP+ and MBP− axons (n = 7 each).
Fig. 3.
Fig. 3.
MPS is present in mouse peripheral sensory and motor axons. (A) Representative STORM images of βII spectrin for a typical axonal region (Left) and averaged autocorrelation functions from multiple axons (Right, n = 12) for mES-derived motor neurons. (B) Same as in A but for dendrites in mES-derived motor neurons (n = 11). (C and D) Same as A but for axons in DRG neurons (C, explants, n = 13; D, dissociated DRG culture, n = 10). (Scale bar: 2 µm.)
Fig. 4.
Fig. 4.
The distribution of βII spectrin in axonal boutons and dendritic spines. (A) Representative STORM images of βII spectrin in axons that contain presynaptic boutons marked by a presynaptic marker, Bassoon (magenta). βII spectrin is labeled by expressing GFP-βII spectrin (or GFP-αII spectrin) in a sparse subset of cultured neurons, and hence some bassoon-positive regions do not overlap with the GFP-positive axon. (Top and Middle) Examples of bassoon-positive presynaptic boutons (indicated by arrow) within which the periodic pattern of spectrin is disrupted. (Bottom) An example of bassoon-positive presynaptic bouton (indicated by arrow) within which the period pattern of spectrin is not disrupted. (B) Bar graph depicting relative fraction of boutons in which the periodic structure is disrupted or undisrupted. (C) The dendritic region of a cultured mouse hippocampal neuron immunostained with MAP2, a dendrite marker. (C-1 and C-2) STORM images of two selected regions showing periodic patterns of immunolabeled endogenous βII spectrin in spine necks (Left panels) with autocorrelation functions (Right panels) calculated from the boxed spine neck region (white boxes) and dendritic shaft (yellow boxes). (Scale bar: 10 µm for conventional images and 1 µm for STORM images.)
Fig. 5.
Fig. 5.
Sparse presence of the periodic βII spectrin structure in glial cell processes. (A) An astrocyte stained for the astrocyte marker GFAP (green) and βII spectrin (red). (A-1 and A-2) STORM images of βII spectrin from two processes of that astrocyte (indicated by arrows) displaying relatively periodic (A-1) or irregular (A-2) spectrin distribution. (Right panels) Autocorrelation analysis of the boxed regions. (B) Averaged autocorrelation functions (blue) calculated from multiple randomly selected processes of astrocytes, microglia cells, NG2 glia, and Schwann cells (n = 10 for astrocytes, n = 9 for microglia, n = 8 for NG2 glia, n = 9 for Schwann cells). For comparison, the dotted gray and red curves show the averaged autocorrelation functions of βII spectrin distribution in axons and dendrites of cortical vGlut1+ neurons, respectively (reproduced from Fig. 1C). (Scale bar: 20 µm for conventional image and 1 µm for STORM images.)
Fig. S7.
Fig. S7.
The distribution of βII spectrin in the processes of microglia, NG2 glia and Schwann cells. (A) Conventional image of neurons and microglial cells stained with the microglia marker CD11b (green) and MAP2 (blue). The microglial cells in the field of view appear green. (A-1 and A-2) Selected 3D STORM images of βII spectrin from the process of a microglial cell (indicated by arrows in A) displaying relatively periodic (A-1) or irregular (A-2) spectrin distribution. (Right) Autocorrelation functions from the boxed regions. (B, B-1, and B-2) Similar to A, A-1, and A-2 but for a NG2+ glial cell labeled by NG2 (green). MAP2 staining is shown in blue. (C, C-1, and C-2) Similar to A, A-1, and A-2 but for Schwann cells labeled with the Schwann cell marker S100b (green). βII-spectrin staining is shown in red. (Scale bar: 20 µm for conventional images and 1 µm for STORM images.)
Fig. 6.
Fig. 6.
The observation of MPS in neurons across different animal species. (A) Representative STORM image of immunolabeled βII spectrin in the axon of a cultured chicken neuron (Left) and the autocorrelation function calculated from the boxed region in this image (Right). (Scale bar: 2 µm.) (B) Representative STORM image of immunolabeled βII spectrin in the axon of a human iPS-derived motor neuron (Left) and the autocorrelation function calculated from this image (Right). (Scale bar: 2 µm.) (C) Two representative SIM images of β spectrin (UNC-70)-GFP in C. elegans neurons imaged directly in the animals (Left), and the corresponding autocorrelation functions of the boxed regions (Right). (Scale bar: 1 µm.) (D) Two representative SIM images of β spectrin-mMaple3 in Drosophila neurons imaged in Drosophila brain tissues (Left) and the corresponding autocorrelation functions of the boxed regions (Right). (Scale bar: 1 µm.)
Fig. S8.
Fig. S8.
Structural domain organization of α and β spectrin across different species. The structural domains of αII and βII spectrin homologs, including spectrin domain (blue), SH3 domain (yellow), calcium-binding EF band domain (red), PH domain (magenta), and calponin homology (CH, green) domain from C. elegans, Drosophila, G. gallus, Mus musculus, and H. sapiens. Also shown are the lengths of these proteins in terms of the number of amino acids (aa).

References

    1. Luo L. Actin cytoskeleton regulation in neuronal morphogenesis and structural plasticity. Annu Rev Cell Dev Biol. 2002;18:601–635. - PubMed
    1. Cingolani LA, Goda Y. Actin in action: The interplay between the actin cytoskeleton and synaptic efficacy. Nat Rev Neurosci. 2008;9(5):344–356. - PubMed
    1. Stiess M, Bradke F. Neuronal polarization: The cytoskeleton leads the way. Dev Neurobiol. 2011;71(6):430–444. - PubMed
    1. Hammarlund M, Jorgensen EM, Bastiani MJ. Axons break in animals lacking beta-spectrin. J Cell Biol. 2007;176(3):269–275. - PMC - PubMed
    1. Galiano MR, et al. A distal axonal cytoskeleton forms an intra-axonal boundary that controls axon initial segment assembly. Cell. 2012;149(5):1125–1139. - PMC - PubMed

Publication types