. 2016 May 24;113(21):E3012-21.
doi: 10.1073/pnas.1520693113. Epub 2016 May 9.

Cos-Seq for high-throughput identification of drug target and resistance mechanisms in the protozoan parasite Leishmania

Affiliations

Cos-Seq for high-throughput identification of drug target and resistance mechanisms in the protozoan parasite Leishmania

Élodie Gazanion et al. Proc Natl Acad Sci U S A. .

Abstract

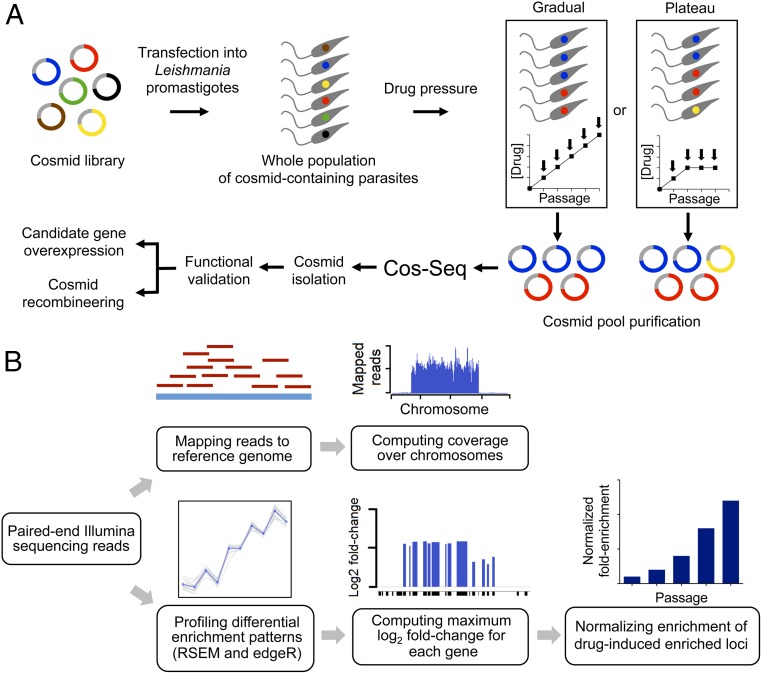
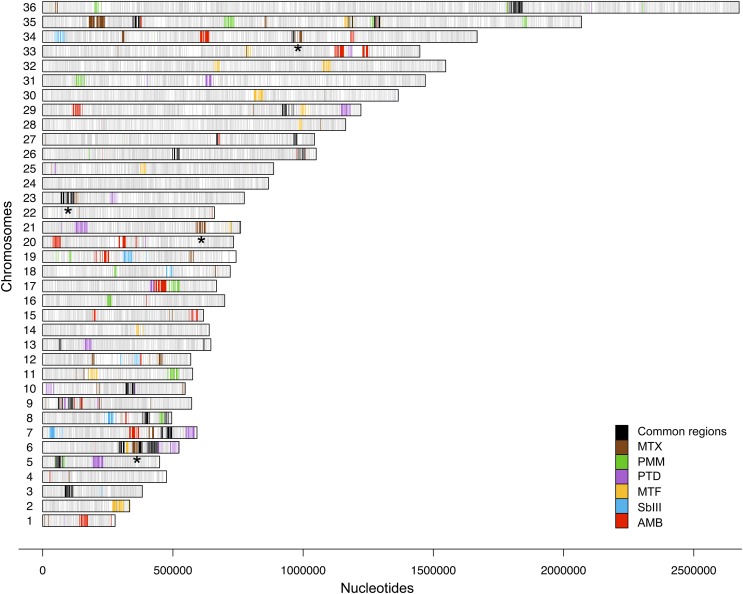
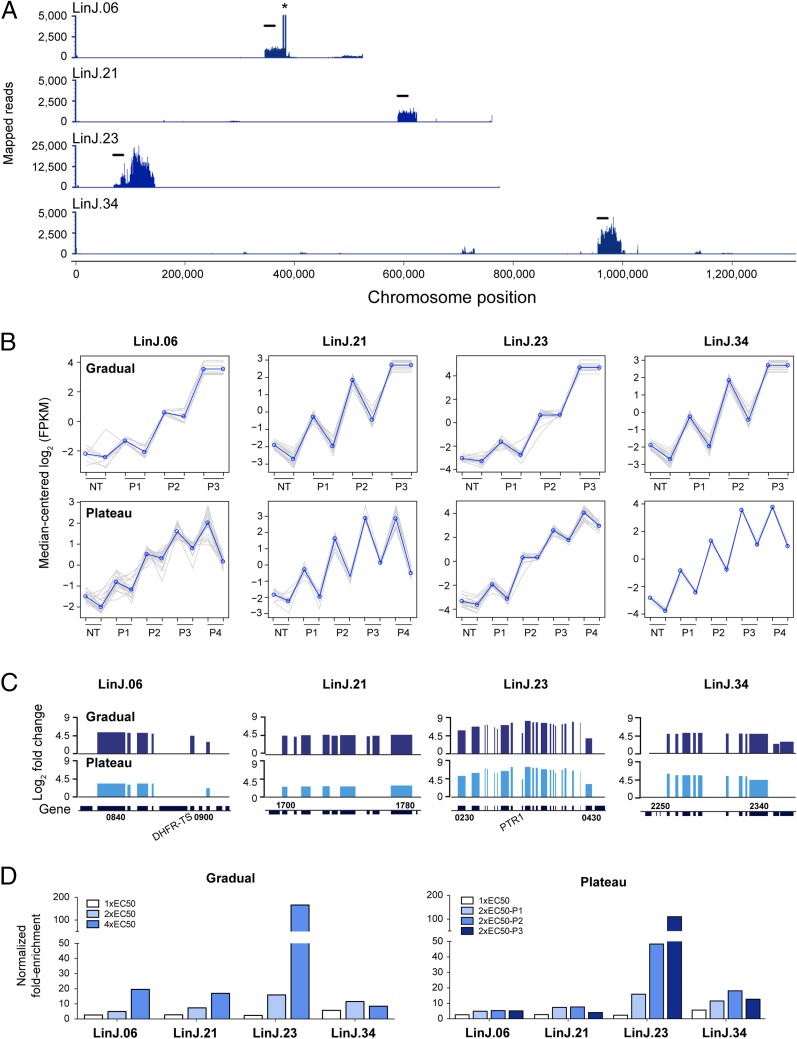
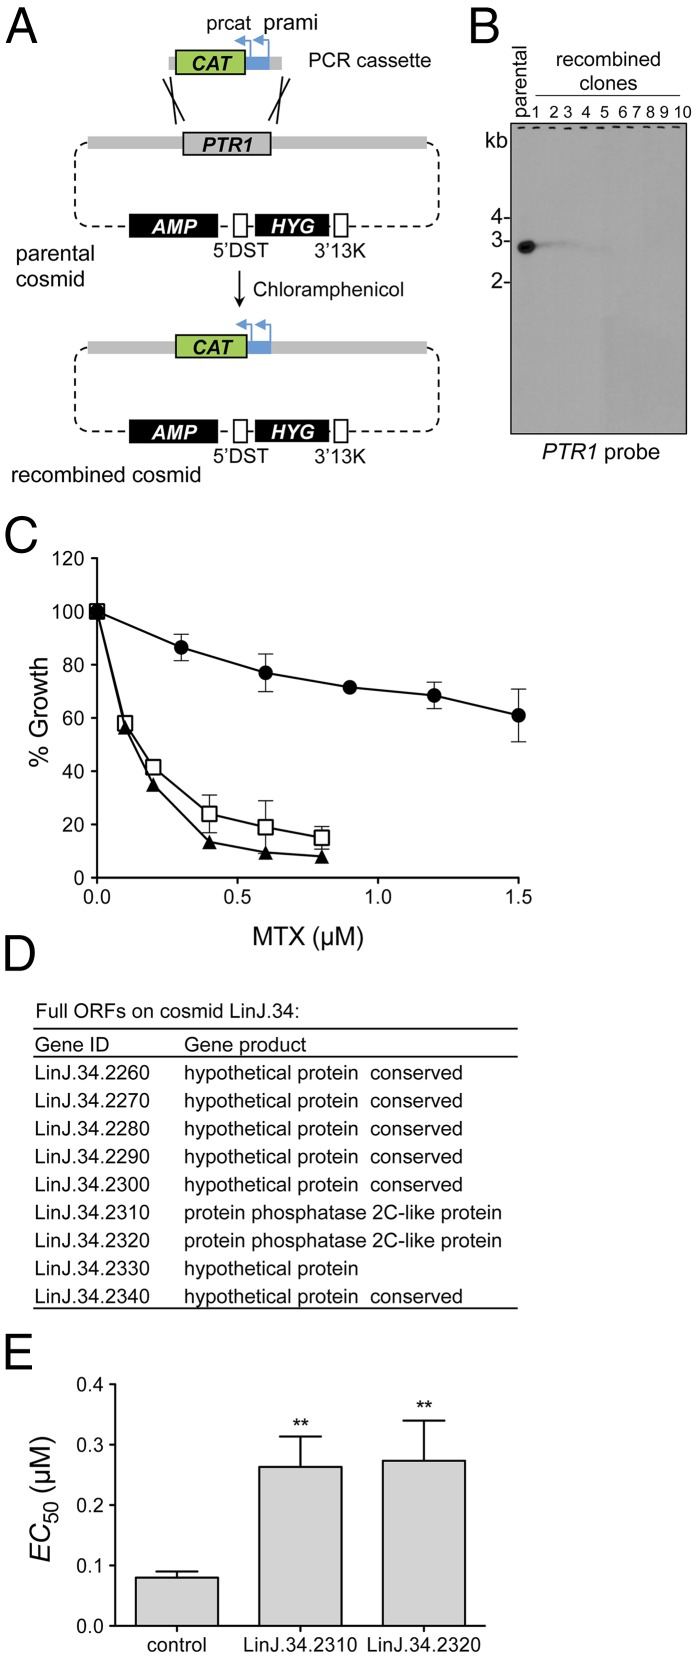
Innovative strategies are needed to accelerate the identification of antimicrobial drug targets and resistance mechanisms. Here we develop a sensitive method, which we term Cosmid Sequencing (or "Cos-Seq"), based on functional cloning coupled to next-generation sequencing. Cos-Seq identified >60 loci in the Leishmania genome that were enriched via drug selection with methotrexate and five major antileishmanials (antimony, miltefosine, paromomycin, amphotericin B, and pentamidine). Functional validation highlighted both known and previously unidentified drug targets and resistance genes, including novel roles for phosphatases in resistance to methotrexate and antimony, for ergosterol and phospholipid metabolism genes in resistance to miltefosine, and for hypothetical proteins in resistance to paromomycin, amphothericin B, and pentamidine. Several genes/loci were also found to confer resistance to two or more antileishmanials. This screening method will expedite the discovery of drug targets and resistance mechanisms and is easily adaptable to other microorganisms.

Keywords: Cos-Seq; Leishmania; functional cloning; next-generation sequencing; resistance.


Conflict of interest statement

The authors declare no conflict of interest.

Figures

Fig. 1.
Fig. 1.
Overview of the Cos-Seq approach. (A) A WT L. infantum cosmid library cloned into the cLHYG vector (22, 23) is introduced into drug-susceptible L. infantum parasites. Pooled transfectants are submitted to incremental drug pressure starting at 1× EC50 and then increasing the drug concentration by twofold at each consecutive passage (from 1× EC50 to 16× EC50 depending on the drug; gradual selection strategy). Alternatively, a plateau selection scheme was used that allows parasites to adapt to a fixed drug concentration for two or three passages (plateau selection strategy). Cosmids are extracted from each selection step and purified for subsequent Illumina sequencing. The composition of cosmid pools at each drug/passage increment is determined from the NGS data, and cosmids of interest are isolated for functional validation. The relevant resistance genes are identified by gene overexpression studies and/or cosmid recombineering (29). (B) Sequencing reads are mapped to the reference genome, and gene coverage is inferred from the mapping data. Gene abundance and differential enrichment profiles are generated using RSEM (26) and edgeR (27), respectively. Genes are clustered according to their enrichment profiles. Genes located on the same cosmid are expected to have similar enrichment profiles. Gene abundance ratios are computed on a per-gene basis and normalized to the drug-free control.
Fig. 2.
Fig. 2.
Genome-wide distribution of drug-enriched loci. Genes significantly enriched by antileishmanials as revealed by Cos-Seq are shown on one of the 36 Leishmania chromosomes. Genes enriched by both gradual and plateau selection schemes are included. Gray bars represent the gene positions on each chromosome. Colored bars represent genes enriched by the antileishmanials tested according to the color code shown at right. Only genes enriched with a mean log2-fold change of ≥4 are depicted. Black bars highlight loci enriched by at least two drugs and represent possible cross-resistance genes. Asterisks denote the genomic loci enriched by MTX, which are characterized in more detail in Fig. 3. The drug-specific Cos-Seq profiles for gradual and/or plateau selections are provided in SI Appendix, Figs. S3, S6–S9, and S11 for MTX, SbIII, MTF, AMB, PTD, and PMM, respectively. Details on the gene content of Cos-Seq enriched loci are presented in SI Appendix, Table S3.
Fig. 3.
Fig. 3.
Cos-Seq identification of loci implicated in MTX resistance. (A) Visualization of four representative MTX-enriched loci on chromosomes 6, 21, 23, and 34 as delimited by regions of higher read density. For LinJ.06, the asterisk denotes a bias in read counts coming from the DHFR-TS flanking regions originating from the cLHYG backbone (23). (Scale bars: 20 kb.) (B) Plots of gene clusters sharing similar Cos-Seq profiles from which the four representative MTX-enriched loci were recovered by gradual and plateau selections. Gray lines represent individual genes, and blue lines denote the average profile per cluster. Gene abundance is expressed on the y-axis as log2-transformed FPKM values centered to the median FPKM. Samples are ordered on the abscissa according to the selection procedure, from nontreated (NT) samples to the third drug increment (P3) for gradual selection or the fourth passage (P4) for plateau selection. Gene abundance for the two biological replicates is also shown. “Staircase” patterns are due to differences in gene abundance at baseline between the replicates. For gradual selection, sequencing of the second 4× EC50 replicate (P3) failed, leaving only a single 4× EC50 sample, which was used twice for the analysis. (C) Gene enrichment scores for the four representative MTX-enriched loci. Log2-transformed variation of gene abundance is determined between the last drug concentration (P3 for gradual selection) or passage (P4 for plateau selection) and the nontreated baseline (NT in B). The positions of DHFR-TS and PTR1 on chromosomes 6 and 23, respectively, are shown. Gene numbers indicate the first and last genes found on each enriched locus. (D) Fold enrichment of the four representative cosmids at each increment in MTX concentration (Left) or passage (Right), as normalized to the drug-free control.
Fig. 4.
Fig. 4.
Identification of MTX resistance genes from Cos-Seq–enriched cosmids. (A) Schematic overview of the cosmid recombineering approach. The parental cosmid used as target for gene deletion is purified and transformed into E. coli EL250. A PCR cassette containing 50-bp PTR1 flanking sequences fused to a CAT selectable marker is introduced into the cosmid-transformed E. coli EL250 (Materials and Methods). The PTR1 gene on the parental cosmid is deleted by homologous recombination, and the recombined clones are recovered by selection on chloramphenicol agar plates. AMP and HYG are selectable markers for ampicillin and hygromycin B, respectively, and 5′DST and 3′13K are the 5′- and 3′-flanking regions of the DHFR-TS gene, respectively (23). (B) Southern blot analysis of EcoRI-digested cosmids recovered after two rounds of selection and analyzed with a PTR1 probe. Complete deletion of PTR1 was confirmed for each recombinant cosmid clone tested. (C) Effect of MTX on growth kinetics of L. infantum WT parasites transfected with parental cosmid LinJ.23 (circle) or with a representative PTR1-null LinJ.23 cosmid (clone 5 in B) (triangle). Parasites transfected with empty cLHYG vector served as controls (square). Data are the mean ± SD of three biological replicates. (D) Chromosome 34 genes harbored by cosmid LinJ.34 enriched in the Cos-Seq MTX screen. (E) Genes LinJ.34.2310 and LinJ.34.2320 encoding phosphatase 2C-like proteins were subcloned into the pSP72αHYGα plasmid and transfected in WT L. infantum for drug susceptibility determination. The control lane shows parasites transfected with the empty plasmid. The MTX EC50 values (mean ± SD) were determined from three biological replicates and statistically analyzed using an unpaired two-tailed t test. **P ≤ 0.01.
Fig. 5.
Fig. 5.
From cosmids to antileishmanial drug resistance genes. (A) Cosmid recombineering applied to cosmid LinJ.26b, which confers AMB resistance. Two segments of three consecutive genes at the 3′ end of cosmid LinJ.26b were independently replaced with a CAT marker, yielding recombined cosmids Δ2610–30 and Δ2640–60. Cosmid Δ2610–30 is deleted for the LinJ.26.2610, LinJ.26.2620, and LinJ.26.2630 genes, and cosmid Δ2640–60 is deleted for the LinJ.26.2640, LinJ.26.2650, and LinJ.26.2660 genes. (B) AMB EC50 ratio (candidate cosmid/empty vector) for L. infantum WT parasites transfected with the parental cosmid LinJ.26b or with its recombined derivative cosmids Δ2610–30 and Δ2640–60. Parasites transfected with empty cLHYG served as controls. Data are the mean ± SD of two independent experiments, each performed with five biological replicates and statistically analyzed using an unpaired two-tailed t test. **P ≤ 0.01; ***P ≤ 0.001. (C) Effect of PTD on the growth kinetics of L. infantum WT parasites transfected with cosmid LinJ.31b (circle) and its PRP1-null derivative generated by cosmid recombineering (triangle). The same strategy used for PTR1 deletion (Fig. 4A) was used here for PRP1. Parasites transfected with empty cLHYG served as controls (square). Data are the mean ± SD of three biological replicates.

Similar articles

Cited by

References

    1. World, Health Organization . Sustaining the Drive to Overcome the Global Impact of Neglected Tropical Diseases: Second WHO Report on Neglected Tropical Diseases. World Health Organization; Geneva, Switzerland: 2013.
    1. Croft SL, Sundar S, Fairlamb AH. Drug resistance in leishmaniasis. Clin Microbiol Rev. 2006;19(1):111–126. - PMC - PubMed
    1. Ouellette M, Drummelsmith J, Papadopoulou B. Leishmaniasis: Drugs in the clinic, resistance and new developments. Drug Resist Update. 2004;7(4–5):257–266. - PubMed
    1. Kotze AC, et al. Recent advances in candidate-gene and whole-genome approaches to the discovery of anthelmintic resistance markers and the description of drug/receptor interactions. Int J Parasitol Drugs Drug Resist. 2014;4(3):164–184. - PMC - PubMed
    1. Horn D, Duraisingh MT. Antiparasitic chemotherapy: From genomes to mechanisms. Annu Rev Pharmacol Toxicol. 2014;54:71–94. - PMC - PubMed

Publication types

MeSH terms

LinkOut - more resources