

Increasing importance of deposition of reduced nitrogen in the United States
- PMID: 27162336
- PMCID: PMC4889379
- DOI: 10.1073/pnas.1525736113
Increasing importance of deposition of reduced nitrogen in the United States
Abstract
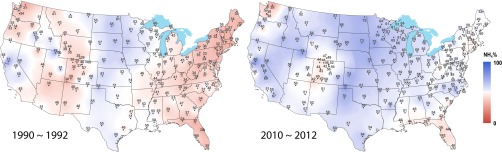
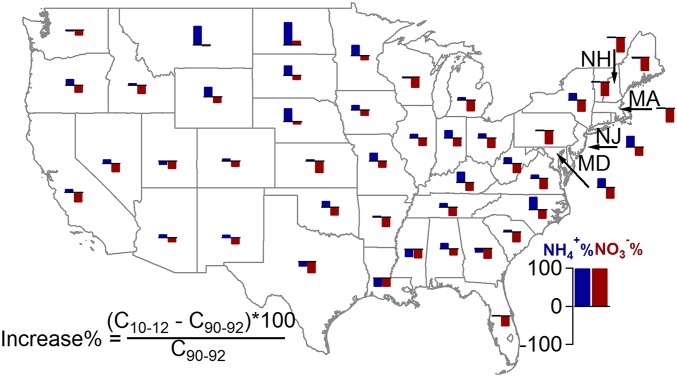
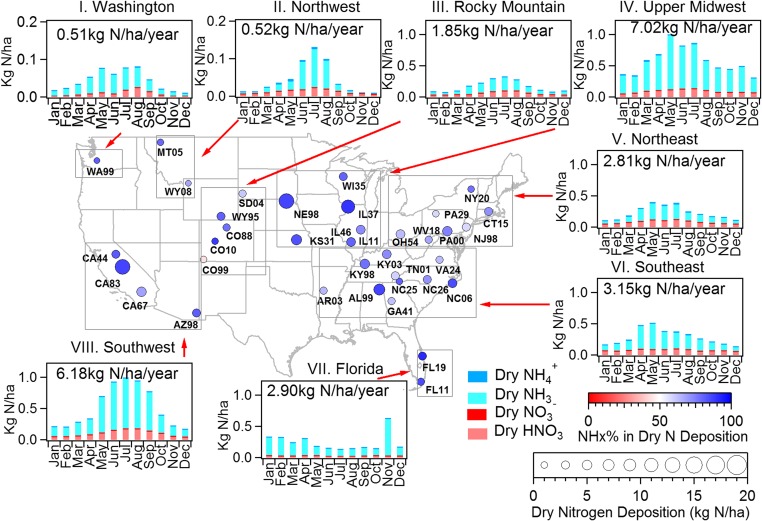
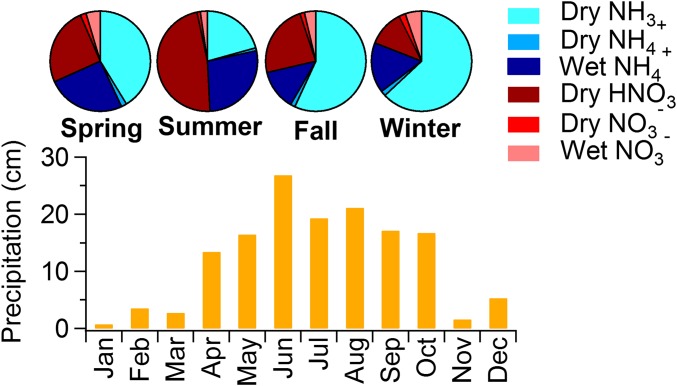
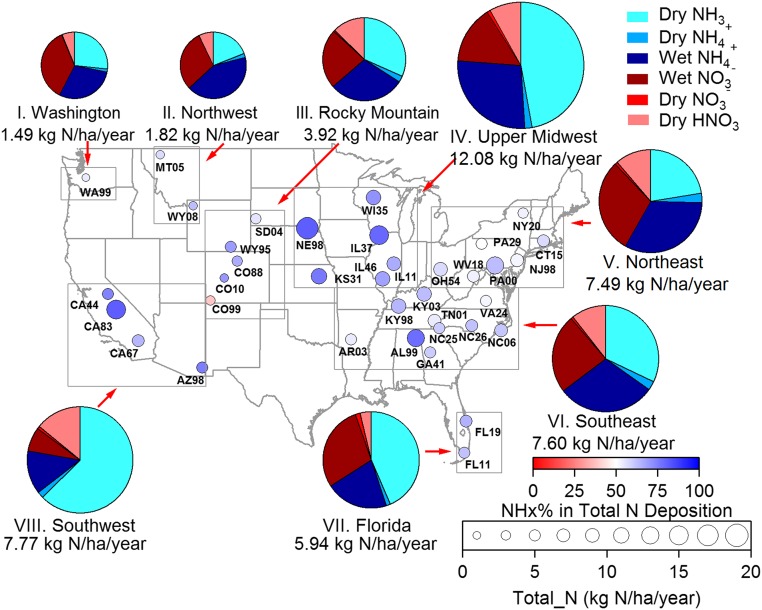
Rapid development of agriculture and fossil fuel combustion greatly increased US reactive nitrogen emissions to the atmosphere in the second half of the 20th century, resulting in excess nitrogen deposition to natural ecosystems. Recent efforts to lower nitrogen oxides emissions have substantially decreased nitrate wet deposition. Levels of wet ammonium deposition, by contrast, have increased in many regions. Together these changes have altered the balance between oxidized and reduced nitrogen deposition. Across most of the United States, wet deposition has transitioned from being nitrate-dominated in the 1980s to ammonium-dominated in recent years. Ammonia has historically not been routinely measured because there are no specific regulatory requirements for its measurement. Recent expansion in ammonia observations, however, along with ongoing measurements of nitric acid and fine particle ammonium and nitrate, permit new insight into the balance of oxidized and reduced nitrogen in the total (wet + dry) US nitrogen deposition budget. Observations from 37 sites reveal that reduced nitrogen contributes, on average, ∼65% of the total inorganic nitrogen deposition budget. Dry deposition of ammonia plays an especially key role in nitrogen deposition, contributing from 19% to 65% in different regions. Future progress toward reducing US nitrogen deposition will be increasingly difficult without a reduction in ammonia emissions.
Keywords: agriculture; ammonia; dry deposition; nitrogen oxides; wet deposition.
Conflict of interest statement
The authors declare no conflict of interest.
Figures
Comment in
-
Reduced nitrogen dominated nitrogen deposition in the United States, but its contribution to nitrogen deposition in China decreased.Proc Natl Acad Sci U S A. 2016 Jun 28;113(26):E3590-1. doi: 10.1073/pnas.1607507113. Epub 2016 Jun 15. Proc Natl Acad Sci U S A. 2016. PMID: 27307443 Free PMC article. No abstract available.
-
Rise and fall of nitrogen deposition in the United States.Proc Natl Acad Sci U S A. 2016 Jun 28;113(26):E3594-5. doi: 10.1073/pnas.1607543113. Epub 2016 Jun 15. Proc Natl Acad Sci U S A. 2016. PMID: 27307445 Free PMC article. No abstract available.
-
Organic nitrates and other oxidized nitrogen compounds contribute significantly to the total nitrogen depositions in the United States.Proc Natl Acad Sci U S A. 2016 Aug 2;113(31):E4433-4. doi: 10.1073/pnas.1608717113. Epub 2016 Jul 20. Proc Natl Acad Sci U S A. 2016. PMID: 27439878 Free PMC article. No abstract available.
References
-
- Galloway JN, et al. Transformation of the nitrogen cycle: Recent trends, questions, and potential solutions. Science. 2008;320(5878):889–892. - PubMed
-
- Erisman JW, Galloway J, Seitzinger S, Bleeker A, Butterbach-Bahl K. Reactive nitrogen in the environment and its effect on climate change. Curr Opin Environ Sustain. 2011;3(5):281–290.
-
- Galloway JN, Cowling EB. Reactive nitrogen and the world: 200 years of change. AMBIO. 2002;31(2):64–71. - PubMed
-
- Liu X, et al. Enhanced nitrogen deposition over China. Nature. 2013;494(7438):459–462. - PubMed
-
- Clark CM, Tilman D. Loss of plant species after chronic low-level nitrogen deposition to prairie grasslands. Nature. 2008;451(7179):712–715. - PubMed
Publication types
MeSH terms
Substances
LinkOut - more resources
Full Text Sources
Other Literature Sources
