. 2016 May 24;113(21):5999-6004.
doi: 10.1073/pnas.1602069113. Epub 2016 May 9.

NLRC5/MHC class I transactivator is a target for immune evasion in cancer

Affiliations

NLRC5/MHC class I transactivator is a target for immune evasion in cancer

Sayuri Yoshihama et al. Proc Natl Acad Sci U S A. .

Abstract

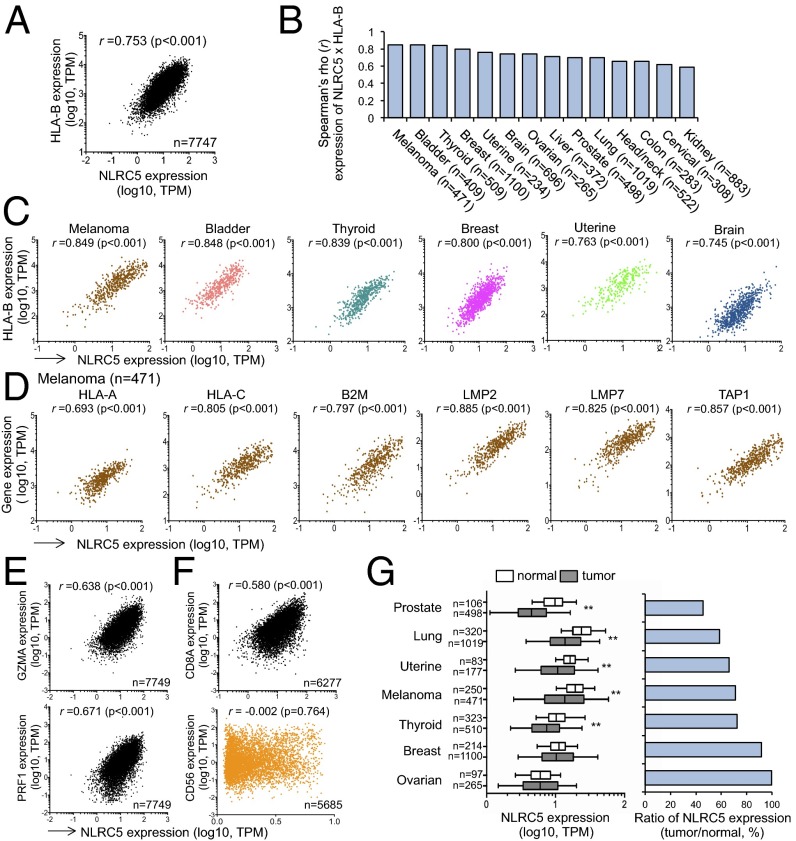
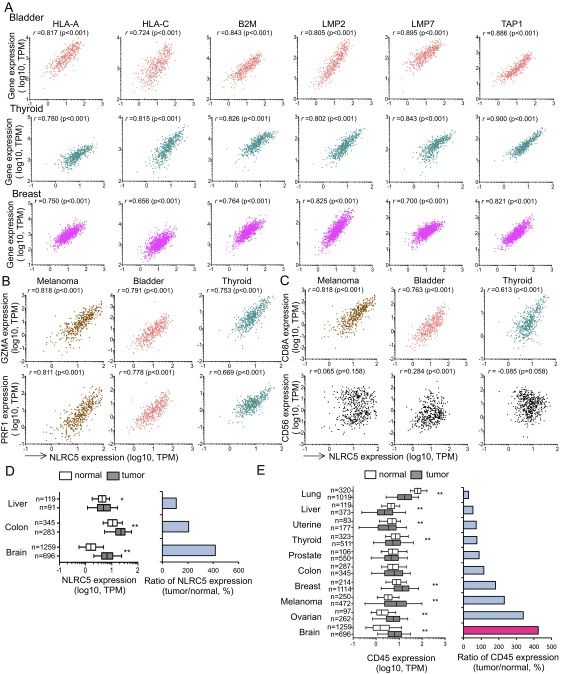
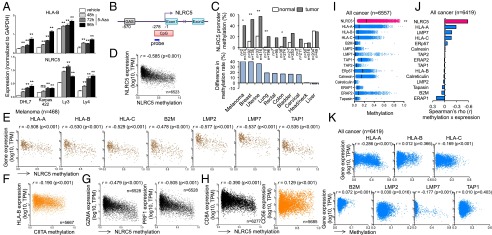
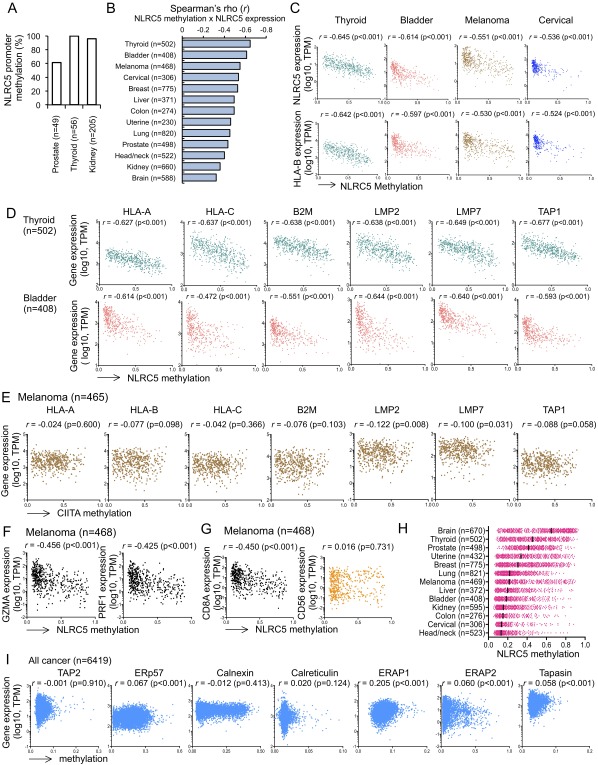
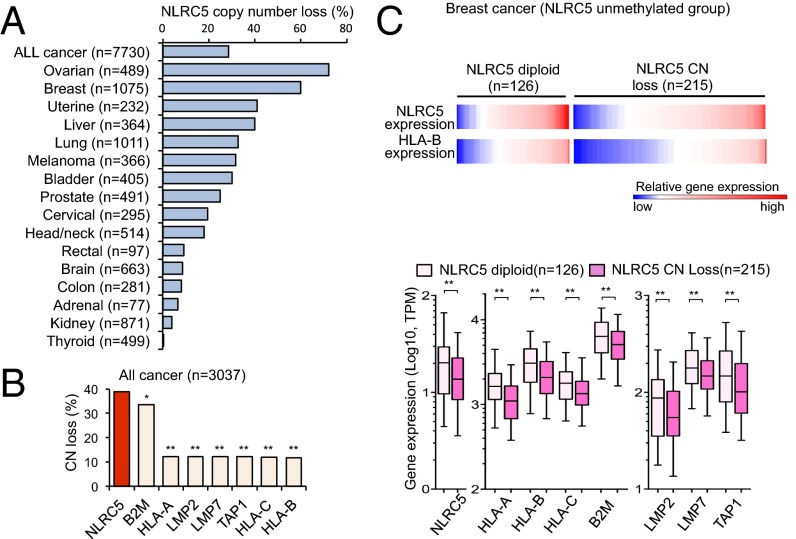
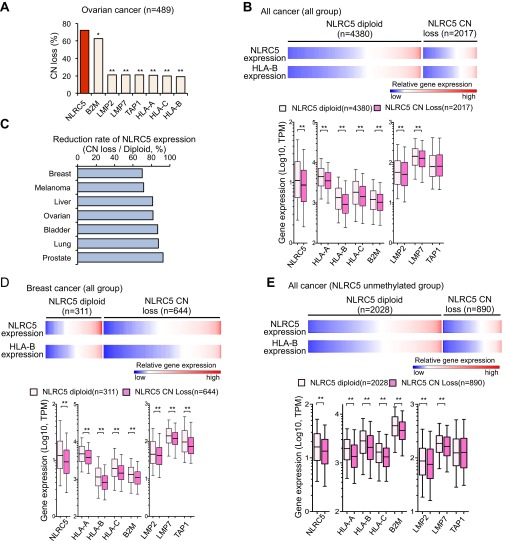
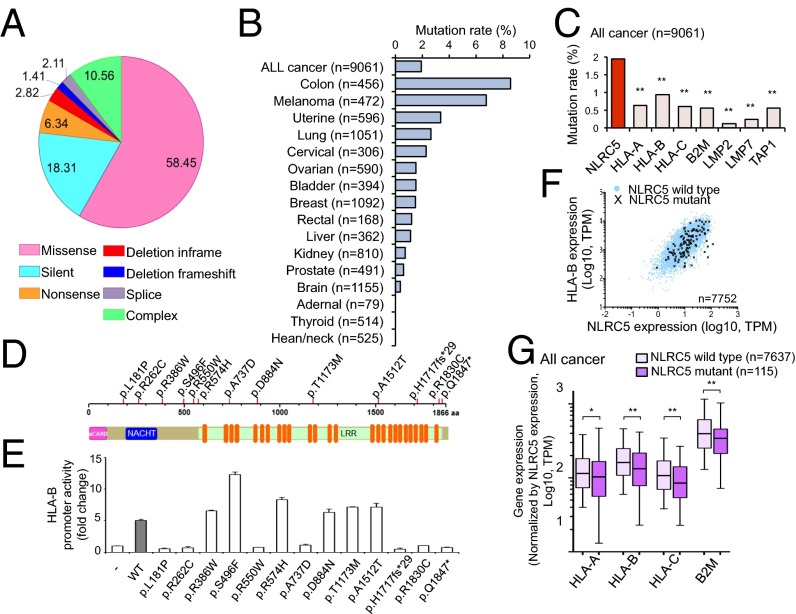
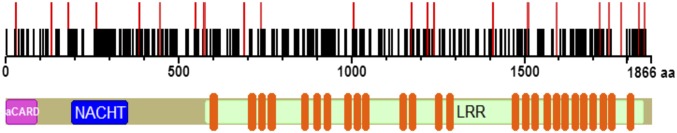
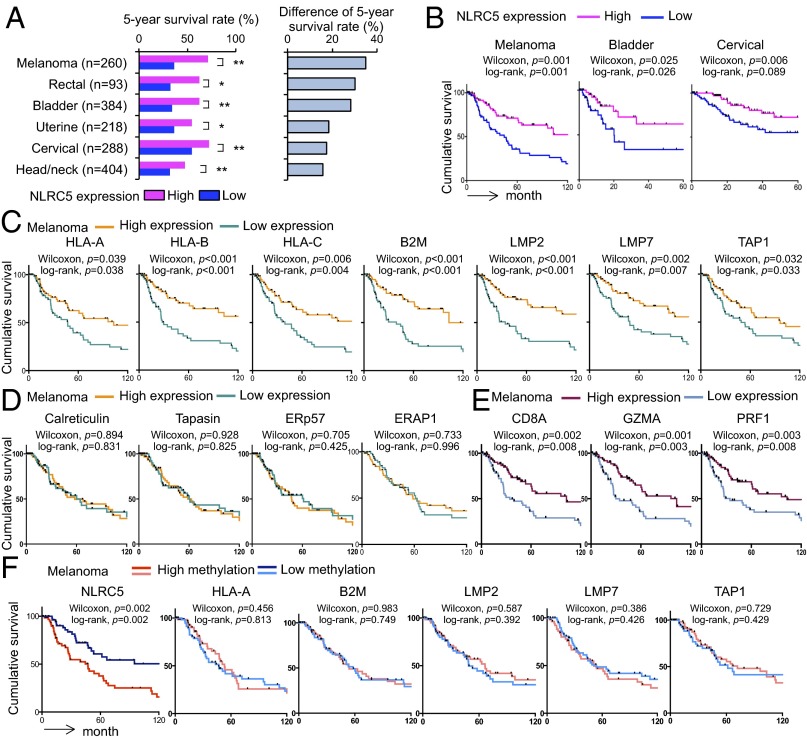
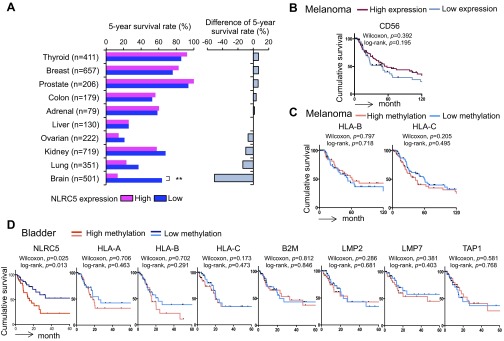
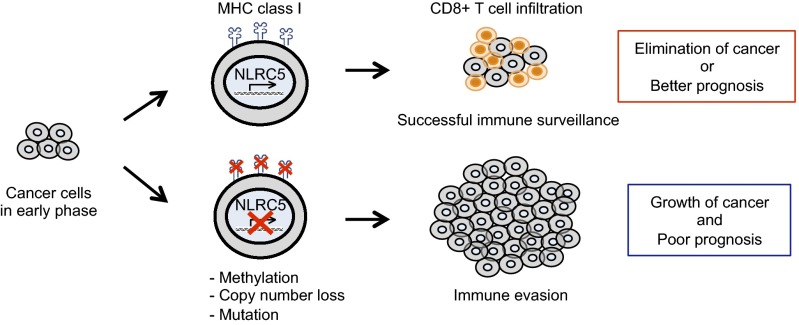
Cancer cells develop under immune surveillance, thus necessitating immune escape for successful growth. Loss of MHC class I expression provides a key immune evasion strategy in many cancers, although the molecular mechanisms remain elusive. MHC class I transactivator (CITA), known as "NLRC5" [NOD-like receptor (NLR) family, caspase recruitment (CARD) domain containing 5], has recently been identified as a critical transcriptional coactivator of MHC class I gene expression. Here we show that the MHC class I transactivation pathway mediated by CITA/NLRC5 constitutes a target for cancer immune evasion. In all the 21 tumor types we examined, NLRC5 expression was highly correlated with the expression of MHC class I, with cytotoxic T-cell markers, and with genes in the MHC class I antigen-presentation pathway, including LMP2/LMP7, TAP1, and β2-microglobulin. Epigenetic and genetic alterations in cancers, including promoter methylation, copy number loss, and somatic mutations, were most prevalent in NLRC5 among all MHC class I-related genes and were associated with the impaired expression of components of the MHC class I pathway. Strikingly, NLRC5 expression was significantly associated with the activation of CD8(+) cytotoxic T cells and patient survival in multiple cancer types. Thus, NLRC5 constitutes a novel prognostic biomarker and potential therapeutic target of cancers.

Keywords: CITA; MHC class I; NLRC5; cancer; immune evasion.


Conflict of interest statement

The authors declare no conflict of interest.

Figures

Fig. 1.
Fig. 1.
Expressions of NLRC5 and MHC class I genes are positively correlated. (A) Scatter plots for the expression of NLRC5 [x axis; log10 values in transcripts per million (TPM)] and HLA-B (y axis; log10 values in TPM) in 16 tumor types (n = 7,747). (B) Spearman rank correlation coefficients between the expression of NLRC5 and HLA-B. Fourteen representative tumor types carrying at least 100 samples are shown. (C) Scatter plots for the expression of NLRC5 and HLA-B in six tumor types showing high correlation coefficients. (D) Scatter plots for the expression of NLRC5 and other MHC class I-related genes in melanoma that have the highest correlation coefficients in B. (E) Scatter plots for the expression of NLRC5 and GZMA or PRF1 in 16 tumor types (n = 7,749). (F) Scatter plots for the expression of NLRC5 and CD8A in 16 tumor types (n = 6,277) or CD56 in 15 tumor types (n = 5,685). Pairwise correlations in AF were calculated using the Spearman’s ranked correlation test; r, Spearman rho coefficient. (G, Left) NLRC5 expression in indicated normal and tumor tissues. The bar inside the box corresponds to the median; the box corresponds to the 25th–75th percentiles, and the error bars indicate the confidence interval (fifth–95th percentile). Statistical significance was determined by the Mann–Whitney test: **P < 0.01. (Right) The ratio of NLRC5 expression level in tumor and normal tissues.
Fig. S1.
Fig. S1.
Expression of NLRC5 and MHC class I genes is positively correlated. (A) Scatter plots for the expression of NLRC5 (x axis; log10 values in TPM) and other MHC class I-related genes (y axis; log10 values in TPM) in biopsy samples from patients with bladder cancer (Top Row), thyroid cancer (Middle Row), and breast cancer (Bottom Row). (B) Scatter plots for the expression of NLRC5 and GZMA (Upper Row) or PRF1 (Lower Row) for the three indicated tumor types. (C) Scatter plots for the expression of NLRC5 and CD8A (Upper Row) or CD56 (Lower Row) for the three indicated tumor types. (D, Left) NLRC5 expression in normal and tumor tissues. (Right) The ratio of NLRC5 expression level in tumor and normal tissue. (E, Left) CD45 expression in normal and tumor tissues. (Right) The ratio of CD45 expression level in tumor and normal tissue. In AC pairwise correlations were calculated using the Spearman’s ranked correlation test. r, Spearman rho coefficient. In D and E the bar inside the box corresponds to the median, the box represents the 25th–75th percentile and the error bars indicate the confidence interval (fifth–95th percentile). Statistical significance was determined by the Mann–Whitney test: *P < 0.05; **P < 0.01.
Fig. 2.
Fig. 2.
Preferential DNA methylation in the NLRC5 promoter in cancer cells is associated with impaired MHC class I-dependent cytotoxic T-cell activity. (A) Indicated cancer cell lines were treated with 3 μM of 5-Aza for the indicated time periods, and NLRC5 and HLA-B expression was quantified by quantitative PCR. Data are representative of three independent experiments and are shown as means ± SD. Statistical significance was determined by the paired t test: **P < 0.01. (B) Schematic representation of the methylation-specific probe on the NLRC5 promoter region. The NLRC5 promoter has a CpG island of ∼578 bp starting at position −278. To examine the methylation status of the NLRC5 promoter, a methylation-specific probe (cg16411857, blue line) on the CpG island was used. The transcription start site is indicated as −1; the STAT1-binding site GAS is at −570. (C, Upper) The methylation rate of the NLRC5 promoter in 10 indicated cancer types and normal tissues. (Lower) The difference in the NLRC5 promoter methylation rate in tumor and normal tissues. A β value over 0.3 was considered as methylated. Statistical significance was determined by the χ2 test: *P < 0.05; **P < 0.01. (D) Scatter plots showing the expression of NLRC5 (y axis; log10 values in TPM) and the methylation level of the NLRC5 promoter (x axis; β values) in 15 tumor types (n = 6,523). (E) Scatter plots for the expression of various MHC class I-related genes and the methylation level of the NLRC5 promoter in melanoma (n = 468). (F) Scatter plots for HLA-B expression and methylation level of CIITA promoter in 15 tumor types (n = 5,667). (G) Scatter plots for the expression of GZMA or PRF1 and the methylation level of the NLRC5 promoter in 15 tumor types (n = 6,528). (H) Scatter plots for CD8A expression in 15 tumor types (n = 6,277) or CD56 expression and methylation level of the NLRC5 promoter in 14 tumor types (n = 5,685). (I) Dot plots for the methylation level of various MHC class I-related genes (x axis; β values) in all cancer types (16 tumor types, n = 6,557). The median values are indicated by vertical bars. Statistical significance was determined by the Mann–Whitney test: **P < 0.01. (J) Spearman rank correlation coefficient between the expression and methylation of indicated MHC class I-related genes in 15 tumor types (n = 6,419). (K) Scatter plots for the expression and methylation level of various MHC class I-related genes in 15 tumor types (n = 6,419). In DH, J, and K pairwise correlations were calculated using the Spearman’s ranked correlation test. r, Spearman rho coefficient.
Fig. S2.
Fig. S2.
The methylation level of NLRC5 promoter and the expression of MHC class I genes are negatively correlated. (A) NLRC5 promoter methylation rates in normal tissues carrying high methylation rate. (B) Spearman rank correlation coefficients between NLRC5 expression and DNA methylation of the NLRC5 promoter in 13 tumor types that hold at least 100 samples. (C) Scatter plots for the expression of NLRC5 or HLA-B expression (y axis; log10 values in TPM) and the methylation level of the NLRC5 promoter (x axis; β values) in indicated tumor types showing negative correlation coefficient. (D) Scatter plots for the expression of various MHC class I-related genes and the methylation level of the NLRC5 promoter in thyroid cancer (n = 502) and bladder cancer (n = 408). (E) Scatter plots for the expression of various MHC class I-related genes and the methylation level of the CIITA promoter in melanoma (n = 465). (F) Scatter plots for the expression of GZMA or PRF1 and the methylation level of the NLRC5 promoter in melanoma (n = 468). (G) Scatter plots for the expression of CD8A or CD56 and methylation level of NLRC5 promoter in melanoma (n = 468). (H) Dot plots for the methylation level of the NLRC5 promoter (x axis; β values) in 13 tumor types that hold at least 100 samples. The median values are indicated by bars. (I) Scatter plots for the expression and methylation level of the indicated MHC class I-related genes in 15 tumor types (n = 6,419). In BG and I pairwise correlations were calculated using the Spearman’s ranked correlation test. r, Spearman rho coefficient.
Fig. 3.
Fig. 3.
CN loss in NLRC5 is associated with reduced expression of MHC class I genes. (A) Percentage of cancer patients who carry NLRC5 CN loss among 16 tumor types. Based on GISTIC values, samples were classified into the NLRC5 diploid group (GISTIC 0) and the CN-loss group (GISTIC −1 and −2). (B) Percentage of cancer patients who carry CN loss of various MHC class I-related genes for nine tumor types for which data are available (bladder, breast, colon, head/neck, lung, ovarian, prostate, rectal, and uterine cancer). Statistical significance was determined by the χ2 test: *P < 0.01; **P < 0.0001. (C) Heatmap showing gene expression of NLRC5 and HLA-B in the NLRC5 diploid group (n = 126) and in the CN-loss group (n = 215) for breast cancer patients in which the NLRC5 promoter is not methylated (β values <0.3). The box plots show NLRC5 and MHC class I-related gene expression in the NLRC5 diploid group or in the CN-loss group in breast cancer. The bar inside the box corresponds to the median, the box corresponds to the 25th–75th percentile, and the error bars indicate the confidence interval (fifth–95th percentile). Statistical significance was determined by the Mann–Whitney test: **P < 0.01.
Fig. S3.
Fig. S3.
CN loss in NLRC5 is associated with reduced MHC class I gene expression. (A) Percentage of cancer patients who carry CN loss of various MHC class I-related genes for ovarian cancer (n = 489). Statistical significance was determined by the χ2 test: *P < 0.01; **P < 0.0001. (B, Upper) Heatmap showing expression of NLRC5 and HLA-B in the NLRC5 diploid group (n = 4,380) or the CN-loss group (n = 2,017) for 16 tumor types. (Lower) Box plots showing NLRC5 and MHC class I-related gene expression in the NLRC5 diploid group or the CN-loss group. (C) Reduction rate of NLRC5 expression calculated by using the mean expression of NLRC5 in the CN-loss group divided by the mean of diploid group in seven tumor types that have at least 100 samples. (D, Upper) Heatmap showing the expression of NLRC5 and HLA-B in the NLRC5 diploid group (n = 311) or in the CN-loss group (n = 644) for breast cancer. (Lower) Box plots showing NLRC5 and MHC class I-related gene expression in the NLRC5 diploid group or in the CN-loss group in breast cancer. (E, Upper) Heatmap showing expression of NLRC5 and HLA-B in the NLRC5 diploid group (n = 2,028) or in the CN-loss group (n = 890) for 15 tumor types in which the NLRC5 promoter is not methylated (β values <0.3). (Lower) Box plots showing NLRC5 and MHC class I-related gene expression in the NLRC5 diploid group or in the CN-loss group. Samples were classified into the NLRC5 diploid group and the CN-loss group based on GISTIC values: GISTIC 0, diploid; −1 and −2, CN loss. In B, D, and E the bar inside the box corresponds to the median, the box corresponds to the 25th–75th percentile, and the error bars indicate the confidence interval (fifth–95th percentile). Statistical significance was determined by the Mann–Whitney test. **P < 0.01.
Fig. 4.
Fig. 4.
Somatic mutations in NLRC5 are correlated with reduced expression of MHC class I genes. (A) Pie chart representing the percentage distribution of different types of mutations in NLRC5 in various cancer patients (n = 7,752). (B) Mutation rate in NLRC5 for 16 tumor types (n = 9,061). (C) Mutation rate in the indicated genes for 16 tumor types. Statistical significance was determined by the χ2 test (n = 9,061): **P < 0.001. (D) Representation of NLRC5 indicating 13 mutations found in at least two different cancer patients. (E) HEK293T cells were cotransfected with either empty control vector or the respective NLRC5 mutant plasmid with HLA-B reporter plasmid, and HLA-B promoter activity was assessed by the dual-luciferase assay and normalized against Renilla firefly activity. Data are representative of two independent experiments performed in duplicate and are plotted as fold induction with respect to the control vector. The error bars indicate SD. (F) Scatter plots for the expression of NLRC5 and HLA-B for the NLRC5 wild-type group (blue circle) and the NLRC5 mutant group (black cross) in 16 tumor types (n = 7,752). (G) Box plots for the expression level of MHC class I-related genes normalized by the expression level of NLRC5 in 16 tumor types that are either NLRC5 wild type or NLRC5 mutant. The bar inside the box corresponds to the median; the box corresponds to the 25th–75th percentile, and the error bars indicate the confidence interval (fifth–95th percentile). Statistical significance was determined by the Mann–Whitney test: *P < 0.05; **P < 0.01.
Fig. S4.
Fig. S4.
Somatic mutation in NLRC5. Positional representation of 161 mutations in NLRC5. The black bars represent mutations found in one patient. The red bars represent mutations found in at least two different patients.
Fig. 5.
Fig. 5.
The expression of NLRC5 is correlated with better survival in multiple cancer types. Patients were divided into four groups by the level of indicated gene expression or methylation, and the top (high) and the bottom (low) quartiles were analyzed. (A, Left) Five-year survival rate in high and low NLRC5 expression groups for indicated tumor types. (Right) Difference in the 5-year survival rate in groups with high and low NLRC5 expression. Statistical significance was determined by the χ2 test: *P < 0.05; **P < 0.01. (B) Kaplan–Meier survival curves for indicated tumor types in groups with low and high NLRC5 expression. (C) Kaplan–Meier survival curves for melanoma patients with low and high expression of the indicated NLRC5-dependent MHC class I-related genes. (D) Kaplan–Meier survival curves for melanoma patients with low and high expression of the indicated NLRC5-independent MHC class I-related genes. (E) Kaplan–Meier survival curves for melanoma patients with low and high expression of CD8A and the indicated markers for cytotoxic CD8+ T-cell activity. (F) Kaplan–Meier survival curves for melanoma patients with low and high methylation of the NLRC5 promoter and the indicated MHC class I-related genes. In BF statistical significance was determined by the log-rank test and the Gehan–Breslow–Wilcoxon test.
Fig. S5.
Fig. S5.
Survival of cancer patients based on the expression and methylation level of MHC class I-related genes. Patients were divided into four groups by the level of indicated gene expression or methylation, and the top (high) and the bottom (low) quartiles were analyzed. (A, Left) Five-year survival rate for indicated tumor types in groups expressing high and low levels of NLRC5. (Right) The difference in the 5-year survival rate between groups expressing high and low levels of NLRC5. Statistical significance was determined by the χ2 test: **P < 0.01. (B) Kaplan–Meier survival curves of melanoma for groups with high and low expression of CD56. (C) Kaplan–Meier survival curves of melanoma for groups with high and low methylation of the indicated MHC class I genes. (D) Kaplan–Meier survival curves of bladder cancer for groups with high and low methylation of NLRC5 and the indicated MHC class I-related genes. In BD statistical significance was determined by log-rank and Gehan–Breslow–Wilcoxon tests.
Fig. 6.
Fig. 6.
Model of cancer evolution targeting NLRC5 for immune evasion. NLRC5-dependent MHC class I expression is crucial for CD8+ T-cell–mediated antitumor responses and the elimination of cancer cells. Genetic and epigenetic changes, such as mutation, CN loss, or promoter methylation of NLRC5 occur during the evolution of cancer cells, leading to an impaired MHC class I system. These changes result in an impaired ability to elicit antitumor CD8+ T-cell responses and reduced infiltration in cancer tissues. Cancer cells successful in immune evasion cause efficient tumor development, leading to poor prognosis of cancer-bearing patients. Cancer cells (gray) and CD8+ T cells (orange) are shown.

References

    1. Schreiber RD, Old LJ, Smyth MJ. Cancer immunoediting: Integrating immunity’s roles in cancer suppression and promotion. Science. 2011;331(6024):1565–1570. - PubMed
    1. Mittal D, Gubin MM, Schreiber RD, Smyth MJ. New insights into cancer immunoediting and its three component phases—elimination, equilibrium and escape. Curr Opin Immunol. 2014;27:16–25. - PMC - PubMed
    1. Campoli M, Ferrone S. HLA antigen changes in malignant cells: Epigenetic mechanisms and biologic significance. Oncogene. 2008;27(45):5869–5885. - PMC - PubMed
    1. Lampen MH, van Hall T. Strategies to counteract MHC-I defects in tumors. Curr Opin Immunol. 2011;23(2):293–298. - PubMed
    1. Vermeulen CF, et al. Frequent HLA class I loss is an early event in cervical carcinogenesis. Hum Immunol. 2005;66(11):1167–1173. - PubMed

Publication types

MeSH terms