

Mutant cycle analysis with modified saxitoxins reveals specific interactions critical to attaining high-affinity inhibition of hNaV1.7
- PMID: 27162340
- PMCID: PMC4889396
- DOI: 10.1073/pnas.1603486113
Mutant cycle analysis with modified saxitoxins reveals specific interactions critical to attaining high-affinity inhibition of hNaV1.7
Abstract
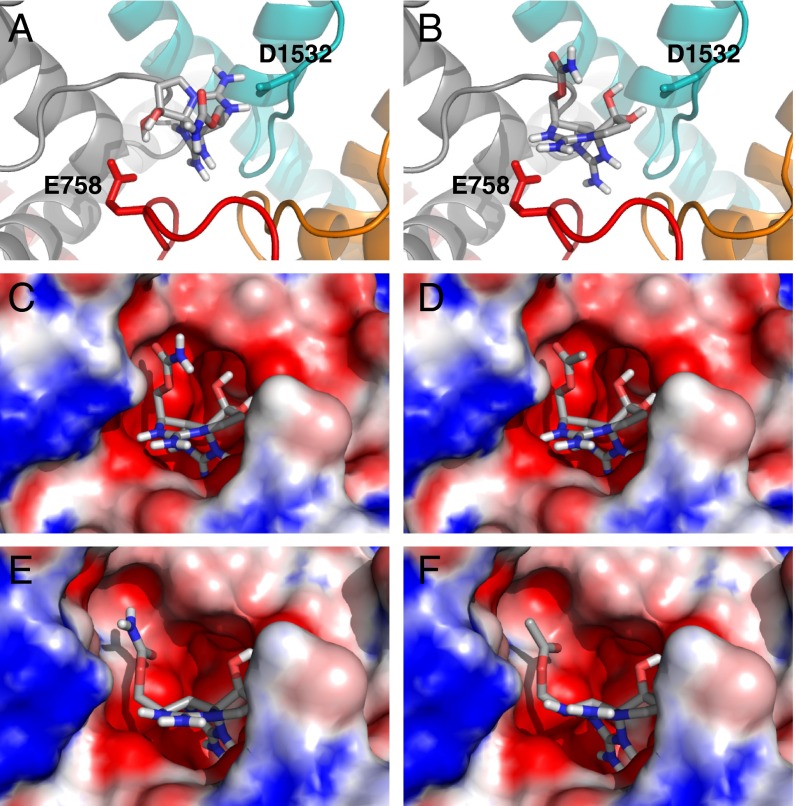
Improper function of voltage-gated sodium channels (NaVs), obligatory membrane proteins for bioelectrical signaling, has been linked to a number of human pathologies. Small-molecule agents that target NaVs hold considerable promise for treatment of chronic disease. Absent a comprehensive understanding of channel structure, the challenge of designing selective agents to modulate the activity of NaV subtypes is formidable. We have endeavored to gain insight into the 3D architecture of the outer vestibule of NaV through a systematic structure-activity relationship (SAR) study involving the bis-guanidinium toxin saxitoxin (STX), modified saxitoxins, and protein mutagenesis. Mutant cycle analysis has led to the identification of an acetylated variant of STX with unprecedented, low-nanomolar affinity for human NaV1.7 (hNaV1.7), a channel subtype that has been implicated in pain perception. A revised toxin-receptor binding model is presented, which is consistent with the large body of SAR data that we have obtained. This new model is expected to facilitate subsequent efforts to design isoform-selective NaV inhibitors.
Keywords: guanidinium toxin; mutant cycle analysis; sodium channel.
Conflict of interest statement
The authors declare no conflict of interest.
Figures
Similar articles
-
Use-dependent block of the voltage-gated Na(+) channel by tetrodotoxin and saxitoxin: effect of pore mutations that change ionic selectivity.J Gen Physiol. 2012 Oct;140(4):435-54. doi: 10.1085/jgp.201210853. J Gen Physiol. 2012. PMID: 23008436 Free PMC article.
-
High-throughput electrophysiological assays for voltage gated ion channels using SyncroPatch 768PE.PLoS One. 2017 Jul 6;12(7):e0180154. doi: 10.1371/journal.pone.0180154. eCollection 2017. PLoS One. 2017. PMID: 28683073 Free PMC article.
-
Structural Basis for the Inhibition of Voltage-gated Sodium Channels by Conotoxin μO§-GVIIJ.J Biol Chem. 2016 Mar 25;291(13):7205-20. doi: 10.1074/jbc.M115.697672. Epub 2016 Jan 27. J Biol Chem. 2016. PMID: 26817840 Free PMC article.
-
Structure-based assessment of disease-related mutations in human voltage-gated sodium channels.Protein Cell. 2017 Jun;8(6):401-438. doi: 10.1007/s13238-017-0372-z. Epub 2017 Feb 1. Protein Cell. 2017. PMID: 28150151 Free PMC article. Review.
-
Guanidinium Toxins and Their Interactions with Voltage-Gated Sodium Ion Channels.Mar Drugs. 2017 Oct 13;15(10):303. doi: 10.3390/md15100303. Mar Drugs. 2017. PMID: 29027912 Free PMC article. Review.
Cited by
-
Challenges and Opportunities for Therapeutics Targeting the Voltage-Gated Sodium Channel Isoform NaV1.7.J Med Chem. 2019 Oct 10;62(19):8695-8710. doi: 10.1021/acs.jmedchem.8b01906. Epub 2019 May 7. J Med Chem. 2019. PMID: 31012583 Free PMC article. Review.
-
Mutant cycle analysis identifies a ligand interaction site in an odorant receptor of the malaria vector Anopheles gambiae.J Biol Chem. 2017 Nov 17;292(46):18916-18923. doi: 10.1074/jbc.M117.810374. Epub 2017 Sep 29. J Biol Chem. 2017. PMID: 28972152 Free PMC article.
-
Development of Photocrosslinking Probes Based on Huwentoxin-IV to Map the Site of Interaction on Nav1.7.Cell Chem Biol. 2020 Mar 19;27(3):306-313.e4. doi: 10.1016/j.chembiol.2019.10.011. Epub 2019 Nov 12. Cell Chem Biol. 2020. PMID: 31732432 Free PMC article.
-
Double and triple thermodynamic mutant cycles reveal the basis for specific MsbA-lipid interactions.Elife. 2024 Jan 22;12:RP91094. doi: 10.7554/eLife.91094. Elife. 2024. PMID: 38252560 Free PMC article.
-
Synthetic Approaches to Zetekitoxin AB, a Potent Voltage-Gated Sodium Channel Inhibitor.Mar Drugs. 2019 Dec 26;18(1):24. doi: 10.3390/md18010024. Mar Drugs. 2019. PMID: 31888062 Free PMC article. Review.
References
Publication types
MeSH terms
Substances
Grants and funding
LinkOut - more resources
Full Text Sources
Other Literature Sources
Miscellaneous
