. 2016 May 24;113(21):E2973-82.
doi: 10.1073/pnas.1524924113. Epub 2016 May 9.

Impaired NK-mediated regulation of T-cell activity in multiple sclerosis is reconstituted by IL-2 receptor modulation

Affiliations

Impaired NK-mediated regulation of T-cell activity in multiple sclerosis is reconstituted by IL-2 receptor modulation

Catharina C Gross et al. Proc Natl Acad Sci U S A. .

Abstract

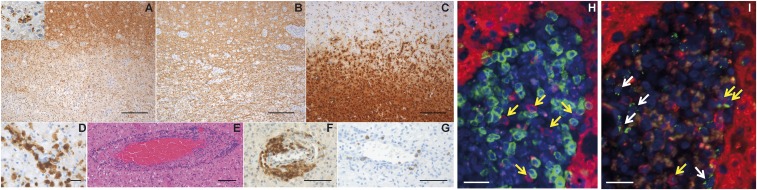
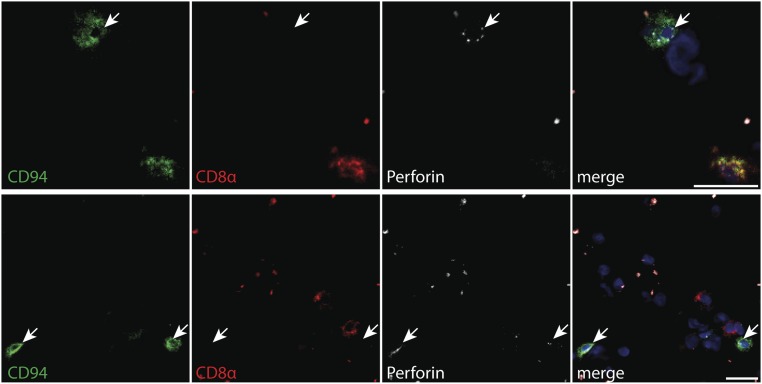
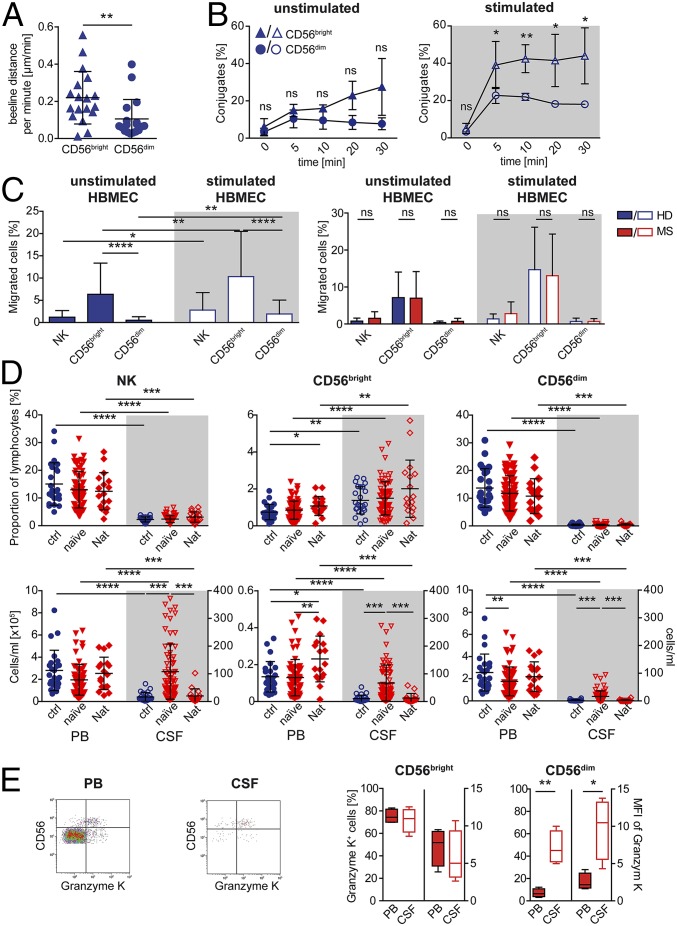
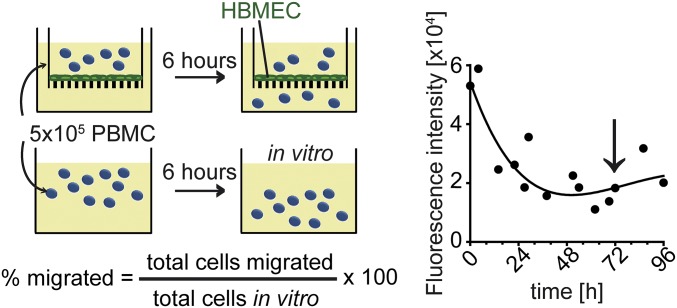
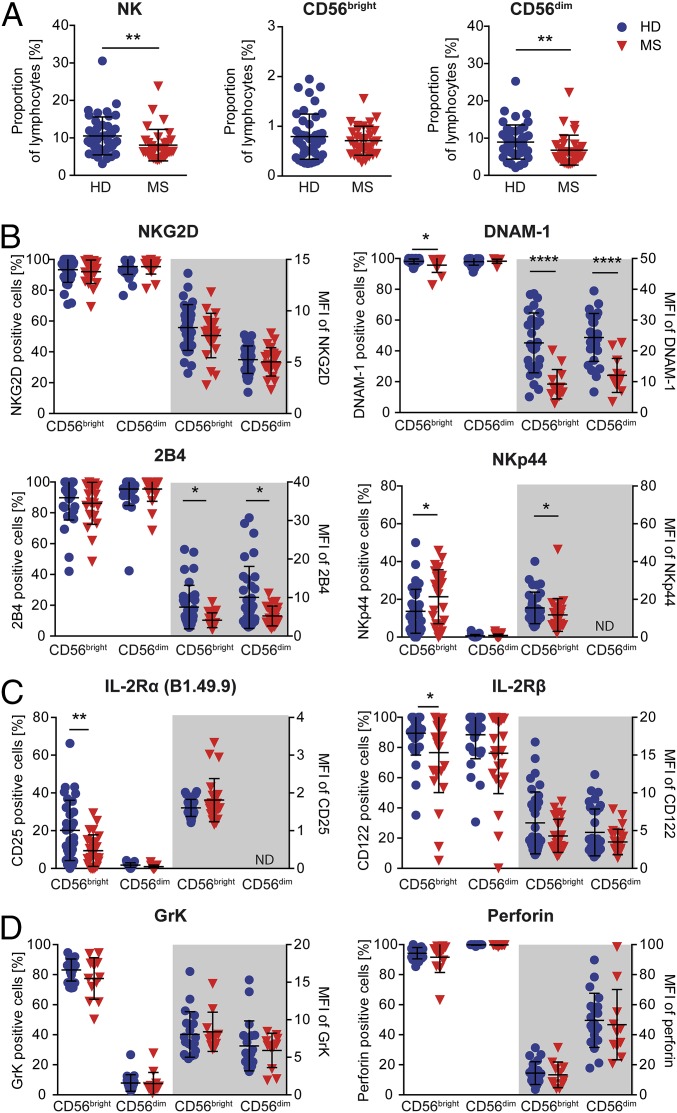
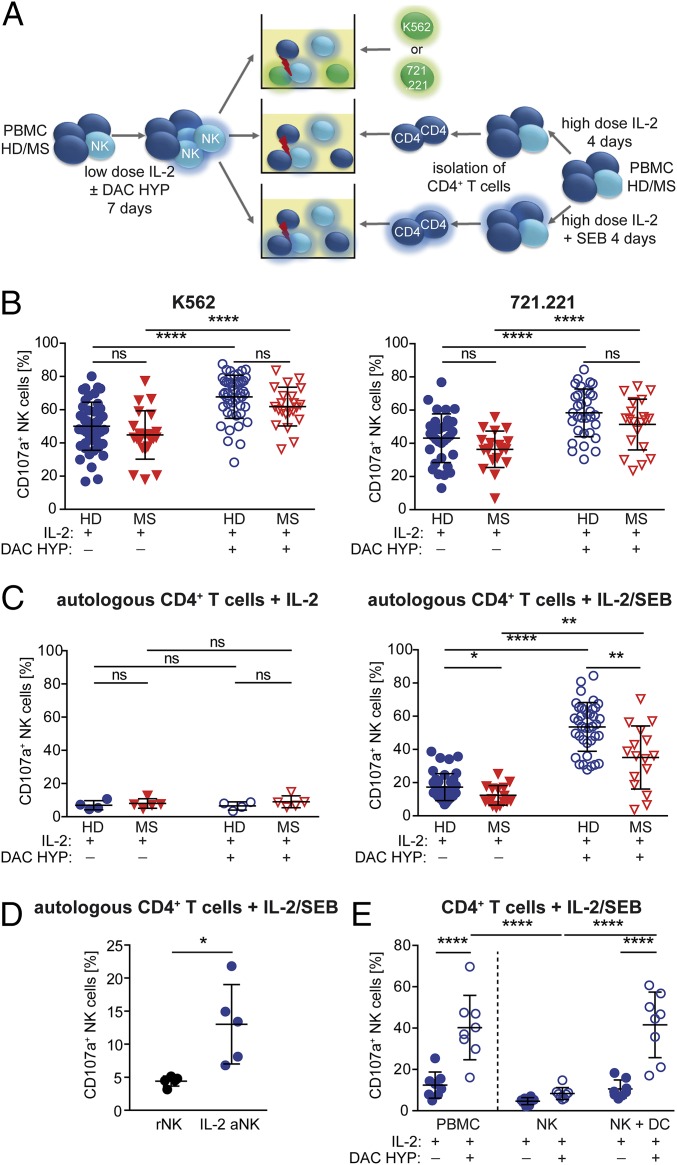
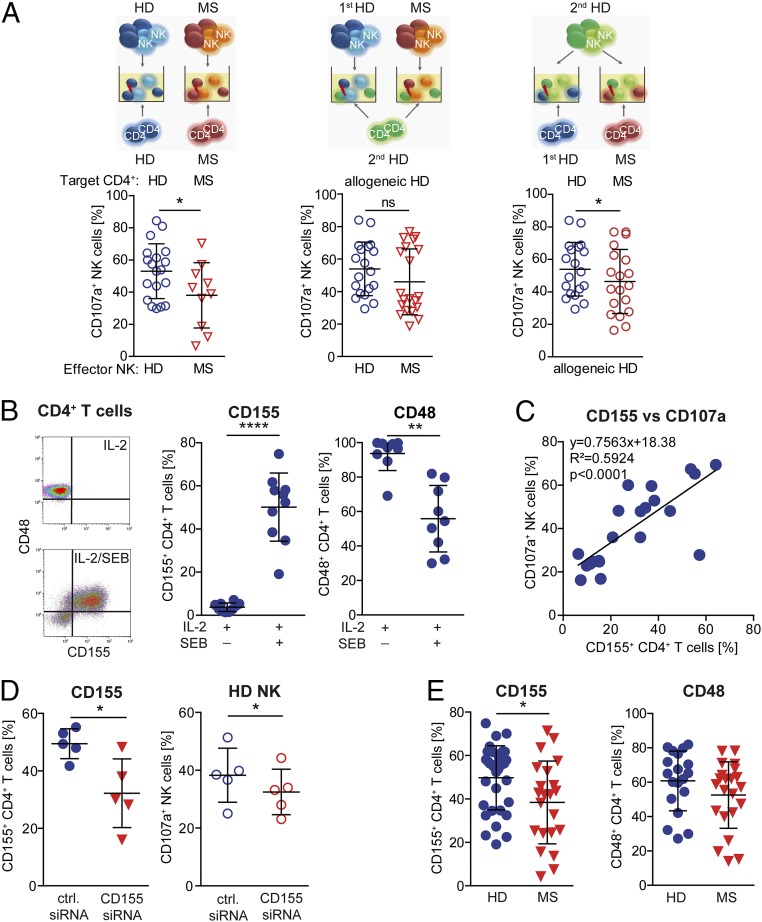
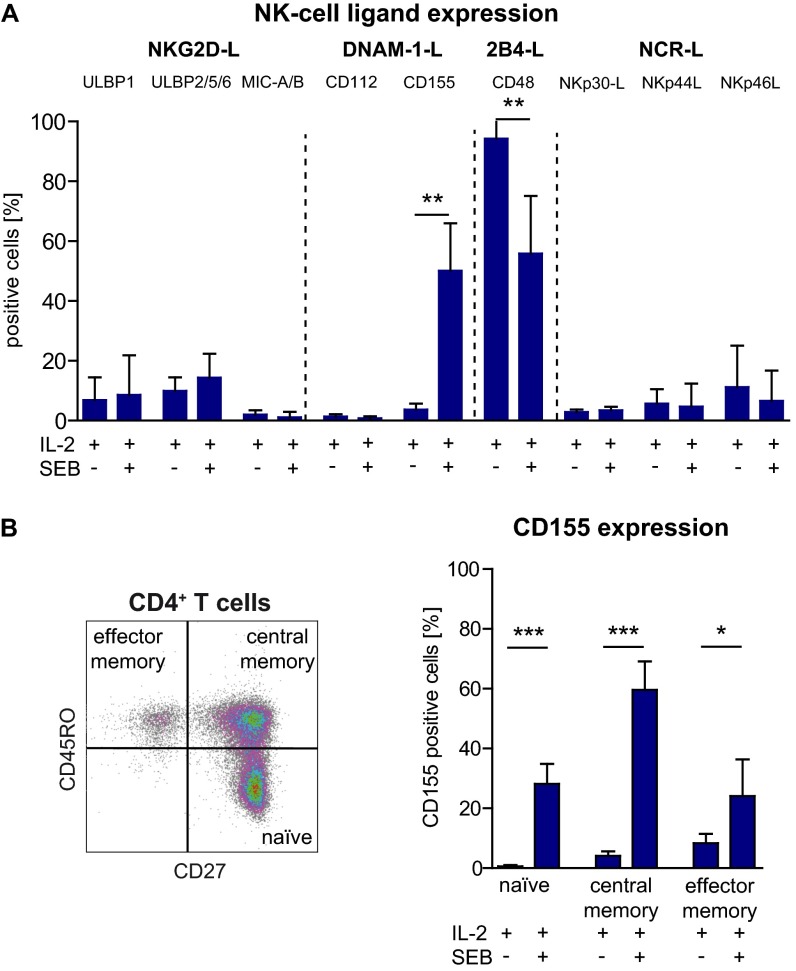
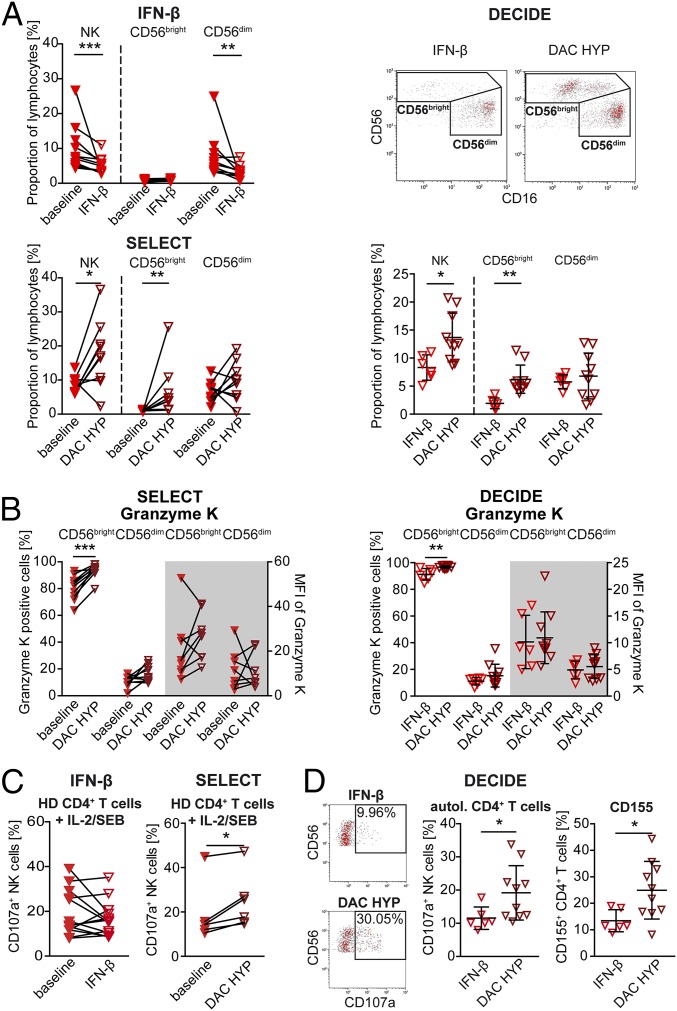
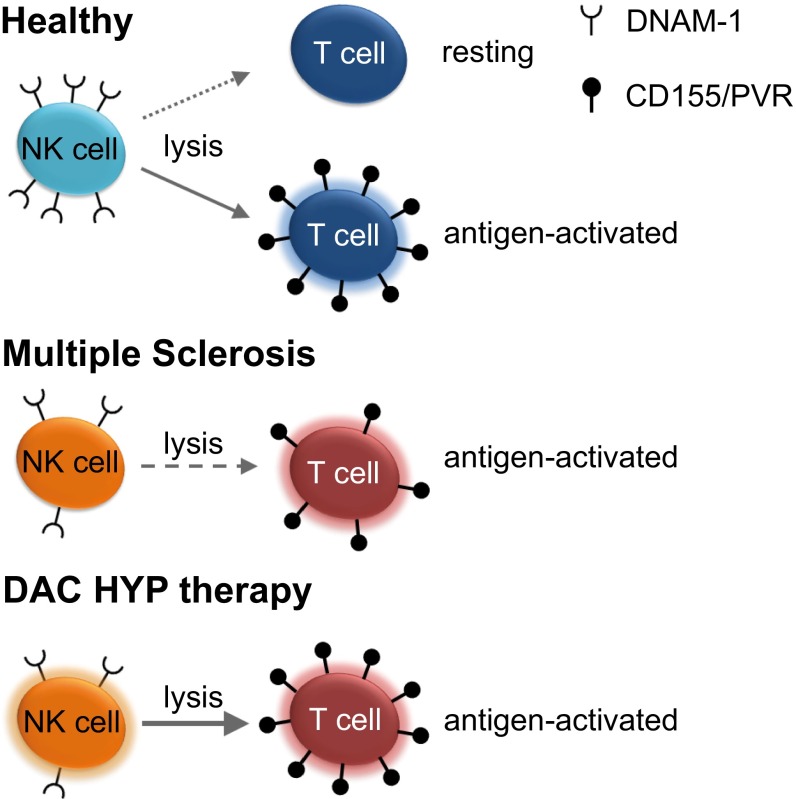
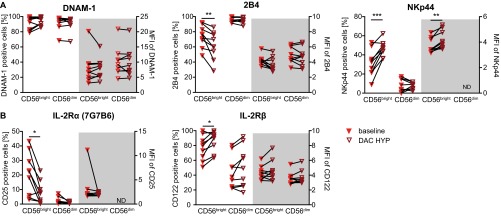
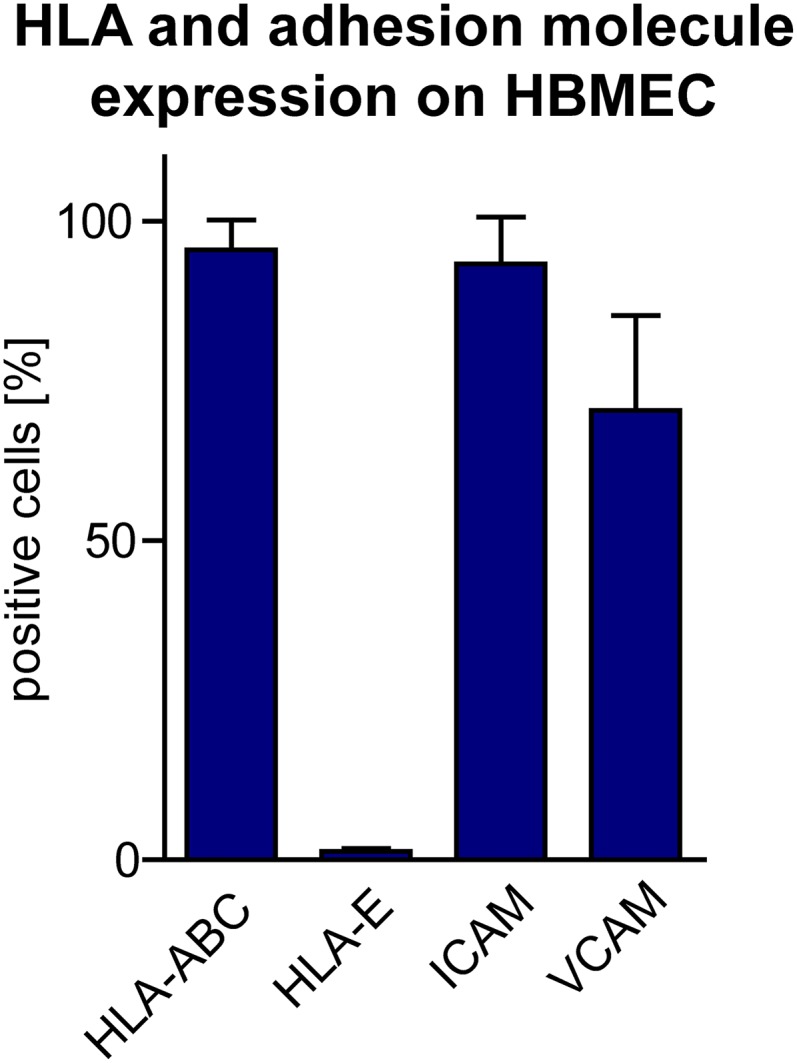
Multiple sclerosis (MS) is a chronic inflammatory autoimmune disease of the central nervous system (CNS) resulting from a breakdown in peripheral immune tolerance. Although a beneficial role of natural killer (NK)-cell immune-regulatory function has been proposed, it still needs to be elucidated whether NK cells are functionally impaired as part of the disease. We observed NK cells in active MS lesions in close proximity to T cells. In accordance with a higher migratory capacity across the blood-brain barrier, CD56(bright) NK cells represent the major intrathecal NK-cell subset in both MS patients and healthy individuals. Investigating the peripheral blood and cerebrospinal fluid of MS patients treated with natalizumab revealed that transmigration of this subset depends on the α4β1 integrin very late antigen (VLA)-4. Although no MS-related changes in the migratory capacity of NK cells were observed, NK cells derived from patients with MS exhibit a reduced cytolytic activity in response to antigen-activated CD4(+) T cells. Defective NK-mediated immune regulation in MS is mainly attributable to a CD4(+) T-cell evasion caused by an impaired DNAX accessory molecule (DNAM)-1/CD155 interaction. Both the expression of the activating NK-cell receptor DNAM-1, a genetic alteration consistently found in MS-association studies, and up-regulation of the receptor's ligand CD155 on CD4(+) T cells are reduced in MS. Therapeutic immune modulation of IL-2 receptor restores impaired immune regulation in MS by increasing the proportion of CD155-expressing CD4(+) T cells and the cytolytic activity of NK cells.

Keywords: DNAM-1; IL-2 receptor; NK cells; daclizumab; multiple sclerosis.


Conflict of interest statement

Conflict of interest statement: A.S.-M., A.R., A.P.-F., T.S.-H., S.H., K.H., M.K., M.H., K.D., R.H., and T.Z. have no financial disclosures. C.C.G. received speaker honoraria and travel expenses for attending meetings from Bayer Health Care, Genzyme, and Novartis Pharma GmbH. T.K. received honoraria for lectures from Novartis, Biogen Idec, Teva, Bayer Health Care, EXCEMED, and Sanofi Aventis, and served as a consultant for Genzyme. N.S. received honoraria for advisory boards and travel expenses from Biogen Idec. L.K. received compensation for serving on scientific advisory boards for Genzyme. L.K. received speaker honoraria and travel support from Novartis, Merck Serono, and CSL Behring. L.K. receives research support from Novartis. S.G.M. received honoraria for lecturing, travel expenses for attending meetings, and financial research support from Almirall, Bayer Health Care, Biogen, Genzyme, Merck Serono, Novartis, Novo Nordisk, Roche, Sanofi-Aventis, and Teva. H.W. received compensation for serving on Scientific Advisory Boards/Steering Committees for Bayer Healthcare, Biogen Idec, Genzyme, Merck Serono, Novartis, and Sanofi Aventis. H.W. also received speaker honoraria and travel support from Bayer Vital GmbH, Bayer Schering AG, Biogen Idec, CSL Behring, Fresenius Medical Care, Genzyme, Glaxo Smith Kline, GW Pharmaceuticals, Lundbeck, Merck Serono, Omniamed, Novartis, and Sanofi-Aventis. H.W. received compensation as a consultant from Biogen Idec, Merck Serono, Novartis, and Sanofi-Aventis. H.W. received research support from Bayer Vital, Biogen Idec, Genzyme Merck Serono, Novartis, Sanofi-Aventis Germany, and Sanofi US.

Figures

Fig. 1.
Fig. 1.
GrK-expressing NK cells are located in close proximity to T cells in MS lesions. (A) Representative immunohistochemical images of a demyelinating subcortical MS lesion characterized by loss of myelin basic protein. (Inset) A macrophage with MBP-positive degradation products within the cytoplasm indicating ongoing demyelination (anti-MBP). (B) Axons are relatively preserved (anti-neurofilament). (C) The lesion is infiltrated by numerous foamy macrophages, whereas in the periplaque gray matter, ramified microglial cells are present (anti-KiM1P). (D) The intralesional macrophages express the activation marker MRP14 (anti-MRP14). (E) Multiple vessels with perivascular lymphocytic infiltrates within the lesion (H&E staining). (F and G) The perivascular infiltrates consist of CD3+ T cells (F) and few CD20+ B cells (G). (H) CD56+CD3 NK cells (anti-CD56, red) are located in close proximity to CD3+CD56 T cells (anti-CD3, green). (I) GrK (anti-GrK, green) is polarized in CD56+CD3 NK cells (anti-CD56, red). (Scale bars: AC, 200 µm; D, 25 µm; E, 100 µm; F and G, 75 µm; H and I, 50 µm.) One representative result of three biopsies from MS patients is shown.
Fig. S1.
Fig. S1.
Expression of CD94, CD8a, and perforin in the CNS of MS patients. Frozen brain sections from MS patients were stained with mouse anti-human CD94 (1:50, HP-3D9; BD Pharmingen), mouse anti-human perforin (1:50, B-D48; Abcam) labeled with the Alexa Fluor 488 monoclonal antibody labeling kit (Invitrogen), and mouse anti-human CD8a (1:50, LT8; ABD Serotec) labeled with the Cy3 MAb labeling kit (GE Healthcare). Briefly, frozen brain sections were thawed at room temperature, fixed with acetone, and after a blocking step for 40 min with 2% (wt/vol) BSA, the antibodies were applied successively starting with anti-CD94 for 1 h at room temperature, which was detected using goat anti-mouse labeled with Alexa Fluor 647 (1:400; Life Technologies). Subsequently anti-perforin and anti-CD8a were applied for 1 h and 30 min, respectively. Staining was visualized using a Zeiss Axioscope microscope. A representative micrograph with triple fluorescence immunohistochemistry of four MS patients identifying brain-infiltrating CD8+ (red) and CD94+ (green) cells expressing perforin (white) is shown. Nuclei are stained with DAPI (blue). (Scale bar, 20 µm.)
Fig. 2.
Fig. 2.
CD56bright NK cells exhibit a higher migratory capacity in a human BBB model and are the major intrathecal NK-cell subset. (A) Covered beeline distance per minute of CD56bright (blue triangles) and CD56dim (blue circles) NK cells (n = 3 HDs) during in vitro incubation with primary HBMECs. Mann–Whitney test was used. (B) Conjugate formation of CD56bright (blue triangles) and CD56dim (blue circles) NK cells (n = 4 HDs) with unstimulated and IFN-γ/TNF-α–stimulated HBMECs. Unpaired multiple t test was used. (C) Proportions of migrated NK cells and their subpopulations derived from HDs (blue bars) (Left: n =21; Right: n = 6) or therapy-naïve MS patients (red bars) (n = 5) across unstimulated (filled bars) and stimulated (open bars) HBMECs. Wilcoxon matched-pairs signed rank test (same cell types) and Mann–Whitney test (different cell types/patient groups) were used. (D) Proportions (upper row) and total cell numbers (lower row) of NK cells (Left), CD56bright (Center), and CD56dim (Right) subsets in the PB (closed symbols) and CSF (open symbols) of therapy-naïve MS patients (red triangles down) (n = 67) and MS patients treated with natalizumab (Nat) (n = 17) in comparison with HDs (blue circles) (n = 25). Wilcoxon matched-pairs signed rank test (PB vs. CSF) and Kruskal–Wallis test with Dunn’s posttest (different patient groups) were used. (E) Representative GrK versus CD56 dot plot of CD3CD56+ NK cells derived from the PB and CSF of therapy-naïve MS patients (Left). Proportions and median fluorescence intensity (MFI) of GrK+ CD56bright and CD56dim NK cells in the PB (closed whiskers) and CSF (open whiskers) of therapy-naïve MS patients (Left) (n = 4) are displayed. Paired Student’s t test was used. Error bars indicate the SD. *P < 0.05; **P < 0.01; ***P < 0.001; ****P < 0.0001.
Fig. S2.
Fig. S2.
Human BBB model. (Left) Illustration of the human BBB model. (Right) The confluence of the HBMEC monolayer was monitored testing its permeability for Evans Blue, as previously described (73).
Fig. 3.
Fig. 3.
MS-related changes in the peripheral NK cell compartment. PBMCs derived from healthy individuals (blue circles) and therapy-naïve MS patients characterized by clinically stable disease course (red triangles down) were stained with fluorochrome-conjugated lineage-specific antibodies (CD3, CD56, and CD16) (A) and antibodies directed against activating NK-cell receptors [NKG2D (HD, n = 32; MS, n = 25), DNAM-1 (HD, n = 28; MS, n = 13), 2B4 (HD, n = 33; MS, n = 25), and NKp44 (HD, n = 33; MS, n = 25)] (B); IL-2Rα (CD25, clone B1.49.9) and IL-2Rβ (CD122) chain (HD, n = 33; MS, n = 25) (C); and the content of cytolytic granules GrK (HD, n = 19; MS, n = 15) and perforin (HD, n = 20; MS, n = 15) (D) and analyzed by flow cytometry. (A) Proportions of CD3CD56+ NK cells and NK-cell subpopulations (CD56bright and CD56dim) in the PB of HDs (n = 43) and therapy-naïve MS patients (n = 33). (BD) Percentages (left side) and MFIs (right side) of cell surface receptor-positive (B and C) and GrK- or perforin-positive (D) CD56bright and CD56dim NK cells. Error bars indicate the SD. P values were calculated with Mann–Whitney test. *P < 0.05; **P < 0.01; ****P < 0.0001.
Fig. 4.
Fig. 4.
Impact of IL-2R modulation on NK-cell cytolytic activity. (A) Experimental setup: CD4+ T cells were isolated from PBMCs of HDs or therapy-naïve stable MS patients stimulated for 4 d with IL-2 with or without SEB. For NK-cell activation, PBMCs of HDs (blue circles) or MS patients (red triangles down) were stimulated for 7 d with IL-2 with or without DAC HYP. Release of cytolytic granules (degranulation) of IL-2–stimulated (closed symbols) or IL-2/DAC HYP-stimulated (open symbols) CD3CD56+ NK cells in response to K562 (HD, n = 24; MS, n = 22) (B, Left), 721.221 (HD, n = 32; MS, n = 20) (B, Right), and autologous IL-2–stimulated (HD, n = 4; MS, n = 5) (C, Left) or IL-2/SEB-stimulated (HD, n = 38; MS, n = 16) (C, Right) CD4+ target cells was analyzed. (D) Degranulation of resting (black circles) and IL-2–activated (blue circles) NK cells (n = 5 HDs) in response to autologous IL-2/SEB-stimulated CD4+ T cells. (E) PBMCs, NK cells, and NK cells plus DCs (n = 8 HDs) were stimulated for 7 d with IL-2 with or without DAC HYP, and degranulation in response to IL-2/SEB-activated CD4+ target cells was determined. D’Agostino–Pearson omnibus normality test was performed to test for Gaussian distribution. Depending on the result, unpaired Student’s t test or Mann–Whitney test was used to compare means between two independent groups, whereas paired Student’s t test or Wilcoxon matched-pairs signed rank test was used for different treatments within the same patient group. *P < 0.05; **P < 0.01; ****P < 0.0001.
Fig. 5.
Fig. 5.
Impaired DNAM-1/CD-155 interactions result in lower cytolytic activity of NK cells in MS. (A) Illustration of crisscross experiments to investigate defective NK-mediated immune regulation in MS (upper row). (A, Left and Center) Degranulation of IL-2/DAC HYP-stimulated NK cells derived from HDs (blue circles; n = 19) or MS patients (red triangles; n = 10) in response to IL-2/SEB–activated CD4+ T cells derived from the same donor (syngenic setup) (Left) or an independent HD (allogeneic setup) (Center). (A, Right) Degranulation of IL-2/DAC HYP-stimulated NK cells of HDs in response to allogeneic IL-2/SEB-activated CD4+ T cells derived either from HDs (blue circles) or MS patients (red circles). Unpaired Student’s t test (Left), Mann–Whitney test (Center), and paired Student’s t test (Right) were used. (B, Left) Dot plot showing CD155 and CD48 expression on CD4+ T cells stimulated for 4 d with IL-2 and IL-2/SEB. (B, Center and Right) Proportions of CD155-expressing (n = 10) (Center) and CD48-expressing (n = 9) (Right) IL-2 with or without SEB-activated CD4+ T cells derived from HDs. Wilcoxon matched-pairs signed rank test was used. (C) Proportions of CD107a+ NK cells after coincubation with syngenic CD4+ T cells stimulated for 2 and 4 d with IL-2/SEB displayed against proportions of the corresponding CD155+ CD4+ T cells. Correlation was analyzed by Pearson test. (D, Left) Proportions of CD155-expressing CD4+ T cells transfected with control (blue circles) or CD155-specific siRNA (red triangles) during stimulation with IL-2/SEB. (D, Right) Degranulation of syngenic NK cells in response to control (blue circles) or CD155-specific siRNA-treated (red circles) activated CD4+ target cells. Paired Student’s t test. (E) Expression of CD155 (n = 33HD/22MS) (Left) and CD48 (n = 19 HDs/22 MS patients) (Right) on CD4+ T cells derived from HDs (blue circles) or MS patients (red triangles) following 4-d stimulation with IL-2/SEB. Unpaired Student’s t test was used. Error bars indicate the SD. *P < 0.05; **P < 0.01; ****P < 0.0001.
Fig. S3.
Fig. S3.
Expression of distinct NK-cell receptor ligands on IL-2 with or without SEB-activated CD4+ T cells. (A) CD4+ T cells (n = 10 HDs) were stimulated for 4 d with IL-2 or IL-2/SEB, and the expression of the indicated ligands for the respective NK-cell receptors was determined by flow cytometry using fluorochrome-conjugated antibodies or NCR-Fc proteins in the case of the NCR ligands. Proportions of NK-cell ligand-expressing CD4+ T cells are displayed. (B, Left) Representative dot blot (n = 5 HDs) showing the distribution of CD27+CD45RO naïve, CD27+CD45RO+ central memory, and CD27CD45RO+ effector memory CD4+ T cells. (B, Right) CD155 expression on IL-2– or IL-2/SEB-activated CD4+ T-cell subsets. Error bars indicate the SD. P values were calculated by Wilcoxon matched-pairs signed rank test. *P < 0.05; **P < 0.01; ***P < 0.01.
Fig. 6.
Fig. 6.
Therapeutic IL-2R modulation in MS patients restores impaired immune-regulatory function of NK cells via up-regulation of the DNAM-1 ligand CD155. Phenotype and function of NK cells derived from MS patients before (closed red triangles down) and after 1-y treatment with IFN-β (open red triangles down) (n = 13) or with DAC HYP (open cayenne triangles down; SELECT study, n = 9) were investigated. Furthermore, phenotype and function of NK cells derived from 16 MS patients of the DECIDE study were investigated in a blinded fashion. Unblinding revealed that 6 patients had received IFN-β and 10 patients had received DAC HYP. (A) Proportions of NK cells and their subsets from the indicated trials are displayed. Representative CD16 versus CD56 plots of NK cells (Upper Right) from the DECIDE trial are shown. Wilcoxon matched-pairs signed rank test (IFN-β; SELECT) and unpaired Student’s t test (DECIDE) were used. (B) Proportions and MFI of GrK-expressing CD56bright and CD56dim NK cells from the SELECT (Left) and DECIDE (Right) trials. Wilcoxon matched-pairs signed rank test (SELECT) and unpaired Student’s t test (DECIDE) were used. (C) Degranulation of IL-15–stimulated (48 h) NK cells at baseline (closed red triangles down) and after 1-y treatment with IFN-β (open red triangles down) (n =13) or DAC HYP (open cayenne triangles down; SELECT study) (n = 6) in response to IL-2/SEB-activated allogeneic CD4+ T cells derived from independent HDs. Paired Student’s t test was used. (D, Left and Center) Representative CD107a versus CD56 plots of NK cells (Left) and proportions (Center) of degranulating IL-15–activated NK cells from the IFN-β (open red triangles) or DAC HYP (open cayenne triangles) arm of the DECIDE study in response to autologous (autol.) IL-2/SEB-activated (48 h) CD4+ T cells (Center). (D, Right) Proportions of CD155+ CD4+ T cells derived from MS patients treated with either IFN-β (open red triangles down) or DAC-HYP (open cayenne triangles down) following 48 h of stimulation with IL-2/SEB. Unpaired Student’s t test was used. *P < 0.05; **P < 0.01.
Fig. 7.
Fig. 7.
Working hypothesis. Antigen-triggered up-regulation of the DNAM-1 ligand CD155 renders CD4+ T cells more sensitive to NK cell-mediated lysis (Left). Impaired immune-regulatory functions of NK cells in MS patients are attributable to reduced up-regulation of CD155 on antigen-activated T cells on the one hand and lower expression of its receptor DNAM-1 on NK cells on the other hand (Center). Therapeutic immune modulation with DAC HYP restores defective immune-regulatory function of NK cells by both improving their cytolytic capacity as well as increasing CD155 expression on CD4+ T cells (Right).
Fig. S4.
Fig. S4.
In vivo impact of DAC HYP on NK cell-activating and cytokine receptors. PBMCs derived from the PB of MS patients (n = 9) from the SELECT trial at baseline (closed red triangle down) and after 52 wk of DAC HYP treatment (open cayenne triangles down) were stained with fluorochome-conjugated lineage-specific antibodies (CD3, CD56, and CD16) and antibodies directed against activating NK-cell receptors (DNAM-1, 2B4, and NKp44) (A) and IL-2R α-chain (CD25, clone 7G7B6) and β-chain (CD122) (B). Percentages (left side of the graph) and MFIs (gray background of cell surface receptor-positive CD56bright and CD56dim NK subsets) are displayed. Error bars indicate the SD. Wilcoxon matched-pairs signed rank test was performed. *P < 0.05; **P < 0.01; ***P < 0.0001.
Fig. S5.
Fig. S5.
HLA and adhesion molecule expression on HBMECs. Expression of HLA-A/B/C, HLA-E, ICAM, and VCAM was analyzed by flow cytometry on HBMECs using the respective fluorochrome-conjugated antibodies. Error bars indicate the SD of n = 3 independent experiments.

Comment in

References

    1. Dendrou CA, Fugger L, Friese MA. Immunopathology of multiple sclerosis. Nat Rev Immunol. 2015;15(9):545–558. - PubMed
    1. Kingwell E, et al. Incidence and prevalence of multiple sclerosis in Europe: A systematic review. BMC Neurol. 2013;13(128):128. - PMC - PubMed
    1. Sawcer S, et al. International Multiple Sclerosis Genetics Consortium; Wellcome Trust Case Control Consortium 2 Genetic risk and a primary role for cell-mediated immune mechanisms in multiple sclerosis. Nature. 2011;476(7359):214–219. - PMC - PubMed
    1. Wiendl H, Gross CC. Modulation of IL-2Rα with daclizumab for treatment of multiple sclerosis. Nat Rev Neurol. 2013;9(7):394–404. - PubMed
    1. Cerboni C, et al. Antigen-activated human T lymphocytes express cell-surface NKG2D ligands via an ATM/ATR-dependent mechanism and become susceptible to autologous NK-cell lysis. Blood. 2007;110(2):606–615. - PubMed

Publication types

MeSH terms

Substances