Clinical Trial
. 2016 May 24;113(21):E3002-11.
doi: 10.1073/pnas.1603712113. Epub 2016 May 9.

Epigenomic profiling reveals an association between persistence of DNA methylation and metabolic memory in the DCCT/EDIC type 1 diabetes cohort

Collaborators, Affiliations
Clinical Trial

Epigenomic profiling reveals an association between persistence of DNA methylation and metabolic memory in the DCCT/EDIC type 1 diabetes cohort

Zhuo Chen et al. Proc Natl Acad Sci U S A. .

Abstract

We examined whether persistence of epigenetic DNA methylation (DNA-me) alterations at specific loci over two different time points in people with diabetes are associated with metabolic memory, the prolonged beneficial effects of intensive vs. conventional therapy during the Diabetes Control and Complications Trial (DCCT) on the progression of microvascular outcomes in the long-term follow-up Epidemiology of Diabetes Interventions and Complications (EDIC) Study. We compared DNA-me profiles in genomic DNA of whole blood (WB) isolated at EDIC Study baseline from 32 cases (DCCT conventional therapy group subjects showing retinopathy or albuminuria progression by EDIC Study year 10) vs. 31 controls (DCCT intensive therapy group subjects without complication progression by EDIC year 10). DNA-me was also profiled in blood monocytes (Monos) of the same patients obtained during EDIC Study years 16-17. In WB, 153 loci depicted hypomethylation, and 225 depicted hypermethylation, whereas in Monos, 155 hypomethylated loci and 247 hypermethylated loci were found (fold change ≥1.3; P < 0.005; cases vs. controls). Twelve annotated differentially methylated loci were common in both WB and Monos, including thioredoxin-interacting protein (TXNIP), known to be associated with hyperglycemia and related complications. A set of differentially methylated loci depicted similar trends of associations with prior HbA1c in both WB and Monos. In vitro, high glucose induced similar persistent hypomethylation at TXNIP in cultured THP1 Monos. These results show that DNA-me differences during the DCCT persist at certain loci associated with glycemia for several years during the EDIC Study and support an epigenetic explanation for metabolic memory.

Keywords: DNA methylation; TXNIP; diabetic complications; epigenetics; metabolic memory.


Conflict of interest statement

The authors declare no conflict of interest.

Figures

Fig. 1.
Fig. 1.
Experimental design. The experiments and related data analyses are summarized in the depicted pipeline.
Fig. 2.
Fig. 2.
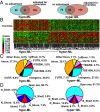
DMLs between cases and controls identified in WB genomic DNAs collected at the EDIC Study baseline. DMLs with FC ≥ 1.3 and P < 0.005 in cases vs. controls were identified. (A) Venn diagrams depicting hypo- and hyper-MLs in cases with and without adjustment for covariates, including age, gender, WBC compositions, and complications. (B) Heat map of DMLs in cases vs. controls. DNA-me levels of each DML (rows) across all of the cases and controls (columns) after unsupervised hierarchical clustering analysis (SI Appendix S1, SI Methods) are shown. Green indicates DNA-me below the average of all of the samples, and red indicates DNA-me above the average level. (C) Genomic locations of (Left) hypo-ML and (Right) hyper-ML relative to RefSeq genes. Locations were classified to one of the following eight regions: TSS1500 (1,500 bp upstream to 200 bp upstream of TSS), TSS200 (200 bp upstream of TSS), 5′ UTR, the first exon (1st Exon), 3′ UTR, other exon (excluding the first exon), and intron and intergenic regions. (D) Locations of (Left) hypo-MLs and (Right) hyper-MLs in regions defined relative to CGI (Island). These regions include island, N_shore and S_shore (up to 2 kb upstream and downstream of CGI), N_Shelf and S_Shelf (2–4 kb upstream and downstream of CGI), and open sea (the remaining genomic regions). DMLs after adjustment for covariates were analyzed in B–D.
Fig. 3.
Fig. 3.
DMLs located in RefSeq genes or their flanking regions in WB. (A) Percentage of hypo- and hyper-MLs in CpG sites covered in the array mapping to the same regions across RefSeq genes and their 5-kb upstream and downstream regions. Each CpG was annotated to one RefSeq transcript if it is located in 1 of 30 subregions that covered the gene body [from TSS (Tx Start) to end site (Tx End)] or its 5-kb flanking regions. The percentages of hypo- and hyper-MLs in CpG sites covered in the array at each subregion were calculated and plotted (SI Appendix S1, SI Methods). (B) Bean plots of DNA-me levels of three sets of CpGs including hypo-MLs (hypo), hyper-MLs (hyper), or all other CpGs after exclusion steps (others) in cases and controls. Based on CpG sites’ location, each set was further classified into five groups as labeled at the bottom. Body represents the groups located in gene bodies but not in UTRs. The distribution of DNA-me levels (M values) of each group in cases and controls is presented by two-sided bean plots (left-side density plot in black is for controls, and right-side density plot in gray is for cases). The overall average of DNA-me for each group is depicted as horizontal short lines. (C) Top network identified among the genes containing DMLs in their promoters (up to 1,500 bp upstream of TSS) or gene bodies by IPA. Red nodes represent the genes containing hyper-MLs, whereas green ones represent the genes with hypo-MLs, and color intensity indicates FC in cases vs. controls. Solid lines indicate direct interactions, and dashed lines refer to indirect interactions.
Fig. 4.
Fig. 4.
DMLs between cases and controls identified in genomic DNAs isolated from Monos collected in the EDIC Study years 16 and 17. DMLs with FC ≥ 1.3 and P < 0.005 in cases vs. controls were identified by multiple linear regression models. (A) Venn diagrams depicting hypo- and hyper-MLs in cases identified with and without adjustment for age and gender. (B) Bean plots for DNA-me levels of all CpG sites except DMLs (others), hypo-MLs (hypo), and hyper-MLs (hyper) in cases and controls. Details are in Figs. 2 and 3.
Fig. 5.
Fig. 5.
Persistence of DNA-me over 16–17 y by comparing DMLs identified in WB (the EDIC Study baseline) with those in Monos (the EDIC Study years 16 and 17) and vice versa. (A) Venn diagram of hypo-MLs identified in WB and Monos. Only the hypo-MLs located in RefSeq gene bodies/promoters were counted. The two solid green ellipses represent hypo-MLs identified in WB and Monos, and the two dotted green half ellipses represent loci depicting trends of hypo-me in cases vs. controls at a lower confidence level (P < 0.05). The overlapping region (bright green) of the two solid lines depicts the hypo-MLs found in both WB and Monos, whereas the overlapping regions (light green) between the solid ellipse of one sample set and the dotted ellipse of the other sample set represent the hypo-MLs in one sample set (WB or Monos) with similar trends of hypo-me in the other sample set. Similar Venn diagrams in red were generated for the hyper-MLs in C. (B) The mean DNA-me differences between cases and controls at the hypo-MLs or hyper-MLs similarly modified in WB and Monos (represented in the overlapping regions of the Venn diagrams in A and C) are shown in heat maps ac, with the corresponding annotated gene symbols depicted on the right side. Green is used to represent hypo-MLs, and red is used to represent hyper-MLs.
Fig. 6.
Fig. 6.
Correlations on DNA-me levels at DMLs identified in both WB and Monos. The Pearson correlations of DNA-me at 12 annotated DMLs identified in both WB and Monos DNA samples were analyzed between the two sample sets across 61 participants. Among them, 10 were significantly correlated, including (A) 5 highly correlated (correlation coefficients; r > 0.9) and (B) 5 moderately correlated (0.5 < r < 0.8). For each of these DMLs, scatterplots generated with DNA-me (M values) of WB are presented on the y axis, and those generated with DNA-me of Monos are presented on the x axis. The Infinium probe identification and its annotated gene are shown on the top of each plot. Coefficients with P values are listed at the bottom of each box. Cases are presented as red dots, and controls are presented as blue dots.
Fig. 7.
Fig. 7.
Hypo-me at the TXNIP 3′ UTR and its validations in WB, Monos, and lymphocytes. (A) DNA-me at three CpG sites in 3′ UTR of TXNIP named as CpG1 (chromosome 1: 145,441,517), CpG2 (chromosome 1: 145,441,526), and CpG3 (chromosome 1: 145,441,552; also, the DML identified at CG19693031 in Infinium 450K array) were measured. (B) Highly statistically significant hypo-me in WB (32 cases vs. 31 controls) and Monos (31 cases vs. 30 controls) at CpG3 by 450K array. Covariates-adjusted P values by multiple linear regressions are presented. (C) Validations by pyrosequencing of hypo-me at CpG1–3 in WB (30 cases vs. 30 controls). (D–F) Validations by amplicon-seq of hypo-me (16 cases vs. 16 controls) at the CpG1–3 in (D) WB, (E) Monos, and (F) lymphocytes as indicated at the bottom of each plot. Wilcoxon rank-sum tests on β-values were performed on validation data. Mean DNA-me difference in β-values (diff) and P values for each comparison are depicted at the bottom. Details of the validation methods were described in SI Appendix S1, SI Methods. Ctrl, control.
Fig. 8.
Fig. 8.
Association of DNA-me with patient HbA1c at DMLs identified in WB and Monos. (A) The associations between DNA-me and HbA1c levels at the indicated times periods of the DCCT/EDIC Study at WB DMLs. For each DML, Spearman correlation was calculated between its DNA-me levels and mean HbA1c levels at different time periods across all patients in both WB and Monos (only the time periods that are earlier than the sample collection are shown). The HbA1c values at different time periods for each participant are presented by five values: the DCCT mean, the EDIC Study baseline, the EDIC Study mean, the EDIC Study years 16 and 17, and pre-DCCT/DCCT/EDIC Study mean (details are in SI Appendix S1, Fig. S5A). The matrix of Spearman correlation coefficients (ρ) was subjected to unsupervised clustering and is shown as heat maps, in which each row represents one DML and each column represents ρ at a specified time period as shown at the top of the heat map. Yellow represents negative correlation, and blue represents positive correlation. Mean DNA-me differences between cases and controls in WB are shown in Left, with green for hypo-MLs and red for hyper-MLs. (B) A similar figure was generated for Monos DMLs. The red dashed boxed areas highlight the DMLs depicting similar trends of association between DNA-me and HbA1c in both WB and Monos.
Fig. 9.
Fig. 9.
TXNIP expression and DNA-me levels at the three CpG sites in TXNIP 3′ UTR induced by HG in cultured THP-1 Monos. TXNIP expression and DNA-me at three TXNIP 3′ UTRs in six samples were measured by RT-PCR and amplicon-seq, respectively. The six THP1 samples labeled a–f are a, cultured in NG for 72 h; b, cultured in HG for 72 h; c, sample a retained in NG for 96 more h; d, sample b switched from HG to NG and cultured in NG for 96 more h; e, sample c continued to be cultured in NG for 72 more h; and f, sample d switched from NG to HG and kept in HG for 72 more h. (A) TXNIP expression measured by RT-PCR in samples a–f. Details of RT-PCR are described in SI Appendix S1, SI Methods. Data shown are the averages of samples run in triplicates. Statistically significant increase in TXNIP expression (P < 0.0001; t test) was found in b vs. a and f vs. e. (B–D) DNA-me levels at three CpG sites (CpG1–3), respectively, in TXNIP 3′ UTR were obtained by amplicon-seq (details are in SI Appendix S1, SI Methods). The DNA-me levels (β-values) at each CpG site are the average from two separate experiments generated based on at least 10,000 sequences obtained by amplicon-seq in each of two experiments.

References

    1. Writing Team for the Diabetes Control and Complications Trial/Epidemiology of Diabetes Interventions and Complications Research Group Effect of intensive therapy on the microvascular complications of type 1 diabetes mellitus. JAMA. 2002;287(19):2563–2569. - PMC - PubMed
    1. DCCT/EDIC research group Effect of intensive diabetes treatment on albuminuria in type 1 diabetes: Long-term follow-up of the Diabetes Control and Complications Trial and Epidemiology of Diabetes Interventions and Complications study. Lancet Diabetes Endocrinol. 2014;2(10):793–800. - PMC - PubMed
    1. Nathan DM. DCCT/EDIC Research Group The diabetes control and complications trial/epidemiology of diabetes interventions and complications study at 30 years: Overview. Diabetes Care. 2014;37(1):9–16. - PMC - PubMed
    1. Villeneuve LM, Natarajan R. The role of epigenetics in the pathology of diabetic complications. Am J Physiol Renal Physiol. 2010;299(1):F14–F25. - PMC - PubMed
    1. Ihnat MA, Thorpe JE, Ceriello A. Hypothesis: The ‘metabolic memory’, the new challenge of diabetes. Diabet Med. 2007;24(6):582–586. - PubMed

Publication types