. 2016 May 24;113(21):6047-52.
doi: 10.1073/pnas.1523629113. Epub 2016 May 9.

Architecture of retinal projections to the central circadian pacemaker

Affiliations

Architecture of retinal projections to the central circadian pacemaker

Diego Carlos Fernandez et al. Proc Natl Acad Sci U S A. .

Abstract

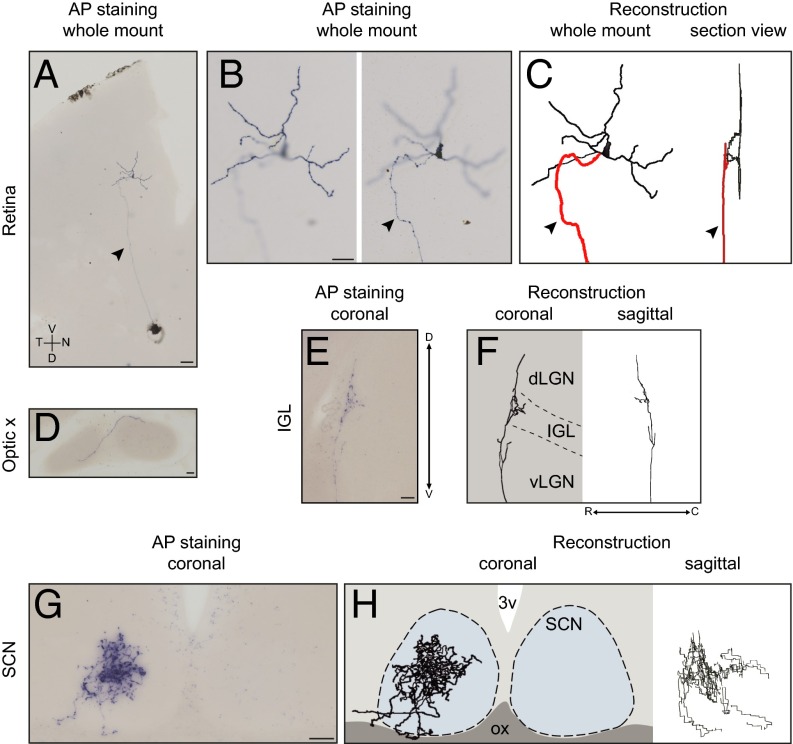
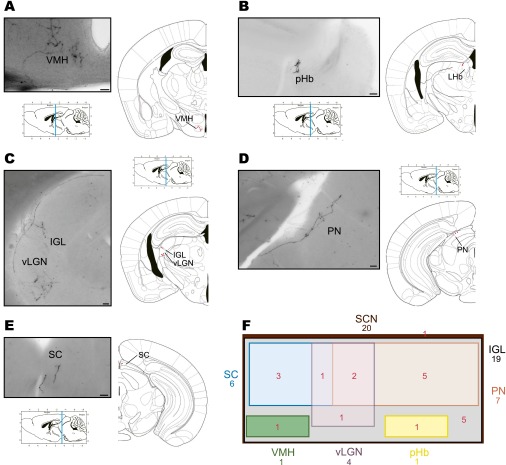
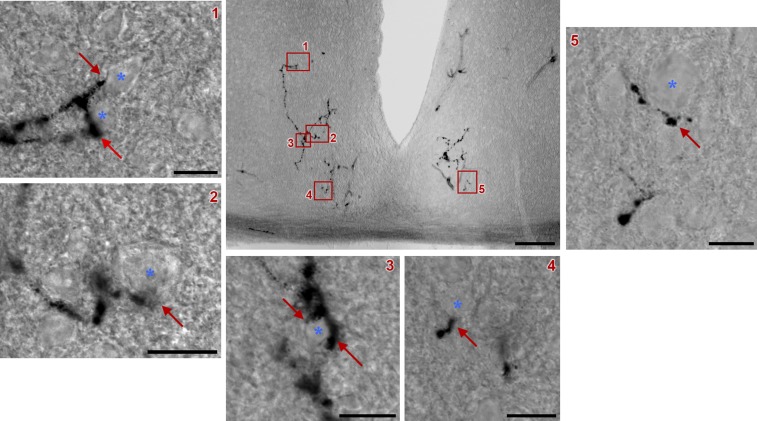
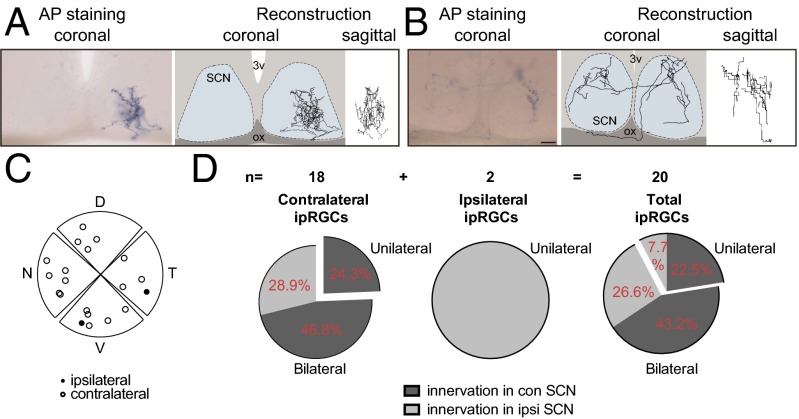
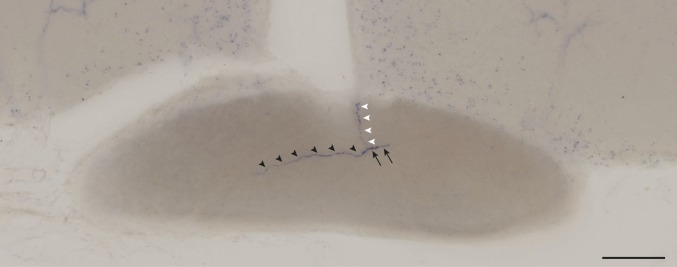
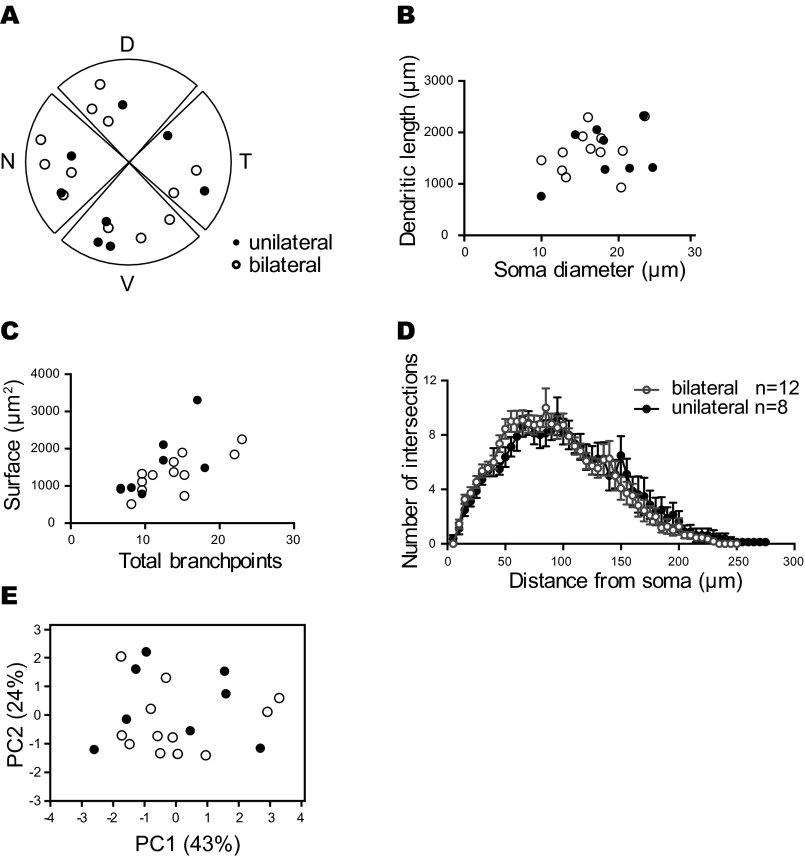
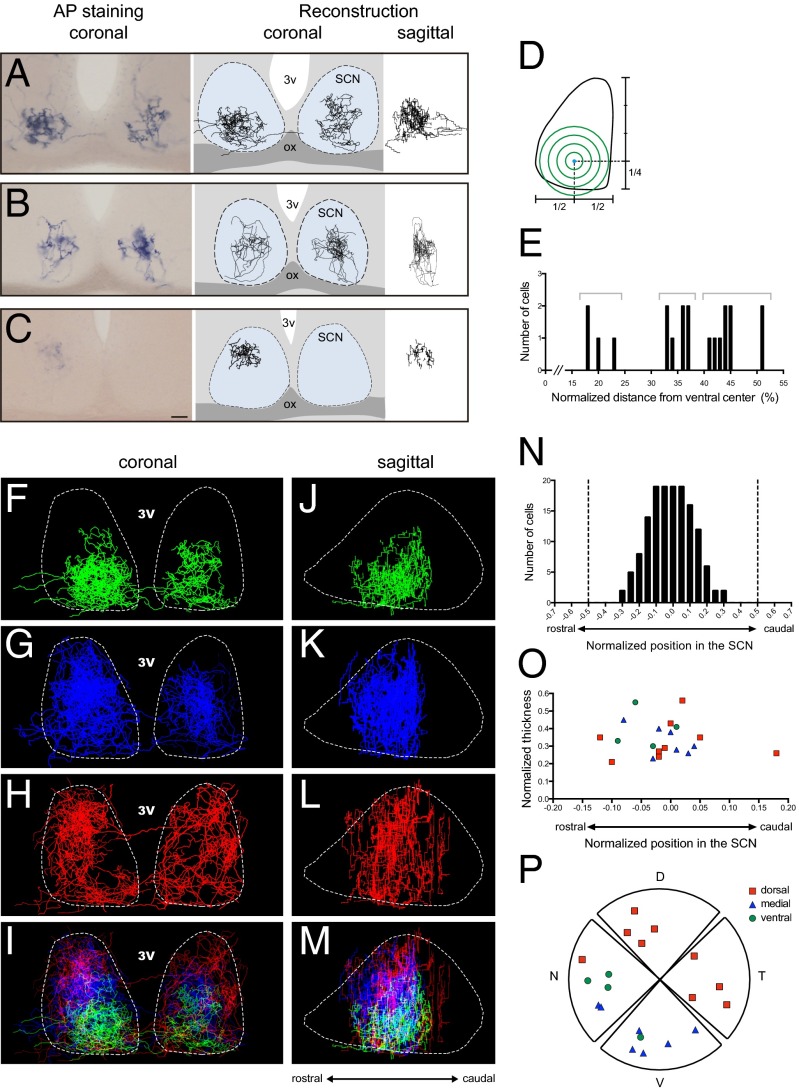
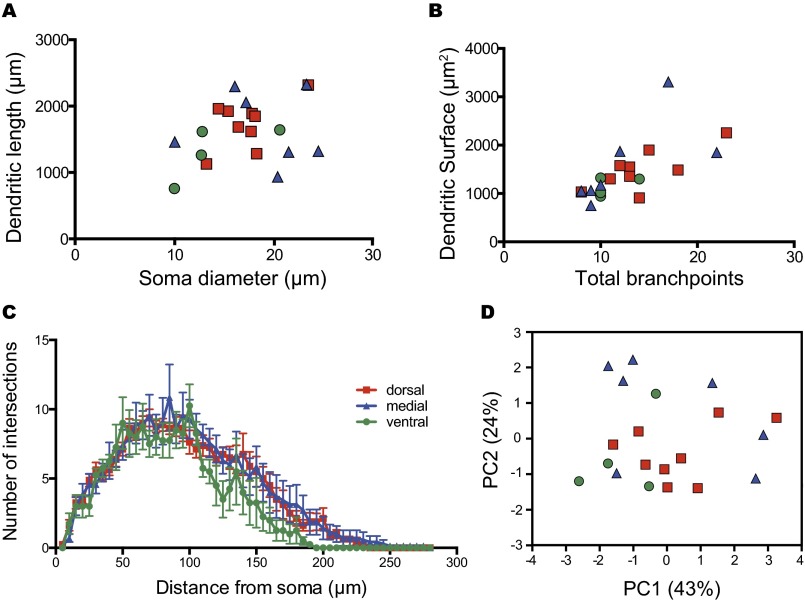
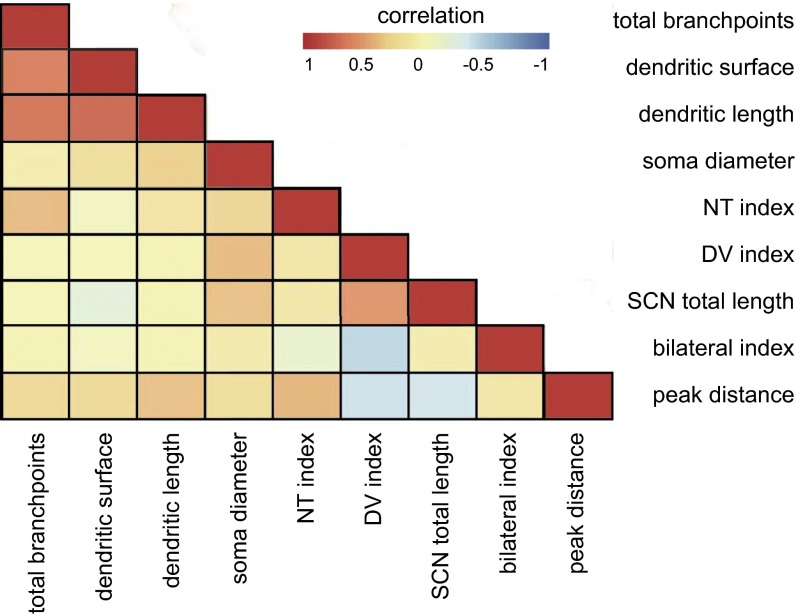
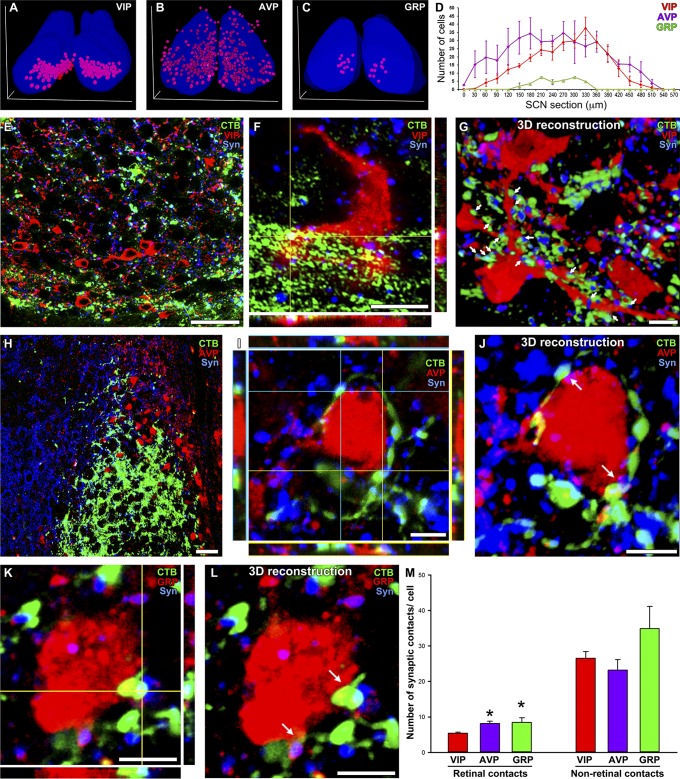
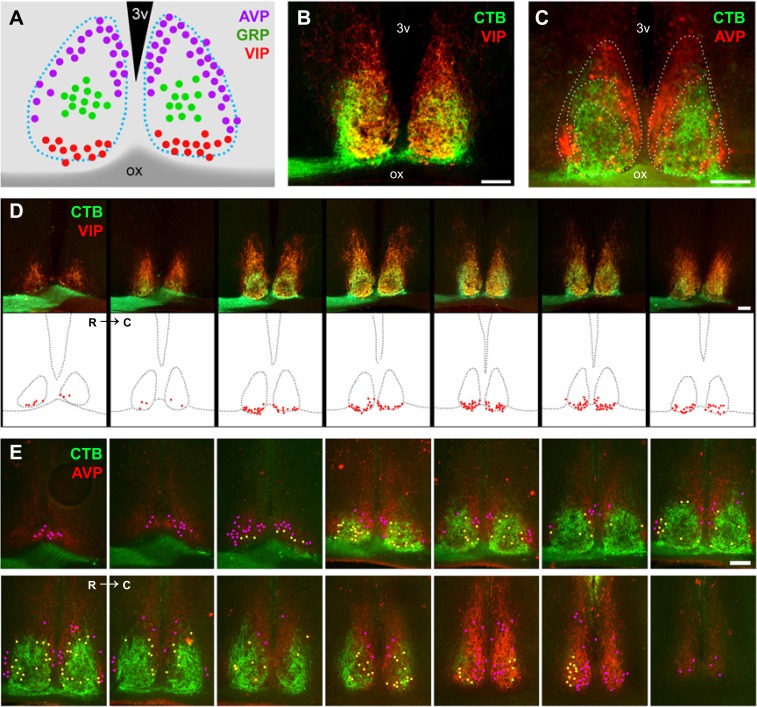
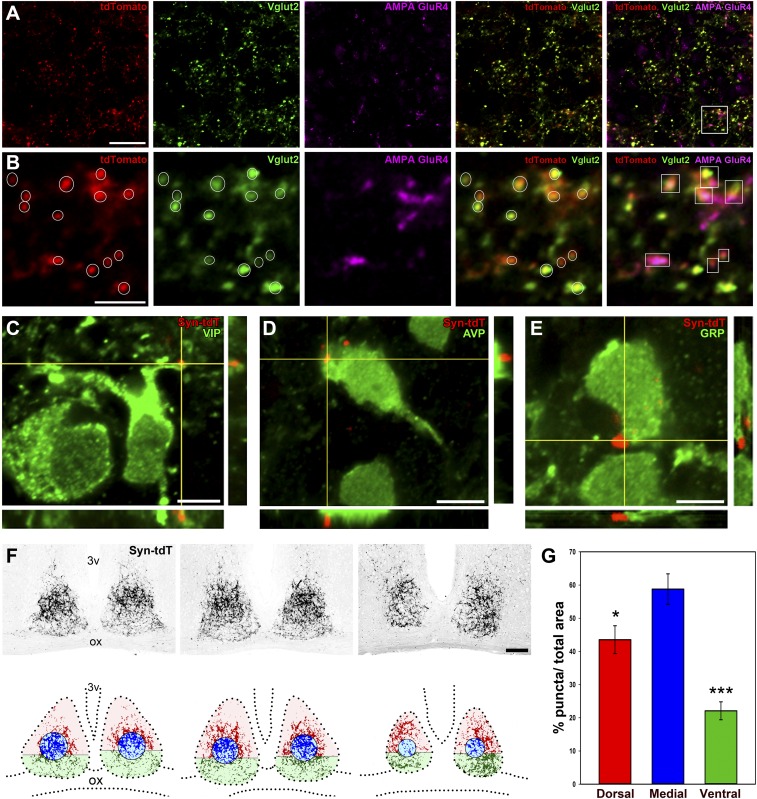
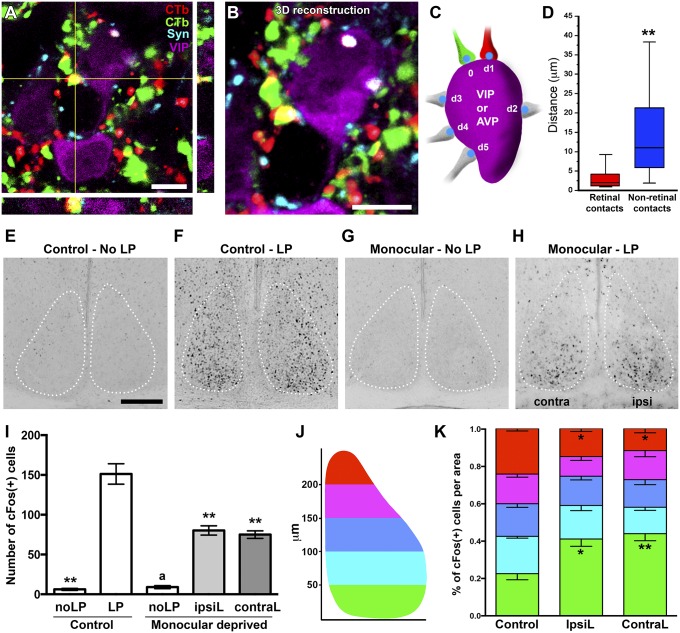
The suprachiasmatic nucleus (SCN) receives direct retinal input from the intrinsically photosensitive retinal ganglion cells (ipRGCs) for circadian photoentrainment. Interestingly, the SCN is the only brain region that receives equal inputs from the left and right eyes. Despite morphological assessments showing that axonal fibers originating from ipRGCs cover the entire SCN, physiological evidence suggests that only vasoactive intestinal polypeptide (VIP)/gastrin-releasing peptide (GRP) cells located ventrally in the SCN receive retinal input. It is still unclear, therefore, which subpopulation of SCN neurons receives synaptic input from the retina and how the SCN receives equal inputs from both eyes. Here, using single ipRGC axonal tracing and a confocal microscopic analysis in mice, we show that ipRGCs have elaborate innervation patterns throughout the entire SCN. Unlike conventional retinal ganglion cells (RGCs) that innervate visual targets either ipsilaterally or contralaterally, a single ipRGC can bilaterally innervate the SCN. ipRGCs form synaptic contacts with major peptidergic cells of the SCN, including VIP, GRP, and arginine vasopressin (AVP) neurons, with each ipRGC innervating specific subdomains of the SCN. Furthermore, a single SCN-projecting ipRGC can send collateral inputs to many other brain regions. However, the size and complexity of the axonal arborizations in non-SCN regions are less elaborate than those in the SCN. Our results provide a better understanding of how retinal neurons connect to the central circadian pacemaker to synchronize endogenous circadian clocks with the solar day.

Keywords: circadian; ipRGCs; melanopsin; non-image–forming functions; suprachiasmatic nucleus.


Conflict of interest statement

The authors declare no conflict of interest.

Figures

Fig. 1.
Fig. 1.
Dendritic and axonal reconstruction of a single M1 ipRGC. Representative images of alkaline phosphatase staining and 3D reconstruction from a single ipRGC are shown. A single M1 ipRGC was labeled in the left retina (AC); its axon crossed the midline in the optic chiasm (D), extensively innervated the contralateral side of the SCN (G and H), and collaterally projected to the IGL (E and F). C, caudal; D, dorsal; dLGN, dorsal part of the lateral geniculate nucleus; N, nasal; ox, optic chiasm; 3v, third ventricle; V, ventral; vLGN, ventral part of the lateral geniculate nucleus; R, rostral; T, temporal. The arrowheads and red trace indicate the axon. Dashed lines are estimations of the boundary of the SCN and IGL. [Scale bars: 100 μm (A); 50 μm (BG).]
Fig. S1.
Fig. S1.
Schematic representation of the mouse genetic lines. Opn4CreERT2, which was previously validated, has Cre recombination upon tamoxifen injection. Z/AP is a Cre-dependent reporter line. This inducible Cre-LoxP system functions in a dose-dependent manner; therefore, we could control the number of ipRGCs that express AP in Opn4CreERT2/+; Z/AP mice. R26Syp/tdT is another Cre-dependent reporter line (Jackson Laboratory, stock no. 012570). With a high dose of tamoxifen, most ipRGCs express Synaptophysin–tdTomato in axonal terminals in Opn4CreERT2/+; R26Syp/tdT mice.
Fig. S2.
Fig. S2.
A single M1 ipRGC innervates multiple brain targets. Representative images of brain targets from a single ipRGC in the mouse are shown in AE. Single ipRGCs innervate the SCN and send collateral projections to the ventral medial hypothalamus (VMH) (A), peri-Habenular region (pHb) (B), intergeniculate leaflet (IGL) and ventral part of the lateral geniculate nucleus (vLGN) (C), pretectal nucleus (PN) (D), and superior colliculus (SC) (E). (F) Venn diagram showing the overlap between brain nuclei innervated from 20 individual ipRGCs. The surface is proportional to the percentage of ipRGC innervation to brain targets. (Scale bars: 50 μm.)
Fig. S3.
Fig. S3.
Axonal architectures of a single ipRGC in the IGL. A single ipRGC densely innervated the thin sheet IGL. (AC) Series of coronal sections of IGL were shown from the rostral (A) to the caudal (C). Dashed lines are estimations of the boundary of the IGL. (Scale bar: 50 μm.)
Fig. S4.
Fig. S4.
ipRGC axonal terminals within the SCN. A representative coronal section of the SCN after AP staining is shown (Scale bar: 100 μm.) Retinal fibers from a single ipRGC (arrows) are in close contact with neurons (asterisks) located in different SCN regions (Scale bars: 10 μm.) In most cases, clear terminal swellings were observed. Red boxes 1–5 from the central image are magnified for better viewing.
Fig. 2.
Fig. 2.
Bilateral innervation of a single ipRGC contributes to the symmetrical input to the SCN. (A and B) Representative images showing a single unilateral ipRGC innervating the ipsilateral side of the SCN (A) and a bilateral ipRGC innervating both contralateral and ipsilateral sides of the SCN (B). (C) Spatial distribution of cell bodies in the retina for ipsilaterally (closed circles) and contralaterally (open circles) projecting ipRGCs. (D) Pie charts of innervation percentages in the contralateral and ipsilateral SCN from ipRGCs. n = 20. (Scale bar: 50 μm.)
Fig. S5.
Fig. S5.
The axon branches at the optic chiasm. An ipRGC axon (black arrow) crossed the midline and formed an axon branch at the optic chiasm. One axon innervated the contralateral side (black arrowheads) and the other axon innervated the ipsilateral side (white arrowheads). (Scale bar: 100 μm.)
Fig. S6.
Fig. S6.
Unilateral and bilateral projecting ipRGCs have similar somato-dendritic features. (A) Composed spatial distribution of the cell bodies from unilateral (closed circle) and bilateral (open circle) projecting ipRGCs. Although unilateral and bilateral ipRGCs showed distinct axonal architectures in the SCN, they were similarly distributed in the retina. (BE) Dendritic morphology of unilateral (closed circle) and bilateral (open circle) projecting ipRGCs showed similar properties in xy scatter plot with soma diameter versus dendritic length (B), total branch points versus dendritic surface (C), and dendritic Sholl analysis (D). In addition, unilateral and contralateral projecting cells are clustered together in the PCA plotted with components 1 (PC1, 43% of explained variance) and 2 (PC2, 24% of explained variance) using all somato-dendritic features from 20 cells (E).
Fig. 3.
Fig. 3.
A single ipRGC preferentially innervates a specific region of the SCN. (AC) Representative images of single ipRGCs that innervate the ventral (A), medial (B), or the dorsal (C) SCN region. (Scale bar: 50 μm.) (D) Scheme of the axonal Sholl analysis with the center in the ventral region of the SCN. (E) The intersection peak distribution of the axonal Sholl analysis from the ventral region of the SCN. (FM) Superimposed images of axon fibers of ventrally targeting (F and J), medially targeting (G and K), dorsally targeting (H and L), and total (I and M) ipRGC projections (FH and JL merged by maximum intensity, I and M merged by summation). (N) Accumulation plot of ipRGC axon fields in the SCN in sagittal view. Dashed lines indicate the rostral and caudal boundaries of the SCN. (O) Relative sagittal position of each ipRGC axonal field center and their thicknesses in the SCN (in N and O, position was normalized to the total SCN thickness). (P) Spatial distribution of cell bodies from ventral (green), medial (blue), and dorsal (red) SCN-targeting ipRGCs. ox, optic chiasm; 3v, third ventricle.
Fig. S7.
Fig. S7.
Ventral, medial, and dorsal SCN-targeting ipRGCs have similar somato-dendritic features. Dendritic morphology of ventral (green circle, n = 4), medial (blue triangle, n = 7), and dorsal (red rectangle, n = 9) SCN-targeting ipRGCs showed similar properties in xy scatter plot with soma diameter versus dendritic length (A), total branch points versus dendritic surface (B), and dendritic Sholl analysis (C). In addition, ventral, medial, and dorsal SCN-targeting ipRGCs are clustered together in the PCA plotted with components 1 (PC1, 43% of explained variance) and 2 (PC2, 24% of explained variance) using all somato-dendritic features from 20 cells (D).
Fig. S8.
Fig. S8.
Dendritic-axonal correlation of ipRGCs. Heat map shows the correlation between all of the dendritic and axonal properties of ipRGCs. Red indicates strong positive correlation and blue indicates strong negative correlation. DV index: dorsal-ventral index; NT index: nasal-temporal index; peak distance: the distance of the peak intersection of axonal Scholl analysis in the SCN; SCN total length: total axonal length in the SCN; total branchpoints: total dendritic branchpoints.
Fig. 4.
Fig. 4.
Retinal postsynaptic targets in the SCN. (AD) Quantification and topographic distributions of vasoactive intestinal polypeptide (VIP+), arginine vasopressin (AVP+), and gastrin-releasing peptide (GRP+) cells in the SCN. (E and F) A representative confocal image showing VIP+ cells innervated by retinal axons. A colocalization analysis for VIP (cell-type marker), synaptophysin (presynaptic marker), and CTβ (retinal axonal marker) was applied to determine a synaptic contact (triple-colocalization point). Only a few retinal synaptic contacts were observed in the somas of VIP+ cells. (G) The 3D reconstruction of a VIP+ cell showing that most of the retinal contacts were on the processes of the cell (arrows). (H and I) A representative confocal image showing that AVP+ cells are located in the shell of the SCN and have received direct retinal innervation. (J) The 3D reconstruction of a AVP+ cell showing that many retinal contacts were on the cell body (arrows). (K and L) Similarly, most GRP+ cells, which are located in the medial core area, received retinal inputs (arrows). (M) Quantification analysis of the total retinal and nonretinal synaptic contacts per cell type. *P < 0.05 vs. VIP+ cells by Tukey’s test. Data are the mean ± SE (n = 25–30 cells). [Scale bars: 5 μm (F, G, and IL); 25 μm (E and H).]
Fig. S9.
Fig. S9.
Topography of peptidergic neurons in the SCN. (A) VIP, GRP, and AVP cells show a particular topography in the SCN. VIP cells (B and D) are located in the most ventral SCN. Most VIP cells are in close contact with retinal fiber coming from the optic chiasm. AVP cells (C and E) were found in the shell area. Based on retinal projections and the potential innervation, AVP cells were divided into two distinct populations: AVP cells located in the outer nonretinorecipient shell (cells in magenta) and AVP cells located in the internal shell region that receives retinal innervation (cells in yellow). C, caudal; ox, optic chiasm; R, rostral; 3v, third ventricle. (Scale bars: 100 μm.)
Fig. S10.
Fig. S10.
ipRGC presynaptic map into the SCN. The pattern of retinal synaptic input was evaluated using Opn4CreERT2/+;ROSASynaptophysin–tdTomato mice, in which the synaptophysin–tdTomato fusion protein is expressed under the control of the melanopsin promoter after a tamoxifen injection. Coronal SCN sections were immunostained with Vglut2 and AMPA GluR4 antibodies (A). Higher-magnification details are shown in B. We found that most tdTomato puncta colocalized with Vglut2 puncta (white circles) in close apposition with AMPA GluR4 puncta (white boxes). Representative confocal images from a vasoactive intestinal polypeptide (VIP+) cell (C), an arginine vasopressin (AVP+) cell (D), and a gastrin-releasing peptide (GRP+) cell (E) receiving direct ipRGC inputs are shown. A dense synaptic map of retinal-SCN connectivity was observed (F); tdTomato expression was found throughout the entire SCN. Three representative images from the rostral, medial, and caudal portions of the SCN are shown (F, Upper). A binary mask of tdTomato expression is presented (F, Lower). The SCN was divided into medial (blue), ventral (green), and dorsal (red) areas, and the percentage of the total area covered by tdTomato was quantified (G). A higher density of tdTomato puncta was observed in the medial SCN region, compared with the ventral and dorsal SCN areas. *P < 0.05 and ***P < 0.001 vs. the medial SCN by Tukey’s test. Data are the mean ± SE (n = 5). C, caudal; ox, optic chiasm; R, rostral; 3v, third ventricle. [Scale bars: 5 μm (BE); 20 μm (A); 100 μm (F).]
Fig. 5.
Fig. 5.
Bilateral retinal innervation to the SCN. A representative confocal image (A) and 3D reconstruction (B) showing VIP cell receiving innervation from both retinas (red CTβ from right eye and green CTβ from left eye). (C) The diagram for distribution analysis. (D) Retinal inputs displayed a particular pattern of innervation with both retinal synaptic contacts in close apposition. n = 15–20 cells, **P < 0.01, by Student’s t test. (E and F) c-Fos immunostaining of the SCN from mouse received no light (E) or a light pulse (1,000 lx) during the active phase (CT 14) (F). (G and H) In monocular-deprived mice, a similar light pulse stimulus still induced a sustained number of c-Fos+ cells. (I) Quantification of c-Fos+ cell number in the SCN from EH. No significant differences were observed between the ipsilateral (IpsiL) and contralateral (ContraL) sides of the SCN in monocular-deprived mice. n = 5; **P < 0.001 vs. control-LP and aP < 0.001 vs. monocular-deprived mice (IpsiL and ContraL) by Tukey’s test. (J) The diagram for topographic distribution analysis. (K) Quantification of the c-Fos(+) cells topographic distribution in the SCN from control mice and the IpsiL or ContraL SCN regions from monocular-deprived mice. *P < 0.05 and **P < 0.001 vs. the control by Tukey’s test. [Scale bars: 5 μm (A and B); 100 μm (E).] Data are the mean ± SE.

Similar articles

Cited by

References

    1. DeCoursey PJ. Circadian photoentrainment: Parameters of phase delaying. J Biol Rhythms. 1986;1(3):171–186. - PubMed
    1. Hattar S, et al. Melanopsin and rod-cone photoreceptive systems account for all major accessory visual functions in mice. Nature. 2003;424(6944):76–81. - PMC - PubMed
    1. Wässle H. Parallel processing in the mammalian retina. Nat Rev Neurosci. 2004;5(10):747–757. - PubMed
    1. Morin LP. Neuroanatomy of the extended circadian rhythm system. Exp Neurol. 2013;243:4–20. - PMC - PubMed
    1. Hattar S, Liao HW, Takao M, Berson DM, Yau KW. Melanopsin-containing retinal ganglion cells: Architecture, projections, and intrinsic photosensitivity. Science. 2002;295(5557):1065–1070. - PMC - PubMed

Publication types