

Ectopic expression of ceramide synthase 2 in neurons suppresses neurodegeneration induced by ceramide synthase 1 deficiency
- PMID: 27162368
- PMCID: PMC4889366
- DOI: 10.1073/pnas.1522071113
Ectopic expression of ceramide synthase 2 in neurons suppresses neurodegeneration induced by ceramide synthase 1 deficiency
Abstract
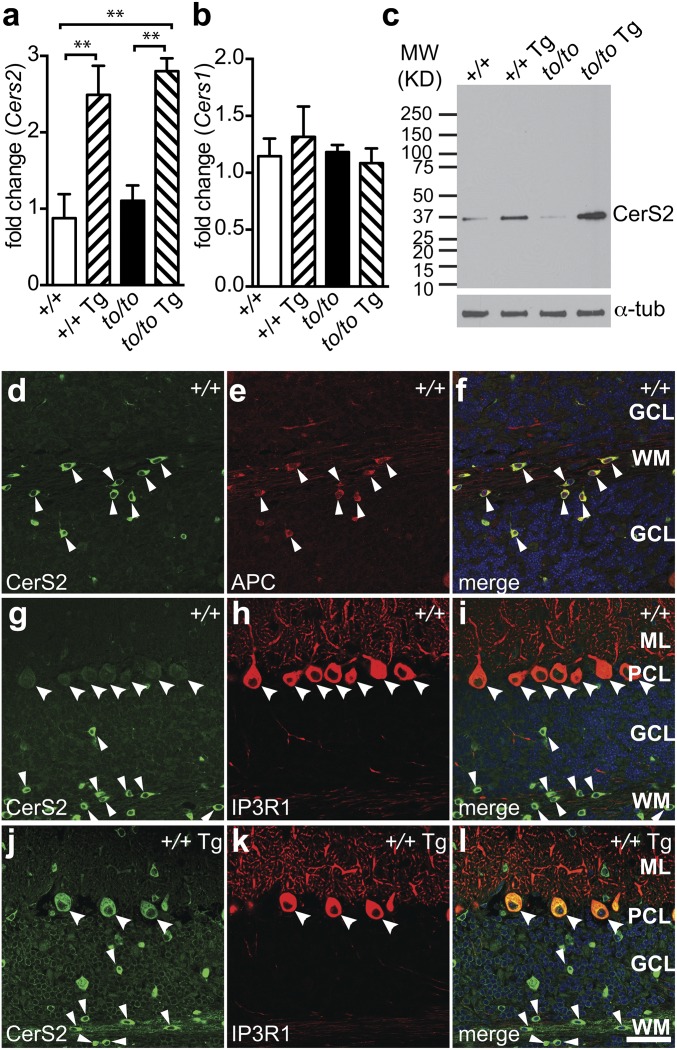
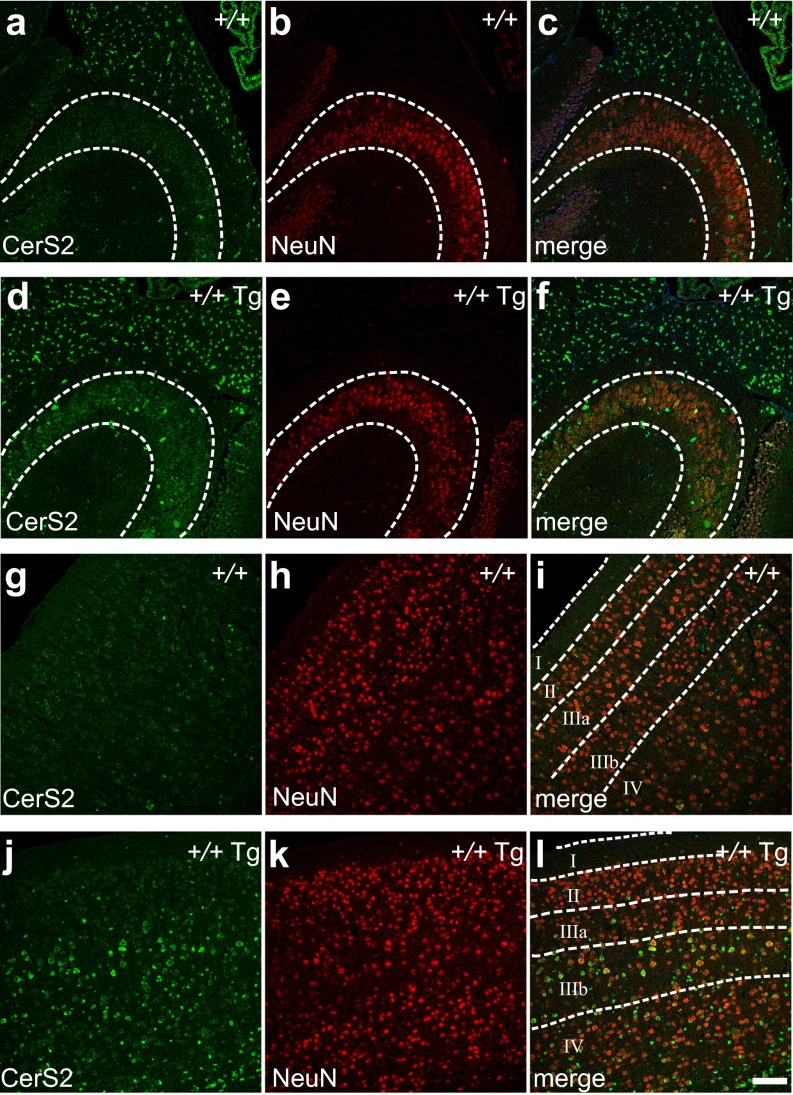
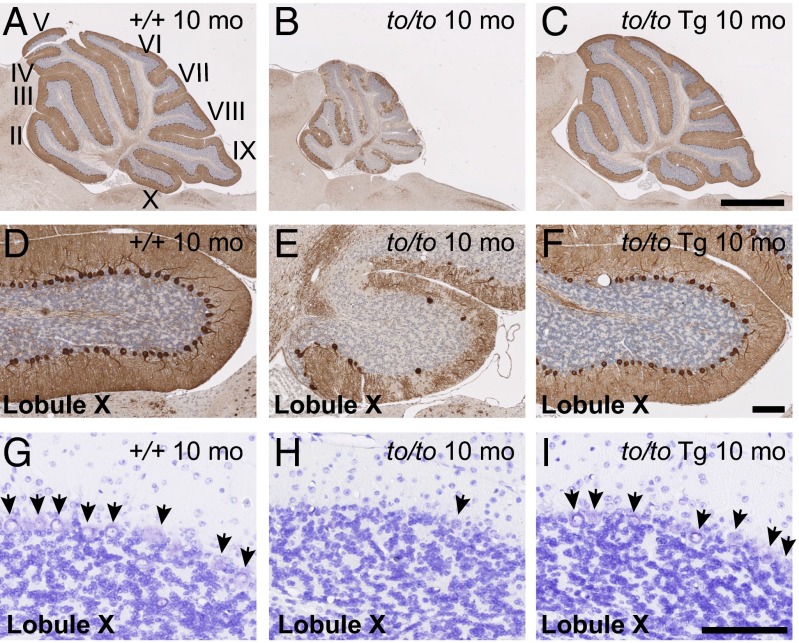
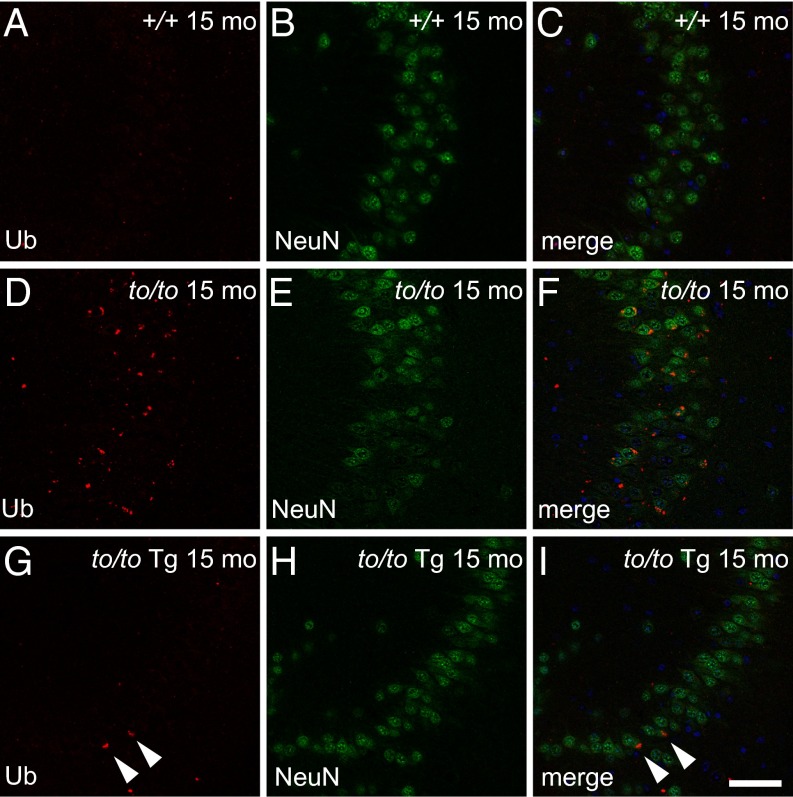
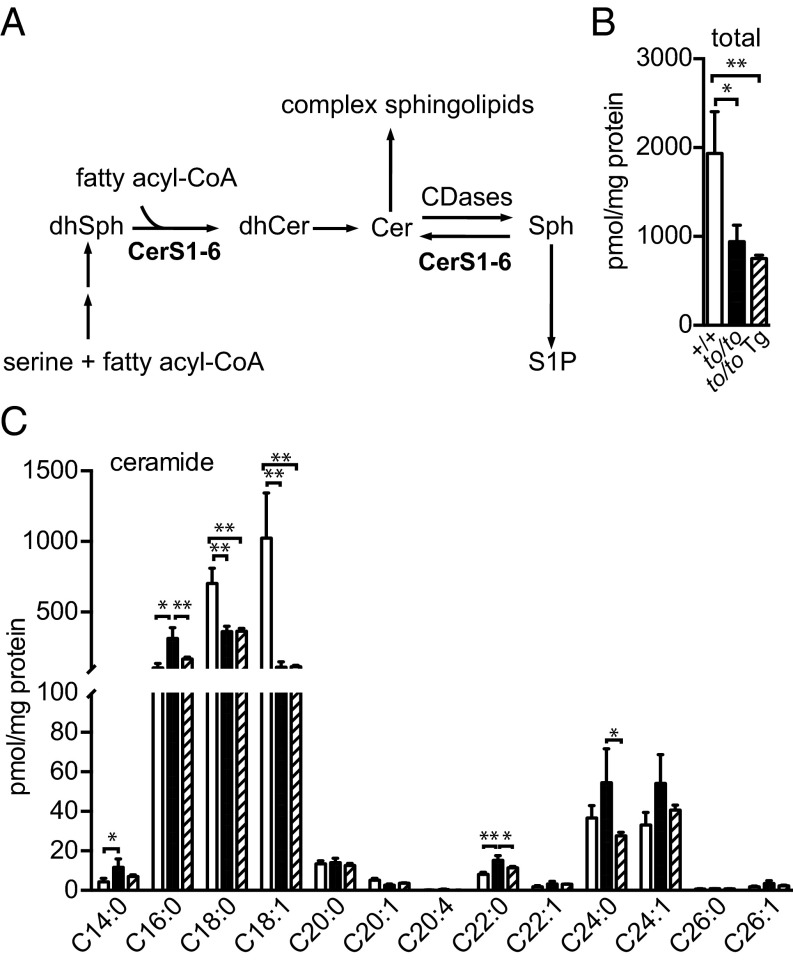
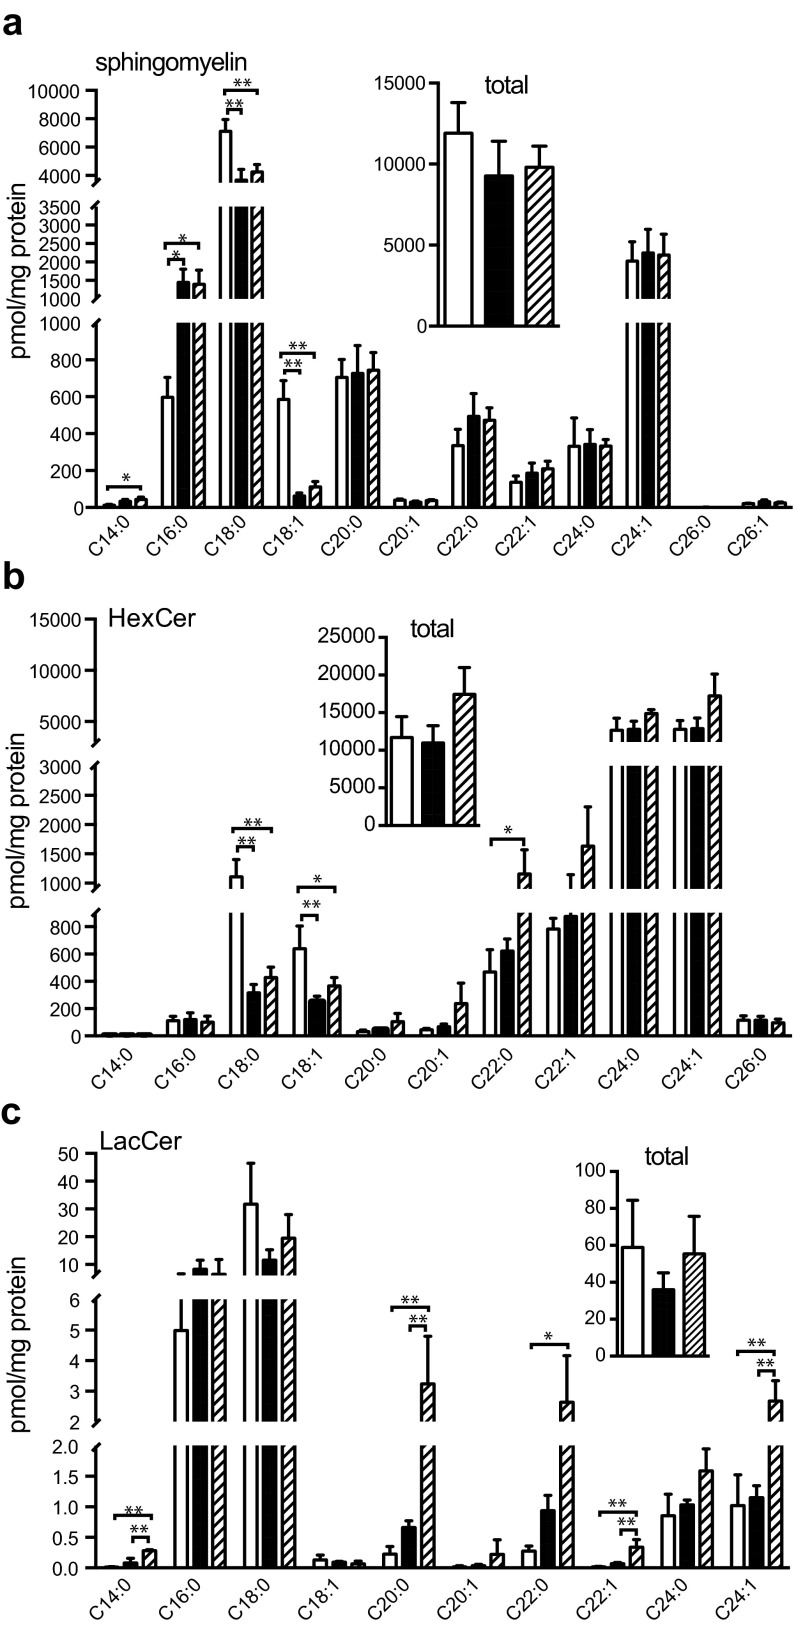
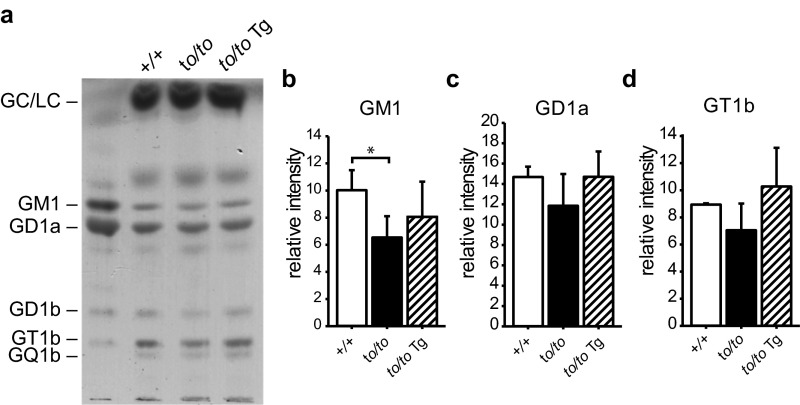
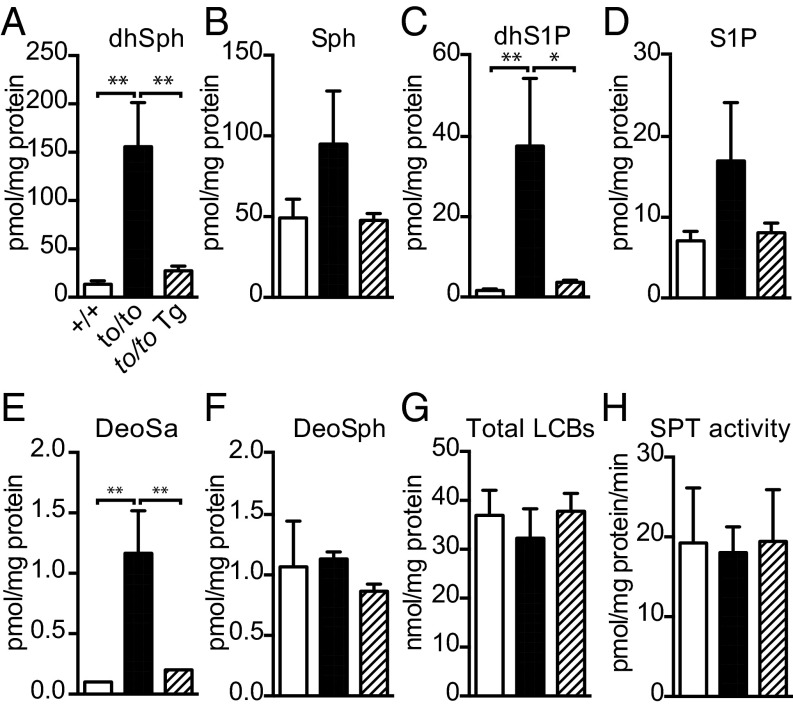
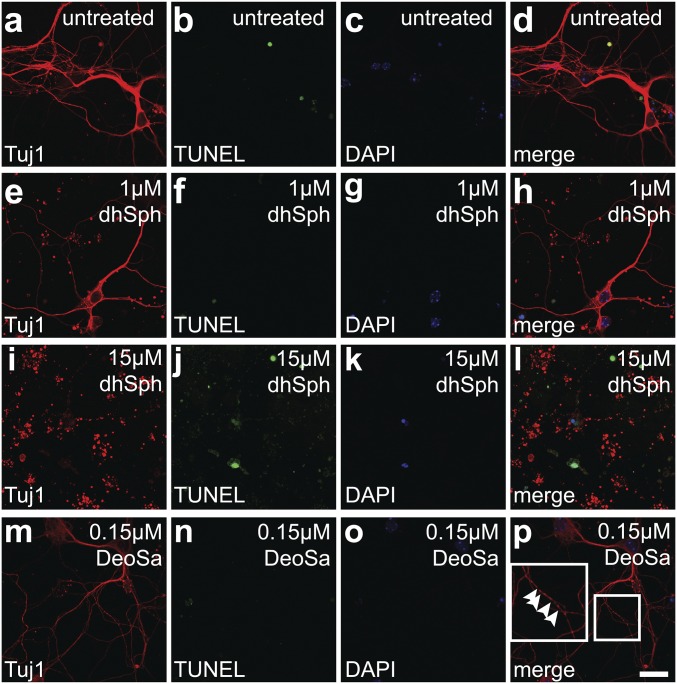
Sphingolipids exhibit extreme functional and chemical diversity that is in part determined by their hydrophobic moiety, ceramide. In mammals, the fatty acyl chain length variation of ceramides is determined by six (dihydro)ceramide synthase (CerS) isoforms. Previously, we and others showed that mutations in the major neuron-specific CerS1, which synthesizes 18-carbon fatty acyl (C18) ceramide, cause elevation of long-chain base (LCB) substrates and decrease in C18 ceramide and derivatives in the brain, leading to neurodegeneration in mice and myoclonus epilepsy with dementia in humans. Whether LCB elevation or C18 ceramide reduction leads to neurodegeneration is unclear. Here, we ectopically expressed CerS2, a nonneuronal CerS producing C22-C24 ceramides, in neurons of Cers1-deficient mice. Surprisingly, the Cers1 mutant pathology was almost completely suppressed. Because CerS2 cannot replenish C18 ceramide, the rescue is likely a result of LCB reduction. Consistent with this hypothesis, we found that only LCBs, the substrates common for all of the CerS isoforms, but not ceramides and complex sphingolipids, were restored to the wild-type levels in the Cers2-rescued Cers1 mutant mouse brains. Furthermore, LCBs induced neurite fragmentation in cultured neurons at concentrations corresponding to the elevated levels in the CerS1-deficient brain. The strong association of LCB levels with neuronal survival both in vivo and in vitro suggests high-level accumulation of LCBs is a possible underlying cause of the CerS1 deficiency-induced neuronal death.
Keywords: ceramide; ceramide synthase; long-chain base; neurodegeneration; sphingolipid.
Conflict of interest statement
The authors declare no conflict of interest.
Figures
Similar articles
-
Enzyme Activities of the Ceramide Synthases CERS2-6 Are Regulated by Phosphorylation in the C-terminal Region.J Biol Chem. 2016 Apr 1;291(14):7477-87. doi: 10.1074/jbc.M115.695858. Epub 2016 Feb 17. J Biol Chem. 2016. PMID: 26887952 Free PMC article.
-
Deep sphingolipidomic and metabolomic analyses of ceramide synthase 2 null mice reveal complex pathway-specific effects.J Lipid Res. 2025 Jul;66(7):100832. doi: 10.1016/j.jlr.2025.100832. Epub 2025 May 29. J Lipid Res. 2025. PMID: 40449731 Free PMC article.
-
Defective ceramide synthases in mice cause reduced amplitudes in electroretinograms and altered sphingolipid composition in retina and cornea.Eur J Neurosci. 2016 Jul;44(1):1700-13. doi: 10.1111/ejn.13260. Epub 2016 Jun 1. Eur J Neurosci. 2016. PMID: 27086873
-
The role of the ceramide acyl chain length in neurodegeneration: involvement of ceramide synthases.Neuromolecular Med. 2010 Dec;12(4):341-50. doi: 10.1007/s12017-010-8114-x. Epub 2010 May 26. Neuromolecular Med. 2010. PMID: 20502986 Review.
-
Synthesis and degradation pathways, functions, and pathology of ceramides and epidermal acylceramides.Prog Lipid Res. 2016 Jul;63:50-69. doi: 10.1016/j.plipres.2016.04.001. Epub 2016 Apr 21. Prog Lipid Res. 2016. PMID: 27107674 Review.
Cited by
-
Sphingolipids in neurodegeneration (with focus on ceramide and S1P).Adv Biol Regul. 2018 Dec;70:51-64. doi: 10.1016/j.jbior.2018.09.013. Epub 2018 Sep 22. Adv Biol Regul. 2018. PMID: 30287225 Free PMC article. Review.
-
Novel Cellular Functions of Very Long Chain-Fatty Acids: Insight From ELOVL4 Mutations.Front Cell Neurosci. 2019 Sep 20;13:428. doi: 10.3389/fncel.2019.00428. eCollection 2019. Front Cell Neurosci. 2019. PMID: 31616255 Free PMC article. Review.
-
Mycotoxin Fumonisin B1 Interferes Sphingolipid Metabolisms and Neural Tube Closure during Early Embryogenesis in Brown Tsaiya Ducks.Toxins (Basel). 2021 Oct 20;13(11):743. doi: 10.3390/toxins13110743. Toxins (Basel). 2021. PMID: 34822527 Free PMC article.
-
Ceramide-Induced Metabolic Stress Depletes Fumarate and Drives Mitophagy to Mediate Tumor Suppression.Cancer Res. 2025 Jun 20:10.1158/0008-5472.CAN-24-4042. doi: 10.1158/0008-5472.CAN-24-4042. Online ahead of print. Cancer Res. 2025. PMID: 40540357
-
The role of lipids in autophagy and its implication in neurodegeneration.Cell Stress. 2020 May 19;4(7):167-186. doi: 10.15698/cst2020.07.225. Cell Stress. 2020. PMID: 32656499 Free PMC article. Review.
References
-
- Hannun YA, Obeid LM. Principles of bioactive lipid signalling: Lessons from sphingolipids. Nat Rev Mol Cell Biol. 2008;9(2):139–150. - PubMed
Publication types
MeSH terms
Substances
Grants and funding
LinkOut - more resources
Full Text Sources
Other Literature Sources
Medical
Molecular Biology Databases
