. 2016 May 24;113(21):5916-21.
doi: 10.1073/pnas.1604894113. Epub 2016 May 9.

Primer release is the rate-limiting event in lagging-strand synthesis mediated by the T7 replisome

Affiliations

Primer release is the rate-limiting event in lagging-strand synthesis mediated by the T7 replisome

Alfredo J Hernandez et al. Proc Natl Acad Sci U S A. .

Abstract

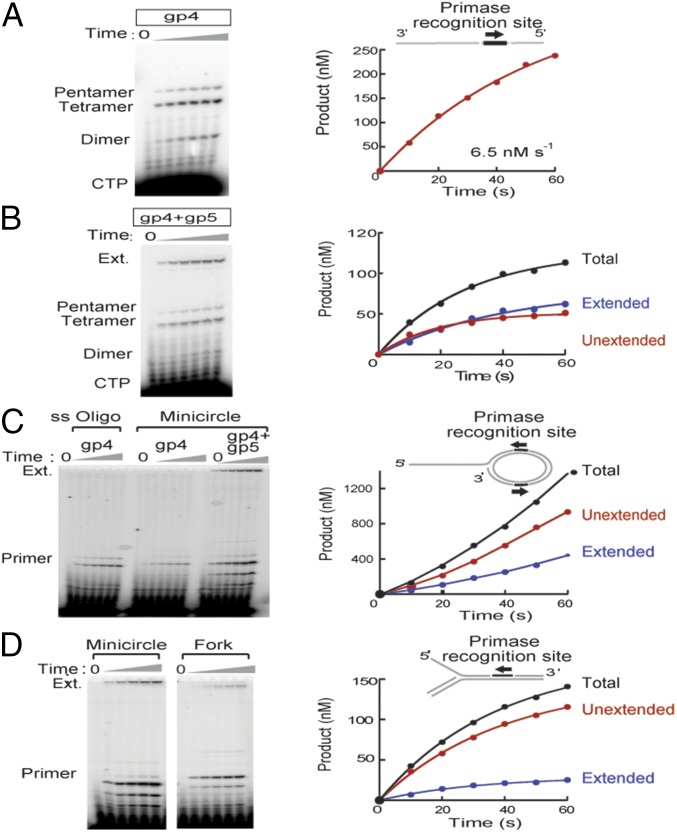
DNA replication occurs semidiscontinuously due to the antiparallel DNA strands and polarity of enzymatic DNA synthesis. Although the leading strand is synthesized continuously, the lagging strand is synthesized in small segments designated Okazaki fragments. Lagging-strand synthesis is a complex event requiring repeated cycles of RNA primer synthesis, transfer to the lagging-strand polymerase, and extension effected by cooperation between DNA primase and the lagging-strand polymerase. We examined events controlling Okazaki fragment initiation using the bacteriophage T7 replication system. Primer utilization by T7 DNA polymerase is slower than primer formation. Slow primer release from DNA primase allows the polymerase to engage the complex and is followed by a slow primer handoff step. The T7 single-stranded DNA binding protein increases primer formation and extension efficiency but promotes limited rounds of primer extension. We present a model describing Okazaki fragment initiation, the regulation of fragment length, and their implications for coordinated leading- and lagging-strand DNA synthesis.

Keywords: DNA primase; Okazaki fragment; primer; replisome.


Conflict of interest statement

The authors declare no conflict of interest.

Figures

Fig. 1.
Fig. 1.
Primer synthesis and extension by gp4 and T7 DNA polymerase. (A) gp4 unwinds dsDNA, using its C-terminal helicase domain. At PRSs, the gp4 primase domain synthesizes a short RNA, stabilizing it on the template and mediates its transfer to T7 DNA polymerase. (B) Gp4 enables T7 DNA polymerase to extend tetraribonucleotides; 0.1 µM gp4 hexamer or 0.2–25 µM gp4 primase fragment (PF) was incubated with ssDNA in the absence or presence of T7 DNA polymerase for 5 min at 25 °C. Products are indicated to the right of the gel image. Pentamers are likely not extended efficiently (37, 38). (C) Klenow fragment of E. coli DNA polymerase I and T4 DNA polymerase cannot extend short RNAs synthesized by gp4. Reactions were initiated by adding 10 mM MgCl2, and samples were taken at 10-s intervals. The 0 time point corresponds to a sample of the reaction before MgCl2 addition.
Fig. 2.
Fig. 2.
Primer utilization is slower than primer synthesis. (A, Left) Time course of primer synthesis by gp4 using a ssDNA with a single PRS. Samples were taken before addition of MgCl2 (t = 0) and in 10-s intervals following its addition. Products are indicated. (Right) Primer (tetra- and pentamer) concentration vs. time. The initial rate of primer formation is shown. Product concentration was determined as described in Materials and Methods. (B, Left) Time course of primer synthesis and extension by gp4 and T7 DNA polymerase. Products are indicated (Ext = extended product). (Right) Product concentration vs. time. Extended primer (blue), free (unused) primer (red), and total primer (black). (C, Left) Time course of primer synthesis and extension in the presence of gp4 and T7 DNA polymerase with a minicircle template, diagramed at Upper Right. Presence of gp4 and gp5/Trx is indicated. (Right) Product concentration vs. time for the minicircle reaction. (D, Left) Time course of primer synthesis and extension in the presence of gp4 and T7 DNA polymerase with a fork template (diagramed Upper Right). For comparison, a reaction using the minicircle in C as template is included (run on the same gel, but cropped for simplicity). (Right) Product concentration vs. time for the fork substrate.
Fig. S1.
Fig. S1.
Active-site titration of gp4 by measurement of product burst amplitude. A fixed, nominal concentration of gp4 (1 µM hexamer, determined by Bradford assay) was incubated at 25 °C with increasing concentrations of a single-stranded template containing a primase recognition site, in the presence of ATP and [α-32P] CTP. Reactions were started by the addition of MgCl2 to a final concentration of 10 mM, allowed to react for 1 s, and quenched with 125 mM EDTA and 0.1% SDS. Products were resolved by denaturing PAGE, and visualized by phosphorimager. The concentration of full-length primer product formed was plotted as a function of template concentration, and the data were fit to a quadratic equation to determine the maximum amount of active gp4–DNA complex formed (0.505 µM) and the KD for their interaction (50 nM). The percentage of active gp4 in our preparations was consistently ∼50%.
Fig. 3.
Fig. 3.
Primer synthesis does not limit extension. (A, Left) Primer extension reactions were carried out with varying concentrations of ATP and CTP, using [α-32P] dGTP to visualize extension products only. Observed rate constants, kobs, for primer utilization were plotted as a function of nucleotide concentration. (Center) Observed rate constant for primer utilization as a function of AC concentration. Reactions contained 0.5 mM CTP to allow extension of the dinucleotide to a primer. (Right) Observed rate constant for primer extension as a function of the concentration of the tetraribonucleotide ACCC. (B) Tabular representation of the data from A. (C) Observed rate of primer utilization as a function of T7 DNA polymerase concentration. Reaction time courses were fit as above, and the observed rate constant for extension is plotted as a function of polymerase concentration.
Fig. S2.
Fig. S2.
Primer extension progress curves used to construct the plots in Fig. 3A. Varying concentrations of ATP and CTP (Left), AC diribonucleotide [with a constant (CTP)] (Center), and preformed tetranucleotide ACCC (Right) were used in primer synthesis and extension reactions set up as in Fig. 2B using [α-32P] dGTP to detect extension products only. Concentrations of nucleotides (in μM) are indicated to the right of each curve. The lines represent fits to single-exponential equations. Aliquots were removed at 10-s intervals on addition of 10 mM MgCl2.
Fig. 4.
Fig. 4.
Pre–steady-state analysis of primer synthesis and extension. (A) Primer synthesis by gp4 occurs with a burst of primer formation. (Left) Time course of primer synthesis by gp4 using an ssDNA with a single PRS using a rapid quench-flow instrument. (leftmost well:10-min control). (Right) Primer formation vs. time. Data were fit to the pre–steady-state burst equation. (B) Single-turnover primer synthesis by gp4. (Left) Time course of tetramer formation. (Right) Plot of product formation vs. time. Data were fit by numerical integration to the model shown; solid lines show the fit. (C) Single-turnover primer synthesis and extension by gp4 and T7 DNA polymerase. (Left) Denaturing PAGE of reaction time course. (Right) Plot of product formation vs. time. Used primer (blue), free primer (red), and total primer (black). Data were fit to single- or double-exponential functions. Observed rate constants and reaction amplitudes are indicated.
Fig. S3.
Fig. S3.
Observation of a lag in primer extension. (A) Primer synthesis and extension reactions were assembled as described in Materials and Methods and analyzed using a rapid-quench instrument. Samples (t = 0, 0.2, 0.25, 0.3, 0.4, 0.6, 0.8, 1, 2, 3.5, 5, 7.5, and 10 s) were resolved by denaturing PAGE. (B) The extension product was quantified and plotted as a function of time; data up to 2 s are shown. A lag in product buildup, indicating a step preceding the observed state, is clearly visible.
Fig. S4.
Fig. S4.
DNA synthesis by T7 DNA polymerase is rapid. (A, Top) Time course of primer extension by T7 DNA polymerase in the presence of all four dNTPs. Enzyme (1 µM) was incubated with the single-stranded template used for primer synthesis and extension reactions (0.1 µM) (which was annealed to a 5′-end–labeled 19-nt primer). The reaction was initiated by the addition of 10 mM MgCl2 and 0.3 mM dNTPs (t = 0, 0.0035, 0.004, 0.005, 0.0075, 0.01, 0.015, 0.02, 0.025, 0.035, 0.05, 0.075, and 0.1 s). (Middle) Products were resolved by denaturing PAGE. (Bottom) Extension species were quantified and plotted as a function of time. The data were fit to a processive polymerization model using Kintek Explorer (Kintek), yielding a rate constant for the first polymerization step of 140 s−1. Fitting the decay of intact primer gives a rate constant of similar magnitude (180 s−1). (B) Time course of single-nucleotide incorporation by T7 DNA polymerase. (Upper) Time course of primer extension by T7 DNA polymerase using the primer/template and reaction conditions as in A and the next encoded nucleotide, dGTP only (0.3 mM final concentration). Denaturing PAGE showing that the primer is rapidly extended by the addition of a single nucleotide (t = 0.005, 0.0075, 0.01, 0.015, 0.025, 0.03, 0.05, 0.075, 0.1, 0.15, 0.25, 0.3, and 0.75 s). (Lower) The fraction of product formed was plotted as a function of time (up to 0.15 s) and the data fit to a single-exponential equation, yielding the rate constant for single-nucleotide incorporation, 240 s−1, a value in line with those reported elsewhere (17).
Fig. 5.
Fig. 5.
gp2.5 increases the efficiency of primer synthesis and extension while restricting product formation. (A) Effect of gp2.5 on primer synthesis. (Upper) Primer synthesis ± 3 µM gp2.5 (t = 0, 10, 20, 30, 40, and 50 s). (Lower) primer formation vs time. − (blue) and + (red) 3 µM gp2.5 (t = 0, 10, 20, 30, 40, 50, and 60 s). The initial rate of primer formation is indicated. (B) Effect of gp2.5 on primer synthesis and extension. (Upper) Primer synthesis and extension in the absence and presence of gp2.5. Primer and extension products are indicated (t = 0, 10, 20, 30, 40, 50, and 60 s). (Lower) normalized product formation vs. time for reactions lacking gp2.5 (blue), or with WT (red) or Δ-C gp2.5 (green). (t = 0, 5, 10, 20, 30, 40, 50, 60, 70, 80, 90, and 100 s). Observed rate constants are indicated. (C) Effect of gp2.5 on single-turnover primer synthesis and extension. (Left) Primer synthesis and extension (Materials and Methods) ± 20 µM gp2.5. (t = 0, 5, 10, 20, 30, 40, 50, 60, 70, 80, 90, 100, and 300 s). Primer and extension products are indicated. Right, normalized product formation vs. time for single-turnover reactions lacking gp2.5 (blue), or in the presence of WT gp2.5 (red). (t = 0, 5, 10, 20, 30, 40, 50, 60, 70, 80, 90, and 100 s). Observed rate constants are indicated.
Fig. S5.
Fig. S5.
(A) Unnormalized plots of product formation vs. time in Fig. 5. (Left) Product formation as a function of time for multiple-turnover primer synthesis reactions lacking gp2.5 (blue), in the presence of WT (red), or Δ-C gp2.5 (green) (t = 0, 5, 10, 20, 30, 40, 50, 60, 70, 80, 90, and 100 s) Observed rate constants and reaction amplitudes are indicated. (Right) Product formation as a function of time for single-turnover primer synthesis reactions lacking gp2.5 (blue), or in the presence of WT gp2.5 (red) (t = 0, 5, 10, 20, 30, 40, 50, 60, 70, 80, 90, and 100 s). Observed rate constants and reaction amplitudes are indicated. (B) Gp2.5 also enhances tetramer formation by gp4 on a fork substrate. (Upper) Representation of fork DNA substrate used (0.1 µM). (Lower) Time course of primer synthesis catalyzed by gp4 (0.1 µM hexamer) in the absence (Left) and presence (Right) of 3 µM gp2.5, using [α-32P] CTP as the labeled substrate (t = 0, 10, 20, 30, 40, 50, and 60 s). Products are indicated to the left of the gel picture. The samples were produced in the same experiment but were run on different gels. (C) E. coli SSB does not inhibit primer extension. Reactions were set up as in Fig. 5B, with 3 μM gp2.5 or E. coli SSB, and aliquots were removed at 10-s intervals on addition of 10 mM MgCl2.
Fig. S6.
Fig. S6.
Gp2.5 decreases the dissociation of the dimer product. (A) Scheme to test the effect of gp2.5 on dimer dissociation by competitive inhibition of primer synthesis by gp4. Primer synthesis reactions (as in Fig. 2A) containing ATP and labeled CTP were incubated with various concentrations of exogenously added, unlabeled AC diribonucleotide, in the absence and in the presence of 3 μM gp2.5. (B) Plot of the relative rate of primer synthesis as a function of added AC concentration. AC inhibits primer synthesis reactions lacking gp2.5 with a Ki of 30 µM. This value is 60 µM in the presence of gp2.5. A higher concentration of unlabeled AC dinucleotide being required to inhibit primer synthesis suggests that a lower proportion of labeled intermediates are lost through dissociation.
Fig. S7.
Fig. S7.
Gp2.5 does not inhibit T7 DNA polymerase. (A and B) Denaturing PAGE showing efficient extension of 0.1 μM 5′-end–labeled primers by 0.4 μM T7 DNA polymerase in the presence of 0.1 μM gp4 hexamer and/or 3 μM gp2.5 using (A) a primer/template duplex (Right: t = 0, 5, 10, 15, 20, 30, 40, 50, and 60 s; Left: t = 0, 5, 10, 20, 30, and 40 s) or (B) a fork substrate (Right and Left: t = 0, 10, 20, 30, 40, 50, and 60 s; Center: t = 0, 10, 20, 30, 40, and 50 s). The structure of the substrate is shown above the gel pictures. (C) Gp2.5 (0, 0.11, 0.33, 1, 3, and 9 μM) enhances DNA synthesis by T7 DNA polymerase (50 nM) using a primed-M13 substrate (20 nM).
Fig. 6.
Fig. 6.
Gp2.5 regulates Okazaki fragment length through primer utilization. (A) Effect of WT or Δ-C gp2.5 (3 µM) on lagging-strand DNA (labeled at the primer terminus). (Left) Samples quenched at 1 or 5 min were loaded on a 0.8% agarose gel (size markers are indicated). Brackets indicate range of extension products. (Right) Effect of gp2.5 on primer synthesis and extension using a minicircle. Samples taken at 10-s intervals and loaded on a denaturing 25% polyacrylamide gel. (B) Quantification of A. (C) Effect of gp2.5 on the time course of lagging-strand product formation. Samples were loaded on a 5% denaturing polyacrylamide gel; 5′ end-labeled size markers are indicated. A labeling artifact dependent on gp5 and gp2.5 is indicated (*).
Fig. 7.
Fig. 7.
Key steps in lagging-strand initiation by gp4 and T7 DNA polymerase and the regulation of Okazaki fragment length by gp2.5. (A) Primers are rapidly synthesized by gp4, but their release is slow, as is their handoff to polymerase. Gp2.5 lowers the rate of primer synthesis but promotes formation of full-length primer by gp4 and assists in assembly of an extension-competent complex. After the primer/template is correctly engaged by the polymerase, DNA synthesis proceeds rapidly. (B) Gp2.5 regulates Okazaki fragment length by restricting access to PRSs and by limiting primer extension. In the absence of gp2.5, encounter of each (or many) PRS leads to primer synthesis, and release of the Okazaki fragment by the polymerase results in short Okazaki fragments. In the presence of gp2.5, most newly encountered PRSs are bypassed, leading to less frequent priming and longer Okazaki fragments. Ultimately, dissociation of gp2.5 from the template, or from the lagging-strand polymerase, occurs and a primer is extended at a new recognition site, releasing the nascent Okazaki fragment.
Fig. S8.
Fig. S8.
Primer release from gp4 is essentially irreversible. (A) Free primer synthesized by gp4, after being slowly released, could rebind the enzyme. (B) The rate of primer synthesis reactions using a single-stranded DNA template, ATP, and labeled CTP is plotted as a function of exogenously added, unlabeled ACCC primer. The inhibition constant, Ki, (20 µM) calculated with the Cheng–Prusoff equation (44) and values of [E] = 50 nM and [S]/KM = 10 are shown. (C) An estimate of the association rate constant of ACCC for gp4 can be calculated from the Ki and the dissociation (release) rate constant. This value indicates that the reassociation of a primer to gp4 is probably inefficient and proceeds very slowly, given the amount of product formed during our experimental timescale.

Similar articles

Cited by

References

    1. Kornberg A, Baker TA. DNA Replication. 2nd Ed. W.H. Freeman; New York: 1992. p. xiv.
    1. Costa A, Hood IV, Berger JM. Mechanisms for initiating cellular DNA replication. Annu Rev Biochem. 2013;82:25–54. - PMC - PubMed
    1. Balakrishnan L, Bambara RA. Okazaki fragment metabolism. Cold Spring Harb Perspect Biol. 2013;5(2):a010173. - PMC - PubMed
    1. Hamdan SM, Richardson CC. Motors, switches, and contacts in the replisome. Annu Rev Biochem. 2009;78:205–243. - PubMed
    1. Lee SJ, Richardson CC. Choreography of bacteriophage T7 DNA replication. Curr Opin Chem Biol. 2011;15(5):580–586. - PMC - PubMed

Publication types

MeSH terms

LinkOut - more resources